Sample Category Title
Trump’s Inauguration Day
In focus today
The main focus of the week is Donald Trump's 2nd Inauguration which takes place today at 18:00 CET. He will be officially sworn in as the President of the US and markets will closely follow his first executive orders and remarks to the public in the evening with special focus on possible tariff announcements and cuts to regulation.
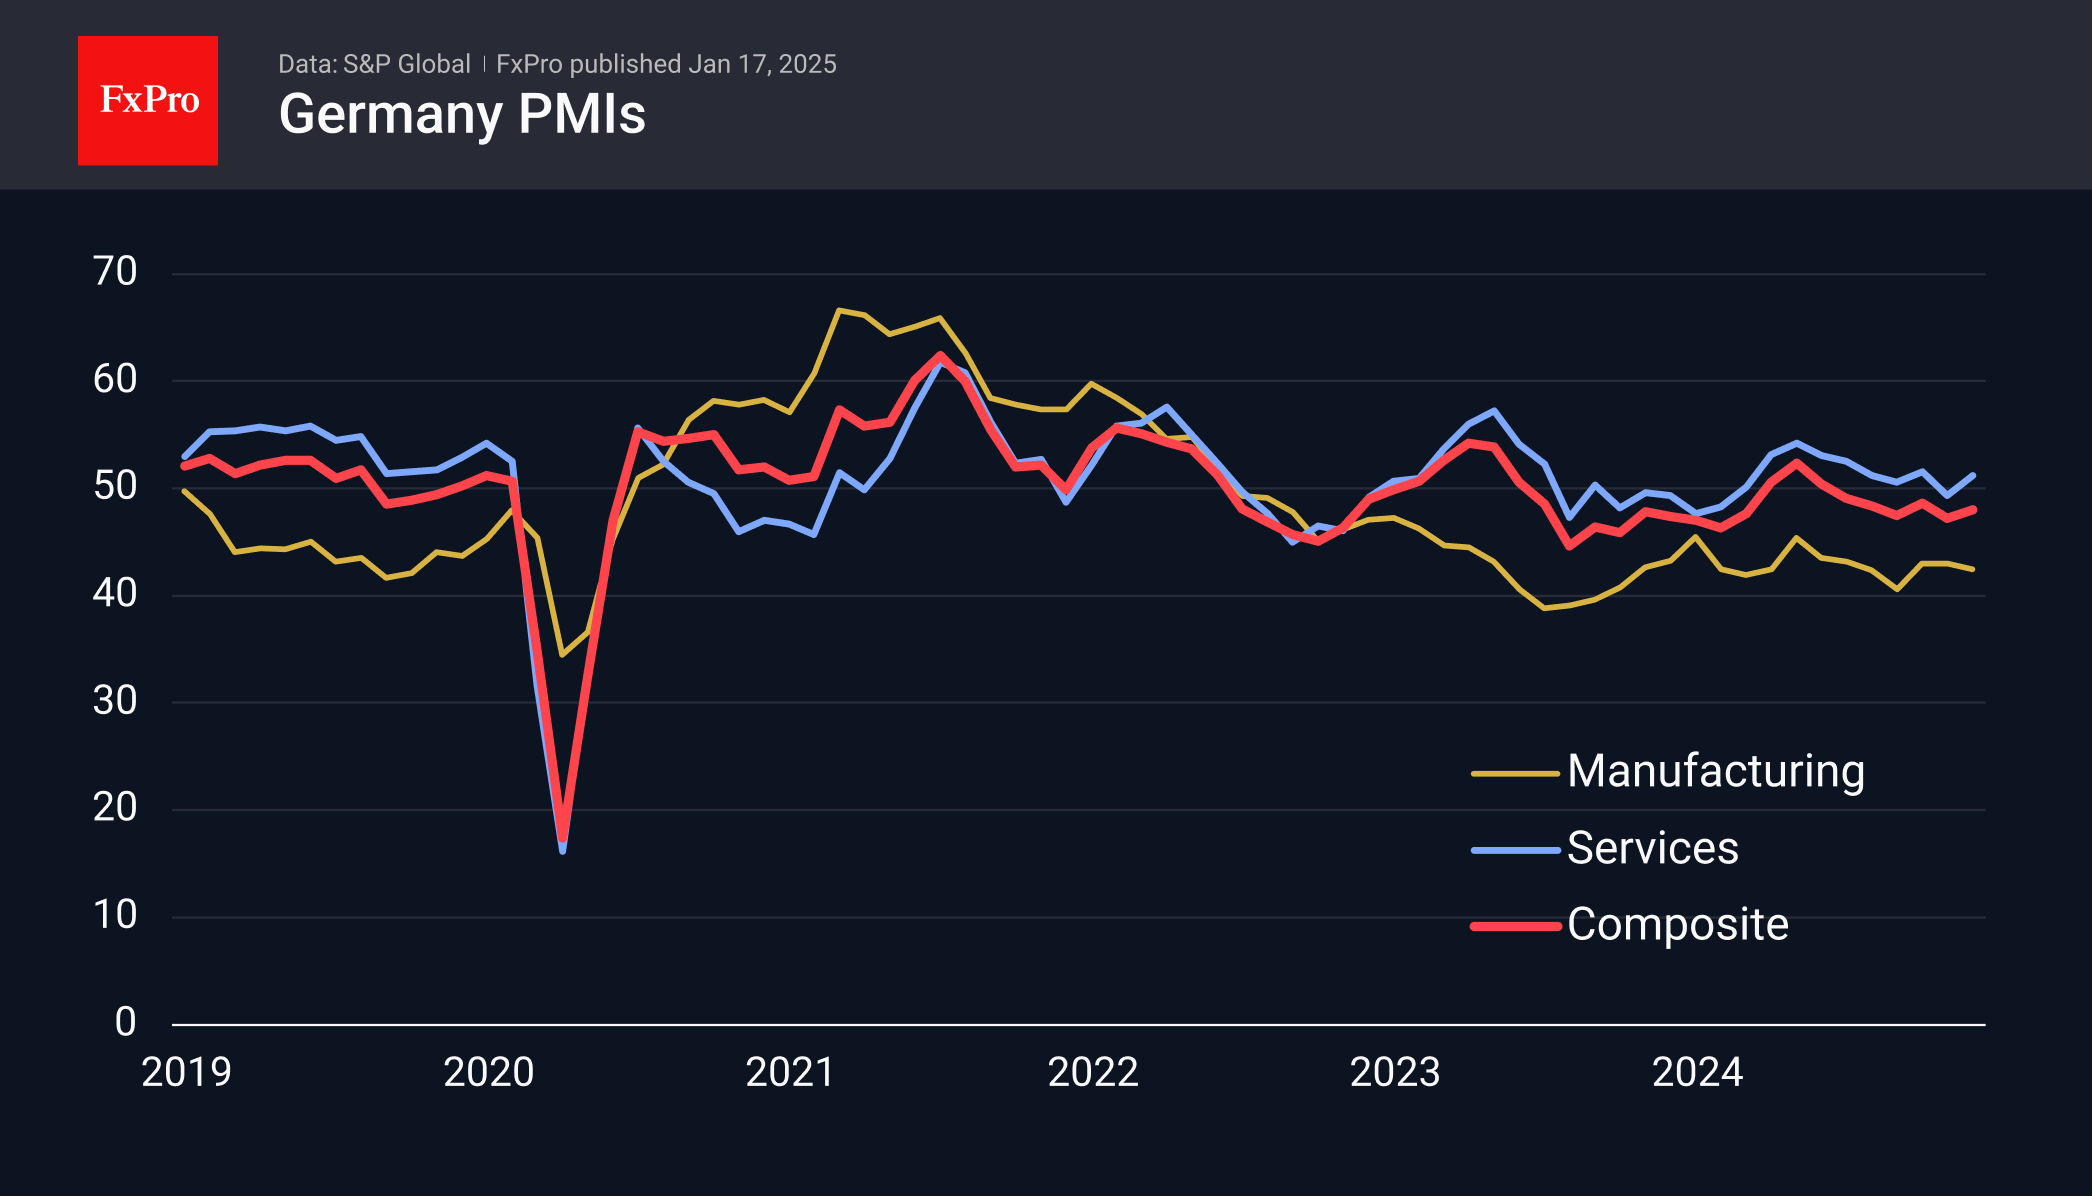
Otherwise, the week ahead will be relatively quiet on the data front, with the exception of Friday when flash PMIs for both the euro area and the US are released. Financial markets have been particularly attentive to this indicator as focus has shifted to growth following the continued lower inflation momentum movements observed recently in especially the euro Area.
Economic and market news
What happened overnight
In the US, President Trump reiterated his pledge to initiate the largest deportation effort in US history on day one, aiming to remove millions of immigrants and implement stricter immigration limits.
What happened over the weekend
In the euro area, final HICP data came in at expected levels with 0.4% m/m and 2.4% y/y for December on Friday. In the details, momentum continued lower for the eighth consecutive month, now standing at 3.5% in the 3m/3m SAAR measure. The easing momentum will cause the yearly inflation rate to also decline significantly this year, which was acknowledged by the ECB at the December meeting. Hence, underlying inflation clearly continued to give green light for further rate cuts by the ECB.
In the US, industrial production for December overshot expectations at 0.9% (cons: 0.3%, prior: -0.1%) and data for November was revised up to 0.2% from -0.1%. The increase was supported by a rise in factory output, suggesting that manufacturing is stabilizing after two years of weakness.
In China, USD/CNH dropped from 7.355 to below 7.34 following Trump writing on Truth Social that he had a very good call with Xi Jinping. The message by Trump eased concerns over a trade war, saying he expects they will solve many problems together. Read more in China Flash - GDP surprises upwards but housing stabilisation more important, 17 January.
In the Middle East, a ceasefire deal took effect between Isreal and Hamas following 15 months of war between the two. The ceasefire was postponed by three hours due to a holdup in the release of three Israeli hostages. The deal acts as the first of three potential phases set to follow further negotiations in the weeks ahead. With the second phase including a complete withdrawal of Israeli troops from Gaza and the third phase including Gaza's reconstruction.
Equities: Global equities rose on Friday and for the week, following what we consider an almost full complement of support for equities last week. We saw a soft US inflation print, which sent yields lower, generally strong demand data, a very strong start to the earnings season, and finally, geopolitical improvement with the ceasefire in Gaza. Therefore, in our opinion, it should not be surprising to see global equities up by 2.5% last week, led by cyclical stocks, bringing the MSCI back to just 1% shy of its all-time high. In the US on Friday, the Dow rose by 0.8%, the S&P 500 by 1.0%, the Nasdaq by 1.5%, and the Russell 2000 by 0.4%. This morning, most Asian markets are in the green, led by Chinese shares in Hong Kong, while South Korean equities are underperforming. US and European futures are fluctuating around Friday's close.
FI: The bond market recovered modestly last week on the back soft US inflation data and comments from Federal Reserve's Waller. However, the 10Y US treasury yield has risen some 100bp since September, and with the inauguration of Trump today sentiment can change quickly.
FX: USD rose against the rest of the G10 on Friday ahead of President Trump's inauguration today. NOK in particular was under pressure, but JPY, CAD and GBP also felt the heat. EUR/USD traded around the 1.03 level and EUR/NOK rose firmly above 11.70.
What Next: Trump 2.0 and BoJ Hike
On Monday, January 20th, U.S. markets are closed for Martin Luther King Day celebrations, which will affect the trading hours of exchange-traded instruments such as U.S. stocks, indices and futures. Trump’s inauguration is scheduled for the same day, which may affect trading dynamics in the currency market and global stock markets.
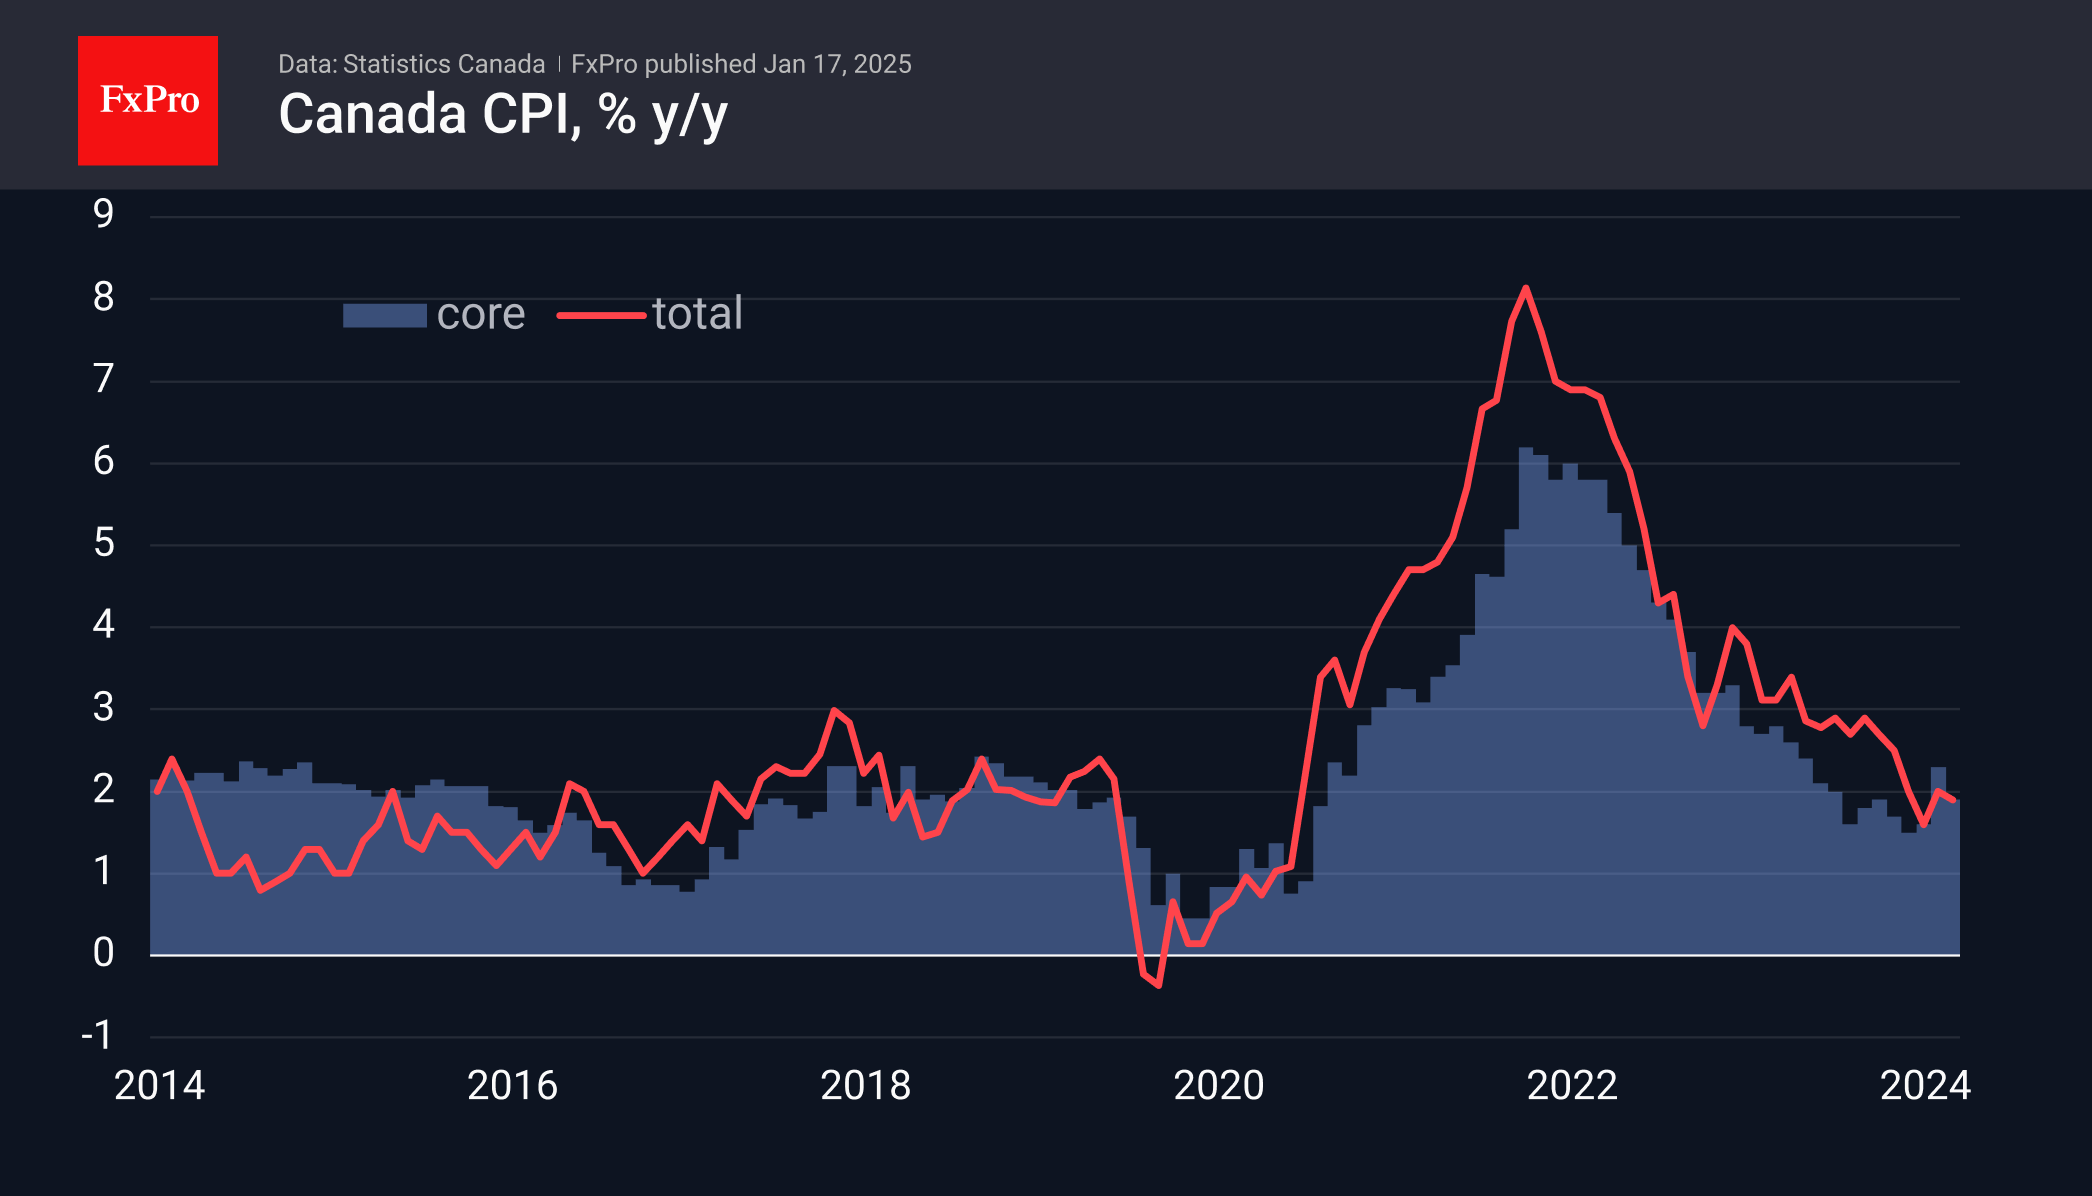
On Tuesday, the dynamics of the Canadian dollar can be affected by the report on consumer inflation. Since August, this indicator has fallen to the 2% target for the Bank of Canada, allowing it to reduce the rate to support the economy. But the big question now is whether the 7% inflation rate spurred the Loonie’s collapse over the last quarter. A CPI acceleration could support the Canadian dollar on a reassessment of the outlook.
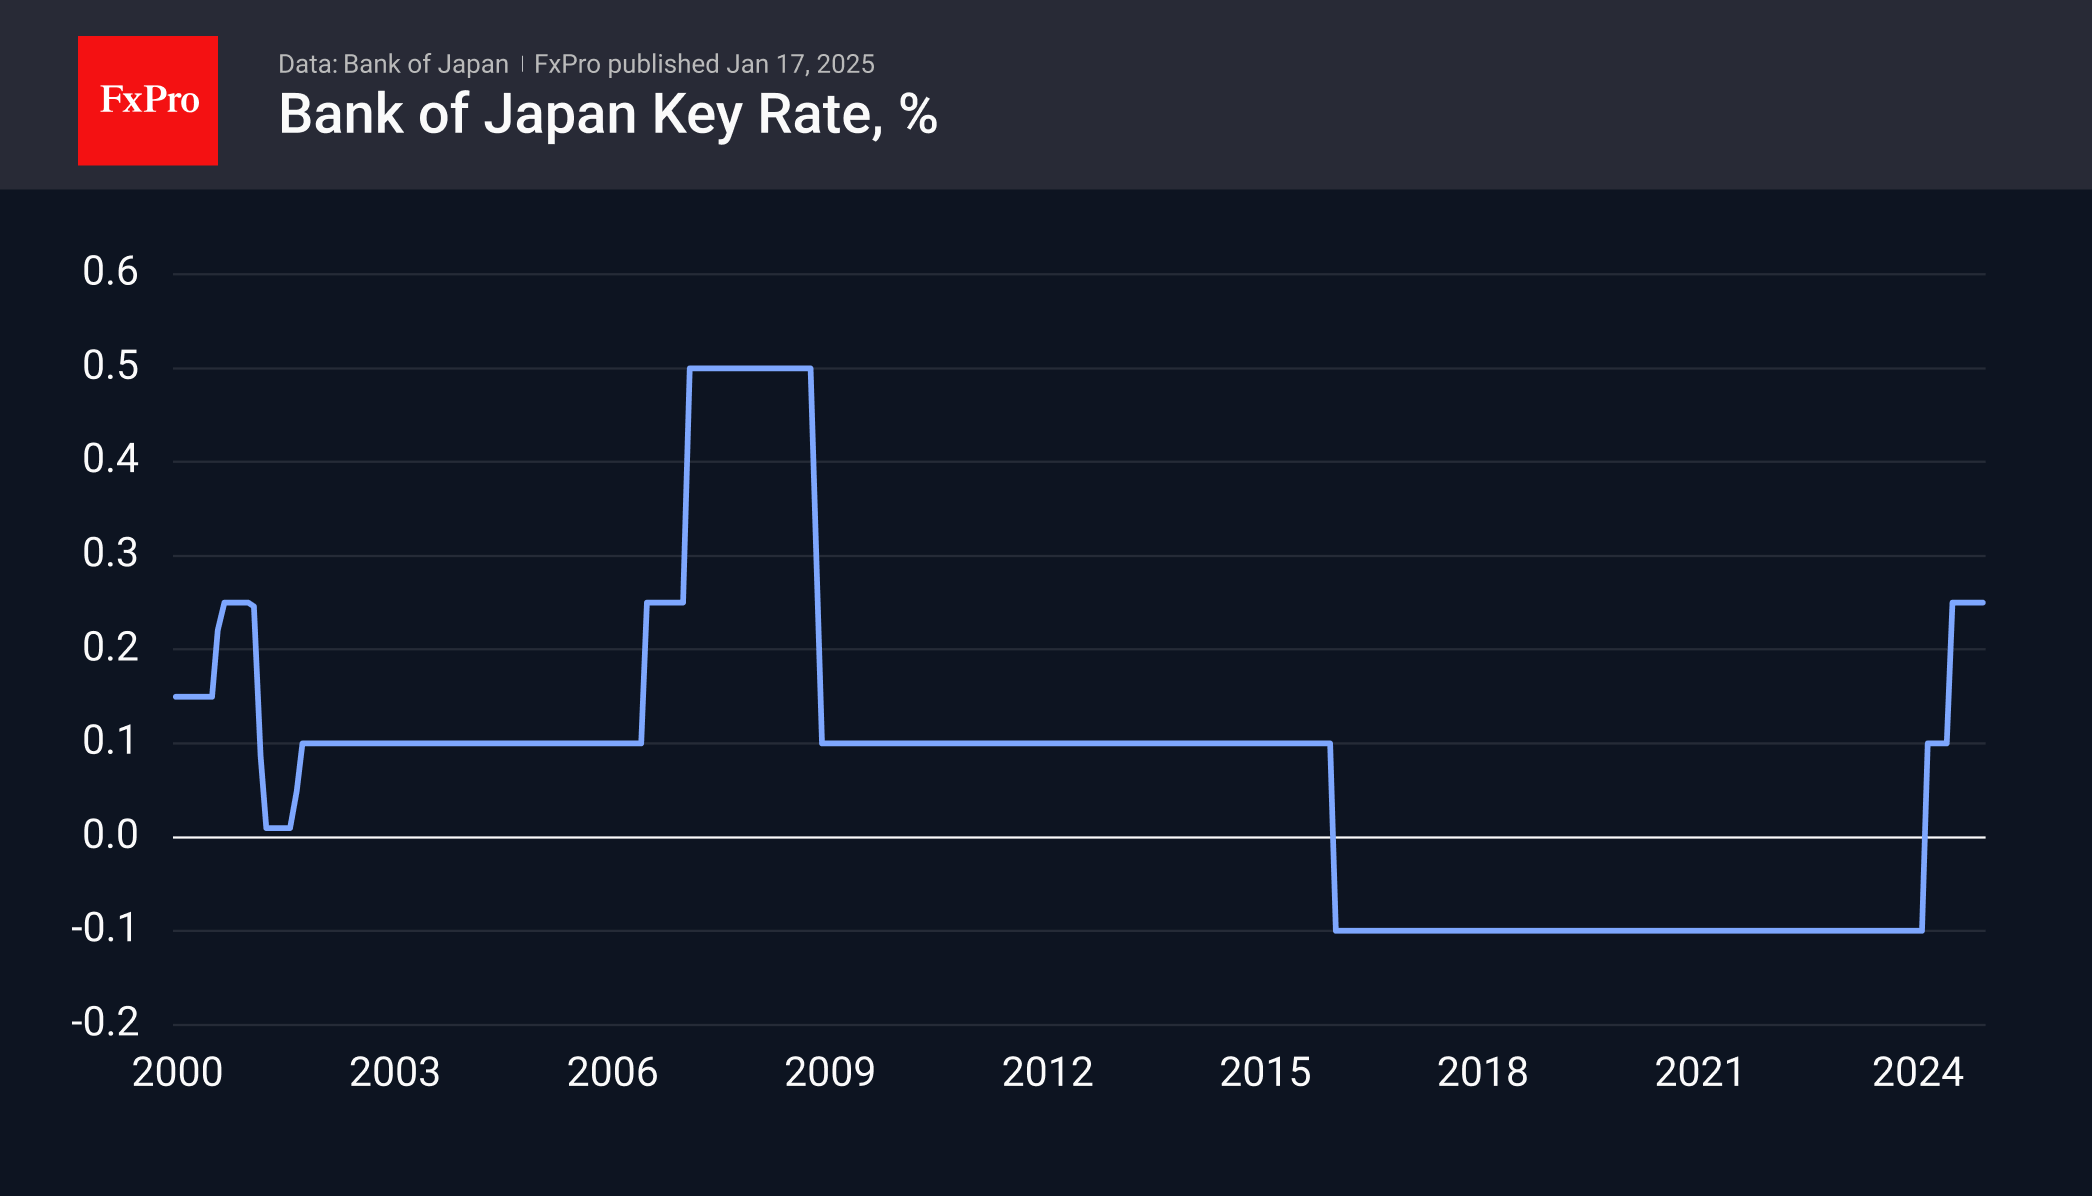
The Bank of Japan may raise its key rate Friday morning, marking the third increase in nearly a year. This very Japanese-style leisurely phase of policy normalisation is likely to continue, guided by the Rising Sun’s long-term government bond yields flying to all-time highs. The tightening of the policy could provide fundamental support to the Japanese yen.
Also, on Friday, the preliminary estimates of PMI indices for European countries will be released. These are often very influential indicators that can visibly affect the dynamics of the euro, especially for Germany.
EUR/USD Faces Uphill Battle: Will Bulls Regain Momentum?
Key Highlights
- EUR/USD started a consolidation phase below the 1.0350 resistance.
- A major bearish trend line is forming with resistance at 1.0315 on the 4-hour chart.
- GBP/USD is consolidation losses below the 1.0320 resistance.
- Crude oil prices rallies toward $80.00 before it corrected some gains.
EUR/USD Technical Analysis
The Euro remained in a bearish zone below 1.0350 against the US Dollar. EUR/USD even extended losses and traded below the 1.0220 support.
Looking at the 4-hour chart, the pair traded as low as 1.0176 and is currently consolidating losses. There was a close below the 1.0350 level, the 100 simple moving average (red, 4-hour), and the 200 simple moving average (green, 4-hour).
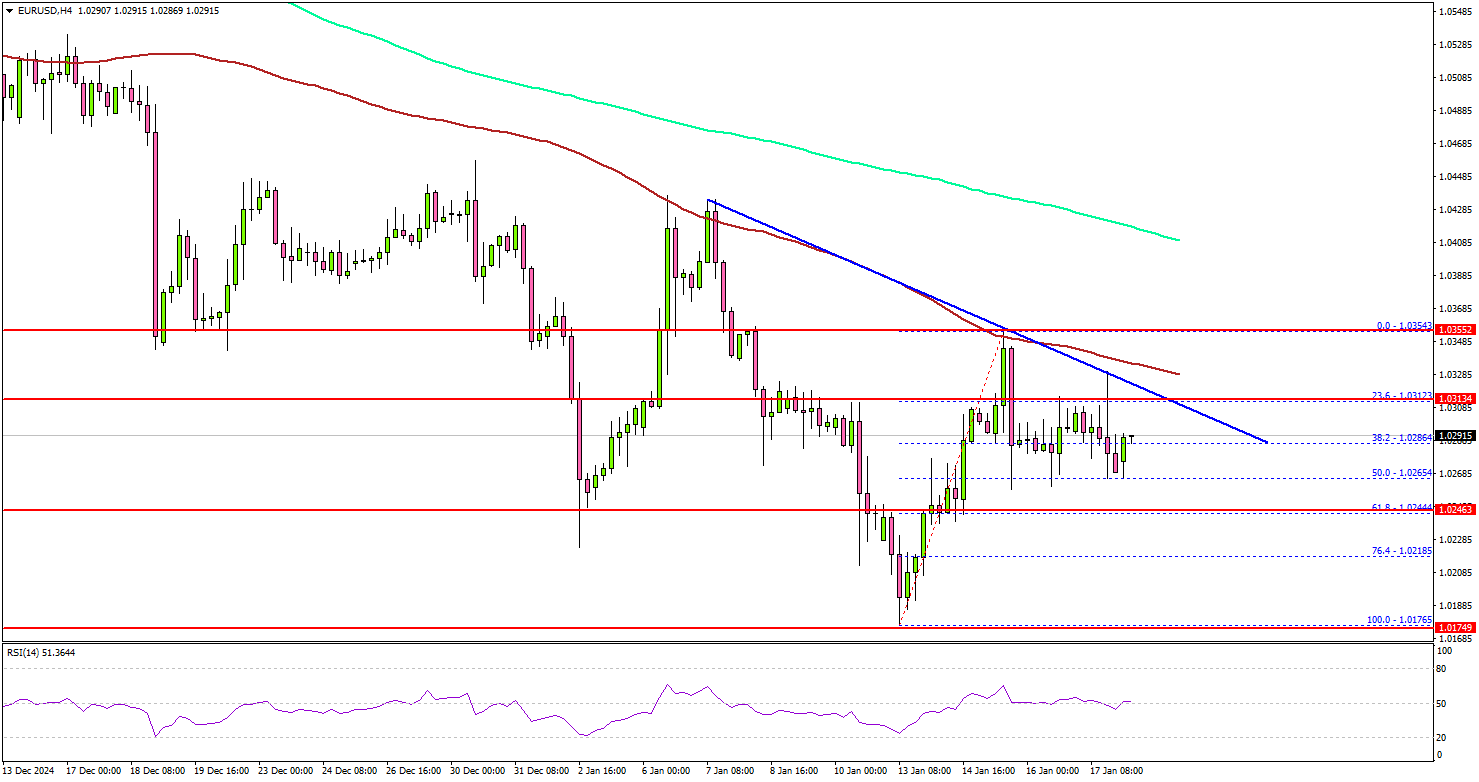
It seems to be facing resistance near the 1.0300 and 1.0315 levels. The next major resistance is near the 1.0350 level. A close above the 1.0350 level could set the tone for another increase. In the stated case, the pair could rise toward the 1.0420 resistance. The main hurdle could be 1.0450.
On the downside, immediate support sits near the 1.0265 level. The next key support sits near the 1.0245 level. Any more losses could send the pair toward the 1.0200 level.
Looking at GBP/USD, the pair started a short-term recovery wave, but the bears are active near the 1.2280 resistance zone.
Upcoming Economic Events:
- Euro Zone Construction Output for Nov 2024 (YoY) – Forecast +1.1%, versus +1.0% previous.
Dollar Index (DXY) Elliott Wave Calling The path
In this technical article we’re going to take a quick look at the Elliott Wave charts of Dollar Index (DXY) published in members area of the website. As our members are aware, the DXY is currently showing impulsive bullish sequences in the cycle from the September low. As a result, we are leaning towards the long side at this stage.
Recently, the Dollar Index has completed a 3-wave pullback, with buyers stepping in precisely at the equal legs zone. In this article, we will dive deeper into the Elliott Wave forecast and explain the reasoning behind our outlook.
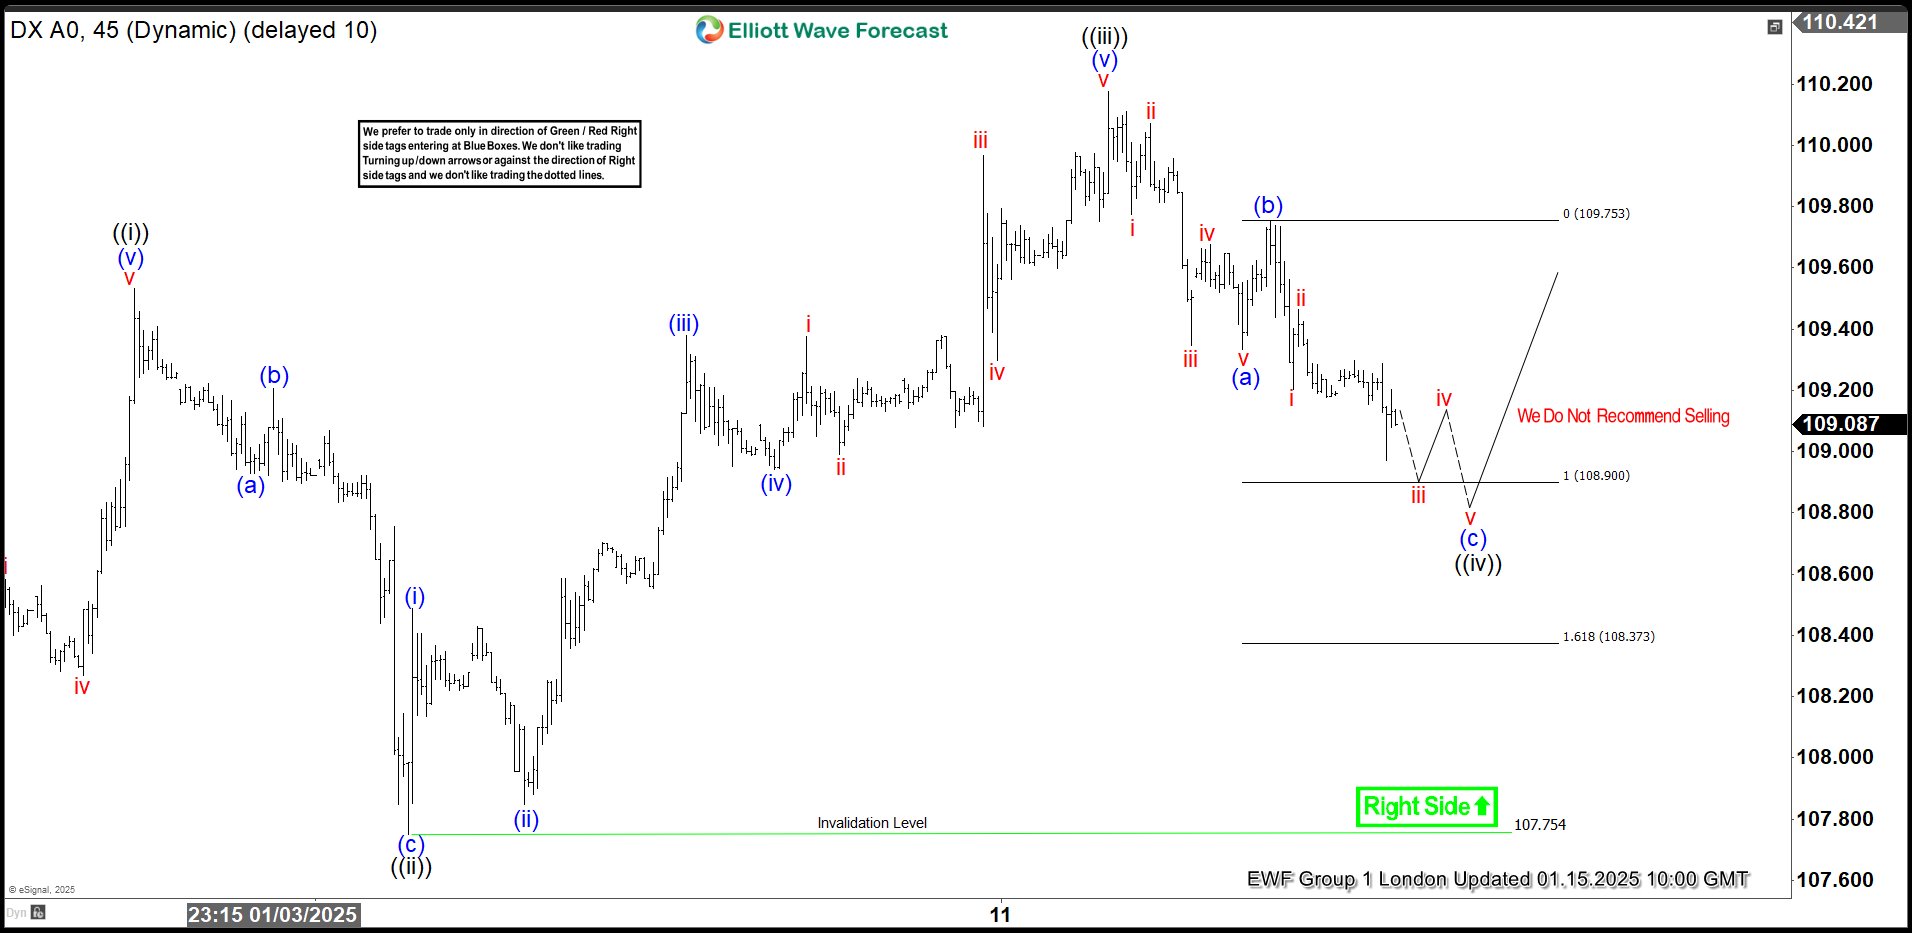
DXY H1 London Update 01.15.2025
The current view suggests that the Dollar is forming a ((iv)) black pullback as Elliott Wave Zig-Zag Pattern. The structure of the correction remains incomplete, indicating more short-term weakness. We expect to see another leg down towards the equal legs zone between 108.900 and 108.373 (the potential buyers’ zone).
Once the extreme zone is reached, we anticipate that potential buyers will step in, which could lead to a further rally towards new highs, or at least a three-wave bounce.
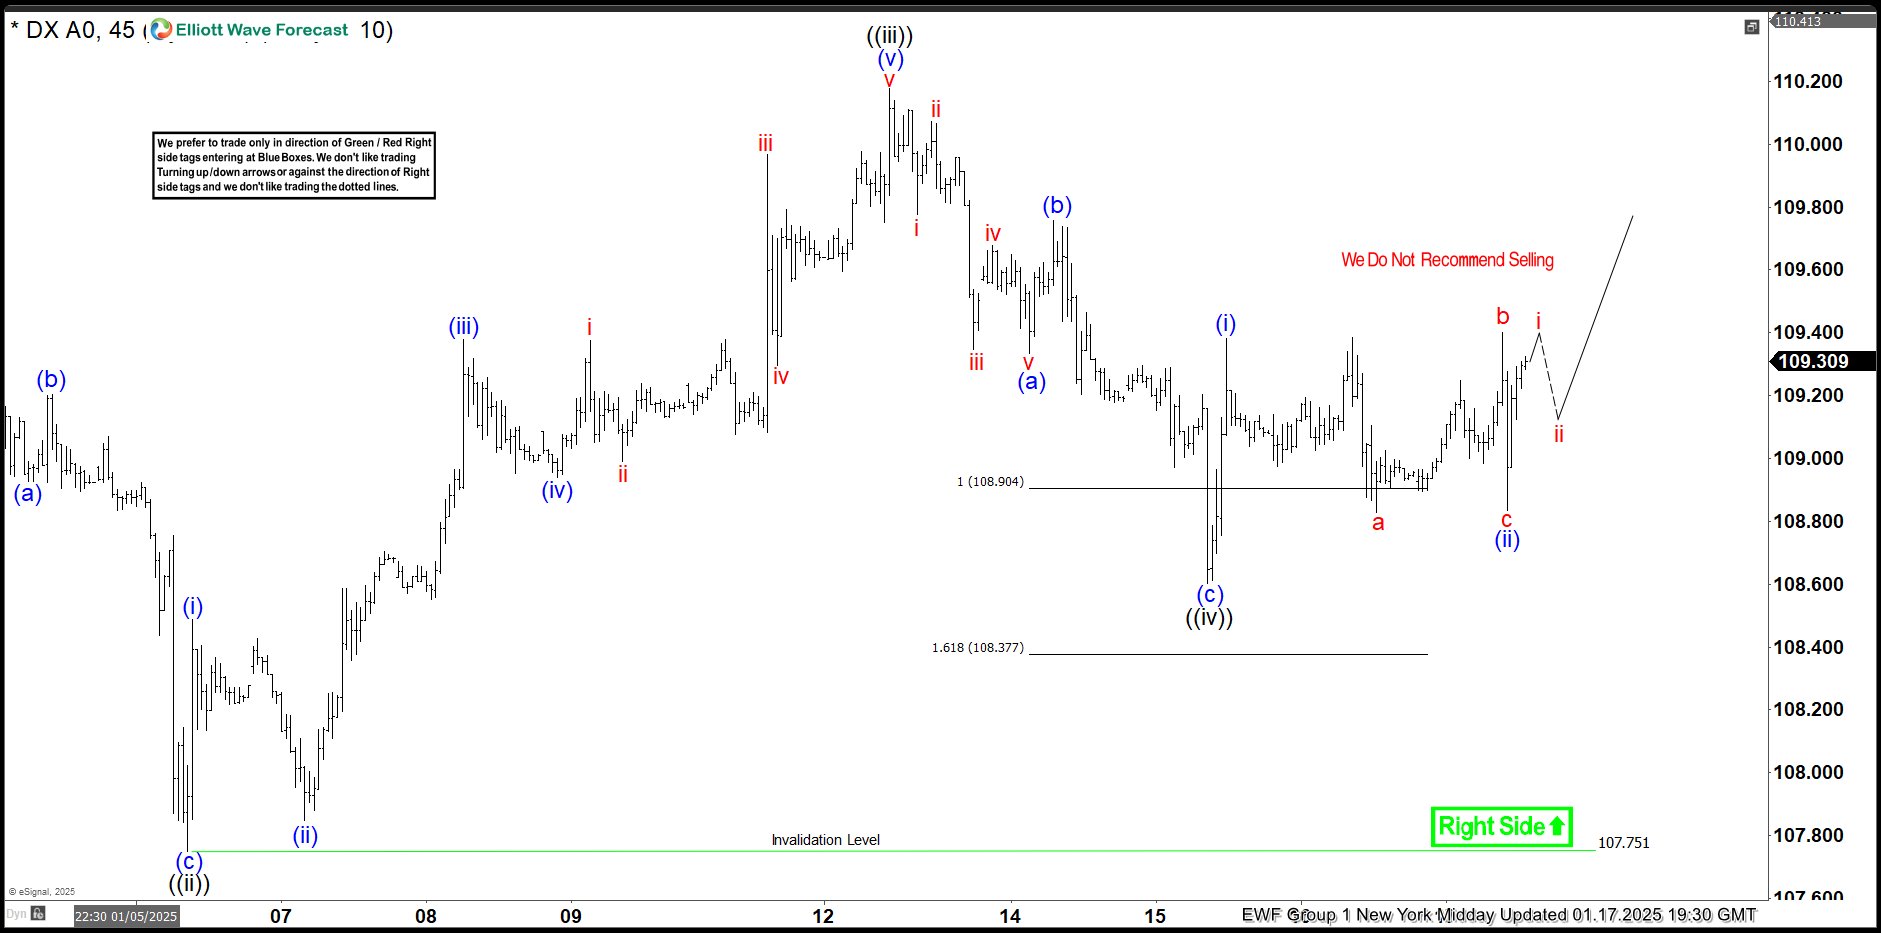
 DXY H1 London Update 01.17.2025
The US Dollar extended lower towards the buying area as expected. Price reached the extreme zone at 108.900 – 108.373. DXY found buyers and rallied from the Equal Legs zone, completing the pullback at 108.62.
The 108.62 low is key for the view. While above this level, we expect further strength towards new highs. A break below it would prolong the correction.
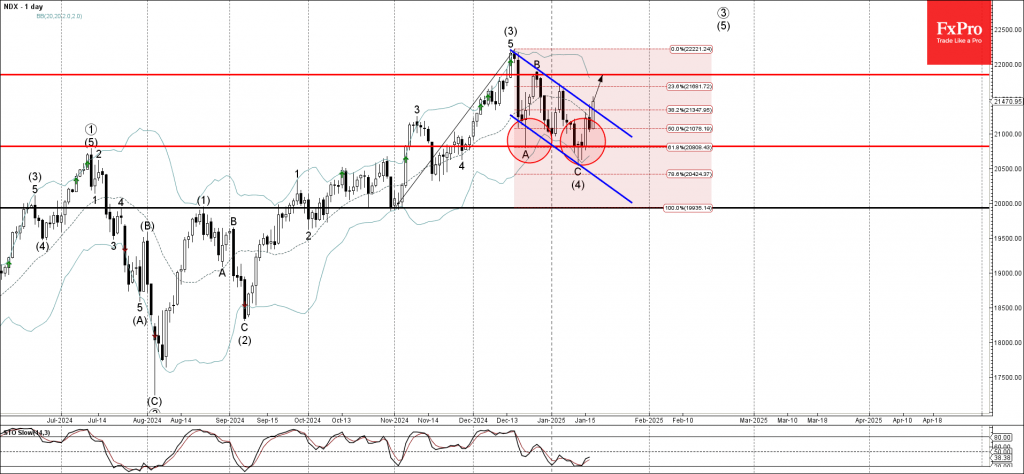
Nasdaq-100 Wave Analysis
- Nasdaq-100 broke daily down channel
- Likely to rise to resistance level 21850.00
Nasdaq-100 index rising inside the intermediate impulse wave (5), which started earlier from the support zone located between the key support level 20820.00 (former low of wave A from December) and the support trendline of the daily down channel from December (which encloses earlier ABC wave (4)).
The index just broke the aforementioned down channel which should accelerate the active impulse wave (5).
Given the strong daily uptrend, Nasdaq-100 index can be expected to rise to the next resistance level 21850.00, top of the previous B-wave.
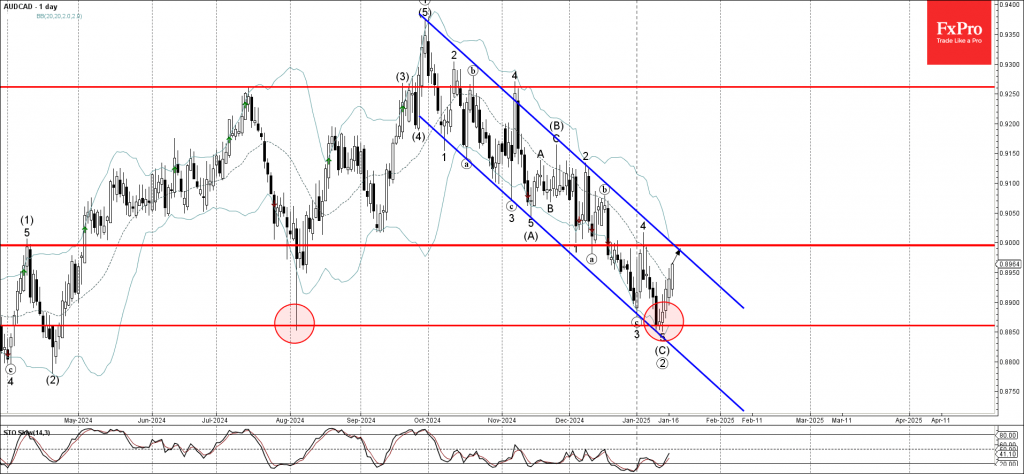
AUDCAD Wave Analysis
- AUDCAD reversed from support zone
- Likely to rise to resistance level 0.9000
AUDCAD currency pair continues to rise inside the minor impulse wave 1, which started earlier from the support zone located between the key support level 0.8860 (former multi month low from April) and the lower daily Bollinger Band.
The active impulse wave 1 belongs to the higher order impulse waves (1) and 1, which started from the same support area.
AUDCAD currency pair can be expected to rise to the next resistance level 0.9000, former strong support from December coinciding with the daily down channel from September.
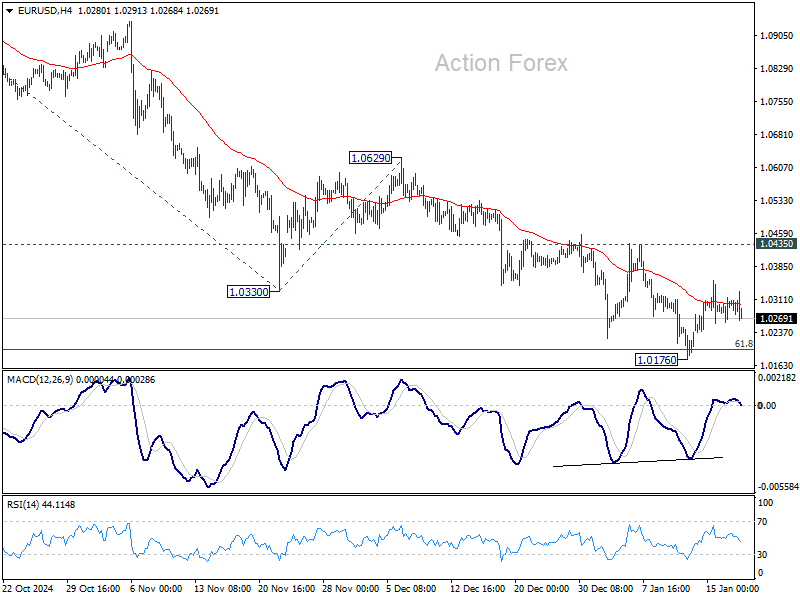
EUR/USD Weekly Outlook
EUR/USD edged lower to 1.0176 last week but recovered after breaching 1.0199 fibonacci level briefly. Initial bias stays neutral this week first and more consolidations could be seen. But outlook will remain bearish as long as 1.0439 resistance holds. On the downside, break of 1.0176 will resume the fall from 1.1213 and target 61.8% projection of 1.1213 to 1.0330 from 1.0629 at 1.0083. However, firm break of 1.0435 will confirm short term bottoming, and turn bias back to the upside for stronger rebound.
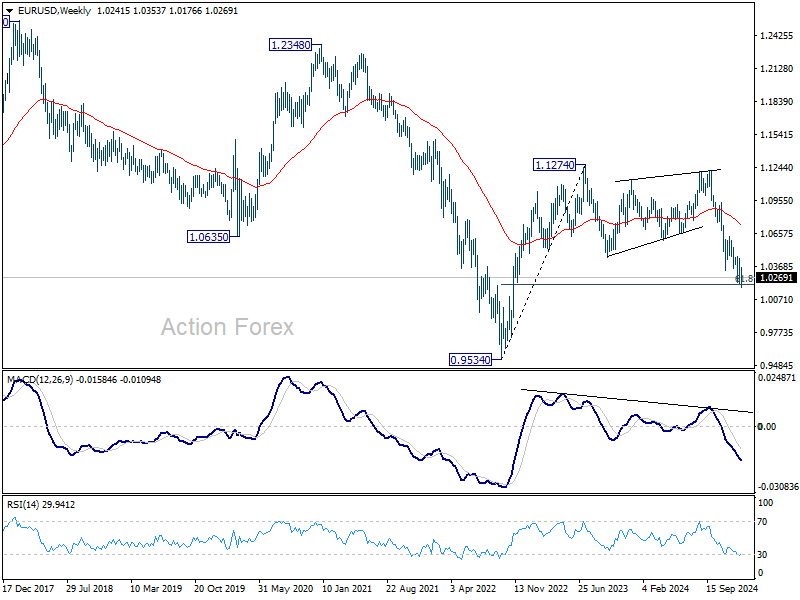
In the bigger picture, fall from 1.1274 (2023 high) should either be the second leg of the corrective pattern from 0.9534 (2022 low), or another down leg of the long term down trend. In both cases, sustained break of 61.8 retracement of 0.9534 to 1.1274 at 1.0199 will pave the way back to 0.9534. For now, outlook will stay bearish as long as 1.0629 resistance holds, even in case of strong rebound.
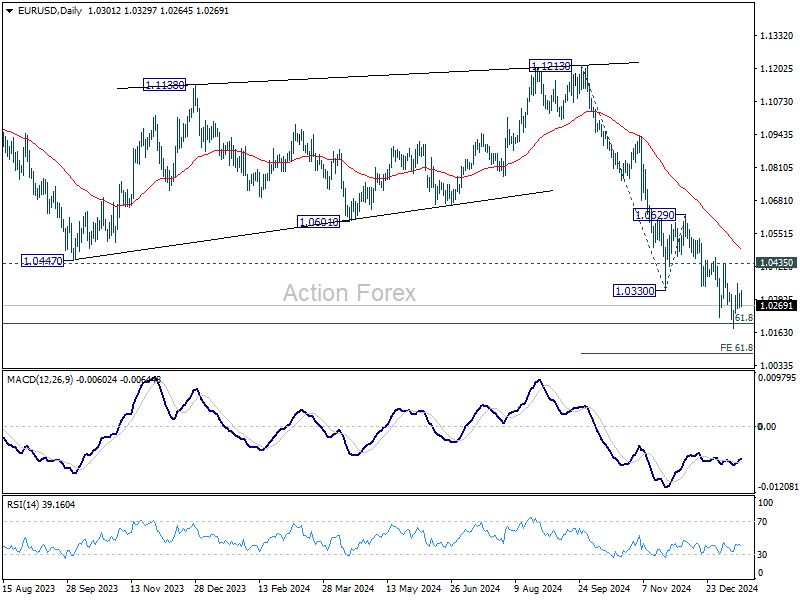
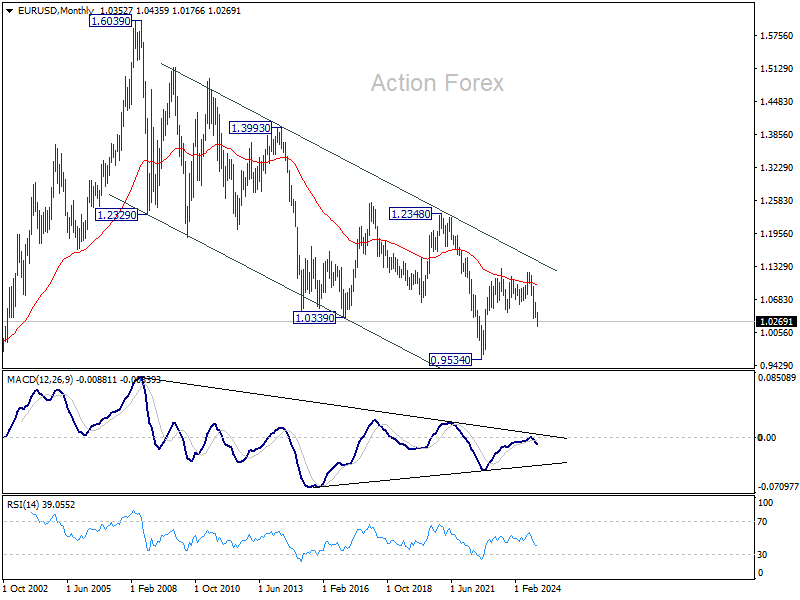
In the long term picture, down trend from 1.6039 remains in force with EUR/USD staying well inside falling channel, and upside of rebound capped by 55 M EMA (now at 1.0973). Consolidation from 0.9534 could extend further and another rising leg might be seem. But as long as 1.1274 resistance holds, eventual downside breakout would be mildly in favor.
USD/JPY Weekly Outlook
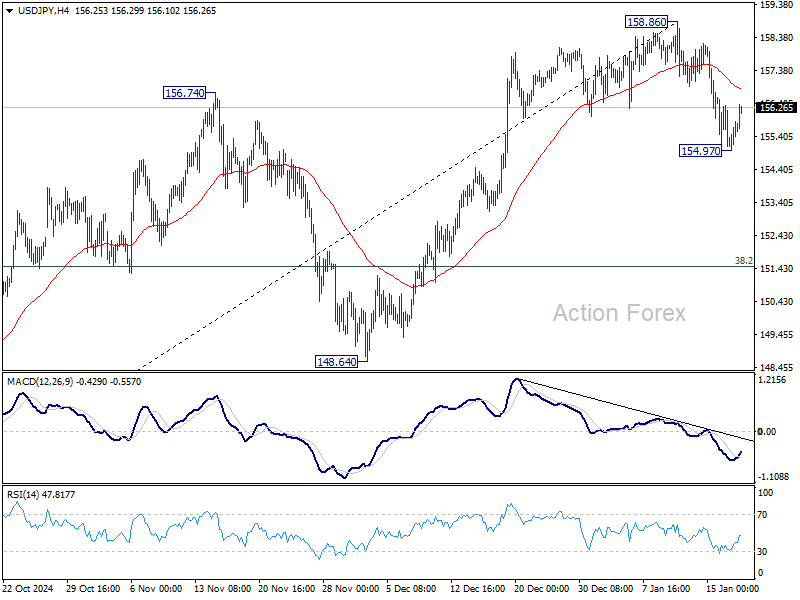
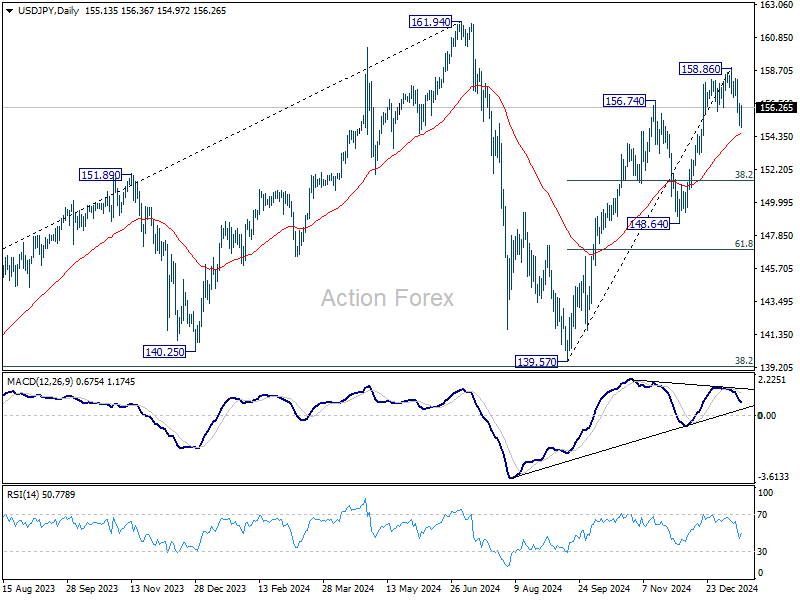
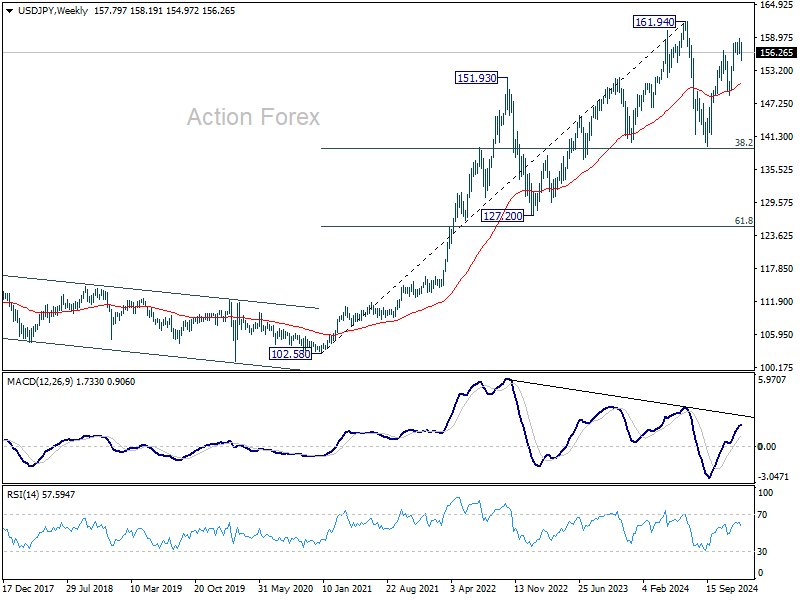
USD/JPY's extended fall last week confirmed short term topping at 158.86. But as a temporary low was formed at 154.97, initial bias is neutral this week first. Risk will stay on the downside as long as 158.86 resistance holds, in case of stronger recovery. Below 154.97 will target 55 D EMA (now at 154.53). Sustained break there will target 38.2% retracement of 139.57 to 158.86 at 151.49 next.
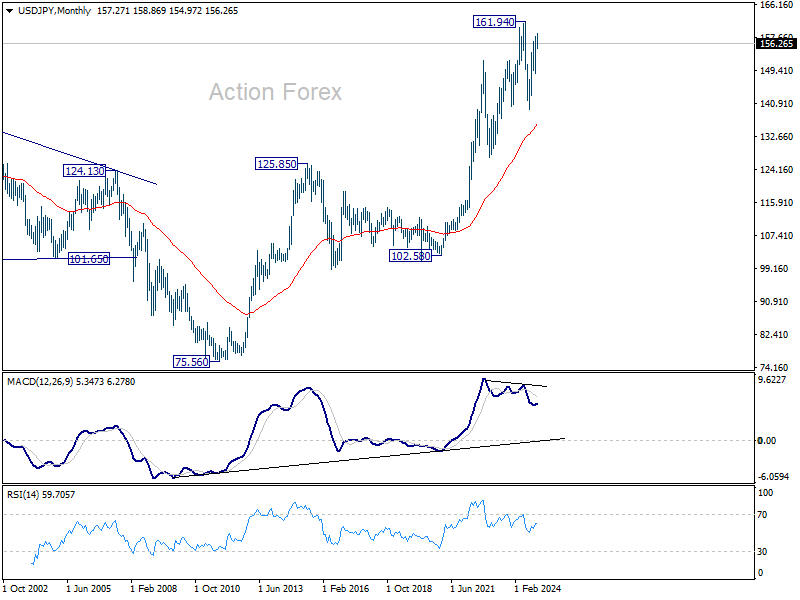
In the bigger picture, price actions from 161.94 are seen as a corrective pattern to rise from 102.58 (2021 low). The range of medium term consolidation should be set between 38.2% retracement of 102.58 to 161.94 at 139.26 and 161.94. Nevertheless, sustained break of 139.26 would open up deeper medium term decline to 61.8% retracement at 125.25.
In the long term picture, it's still early to conclude that up trend from 75.56 (2011 low) has completed. A medium term corrective phase should have commenced, with risk of deep correction towards 55 M EMA (now at 136.02).
GBP/USD Weekly Outlook
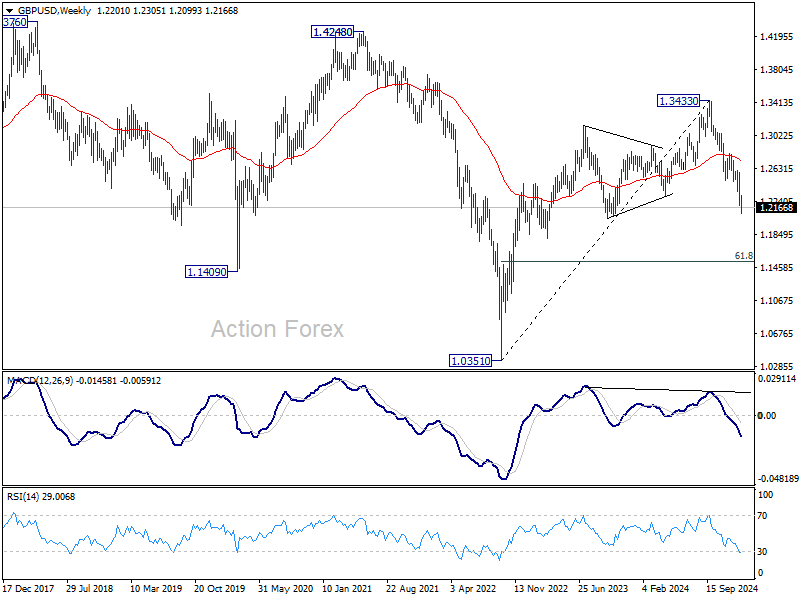
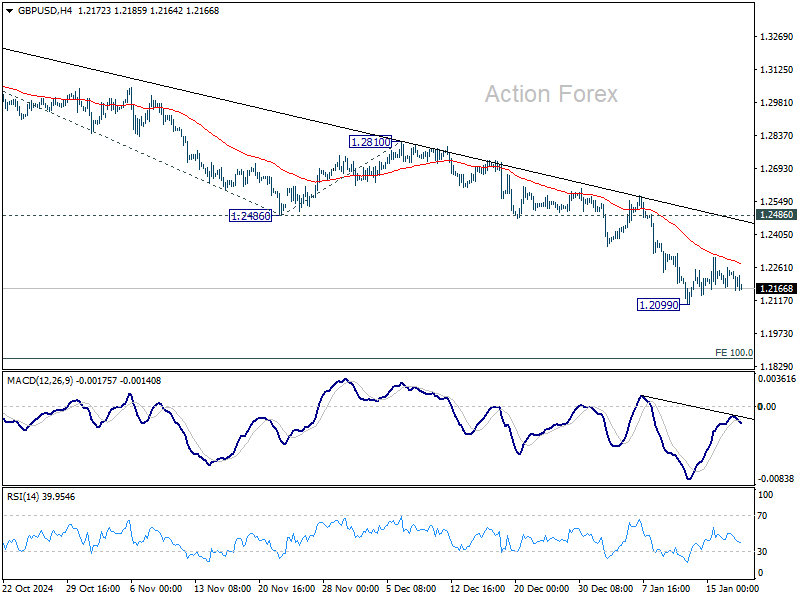
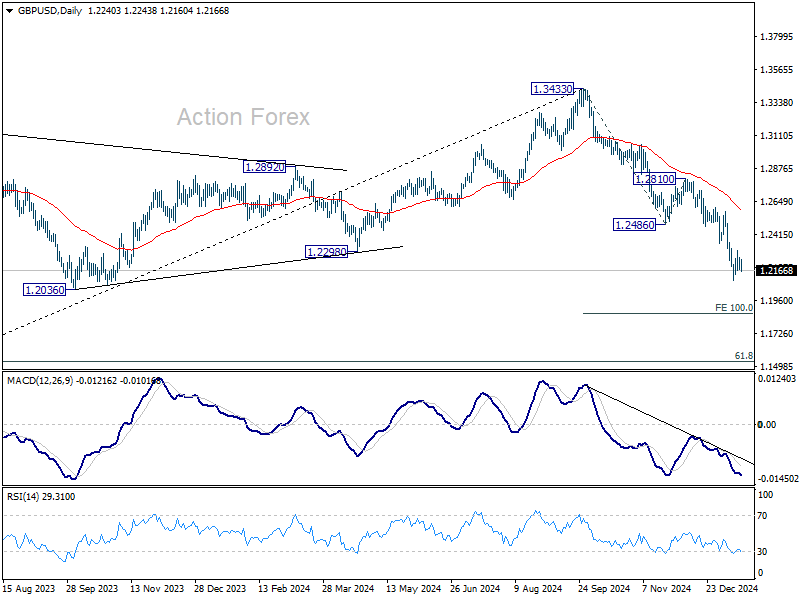
GBP/USD dipped to 1.2099 last week but recovered since then. Initial bias remains neutral this week for consolidations. While stronger recovery cannot be ruled out, outlook will remain bearish as long as 1.2486 support turned resistance holds. On the downside, break of 1.2099 will resume the fall from 1.3433 to 100% projection of 1.3433 to 1.2486 from 1.2810 at 1.1863.
In the bigger picture, rise from 1.0351 (2022 low) should have already completed at 1.3433, and the trend has reversed. Further fall is now expected as long as 1.2810 resistance holds. Deeper decline should be seen to 61.8% retracement of 1.0351 to 1.3433 at 1.1528, even as a corrective move.
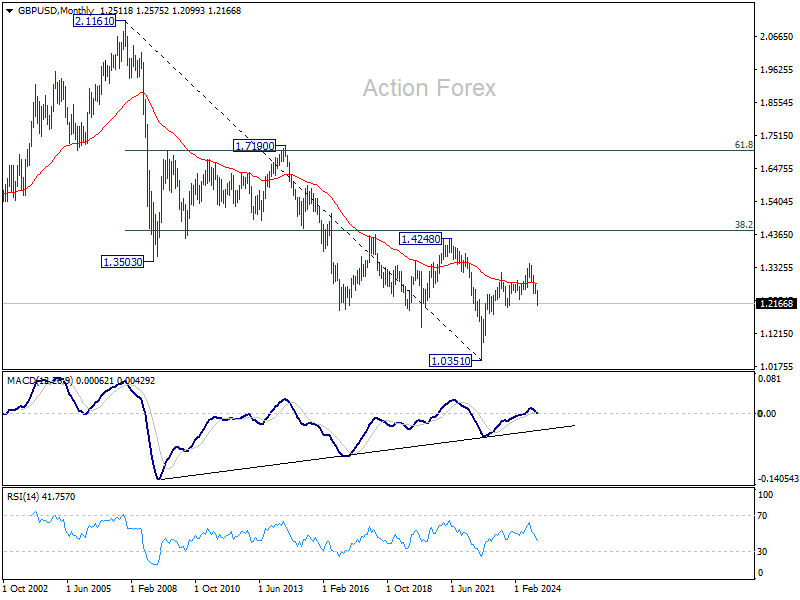
In the long term picture, price actions from 1.0351 (2022 low) are seen as a corrective pattern to the long term down trend from 2.1161 (2007 high) only. Outlook will be neutral at best as long as 1.4248 structural resistance holds, even in case of strong rebound.