
Sample Category Title
FTSE 100 Index May Reach 8500
As shown on the chart of the UK stock index FTSE 100 (UK 100 on FXOpen):
→ It has risen by over 3% in three days;
→ It is near the record high set in May last year and may reach the psychological level of 8500 points.
Bullish sentiment has been supported by yesterday's news of GDP recovery – according to media reports, the economy grew by 0.1% in November 2024 (compared to a previous decline of 0.1%), primarily driven by the dominant services sector.
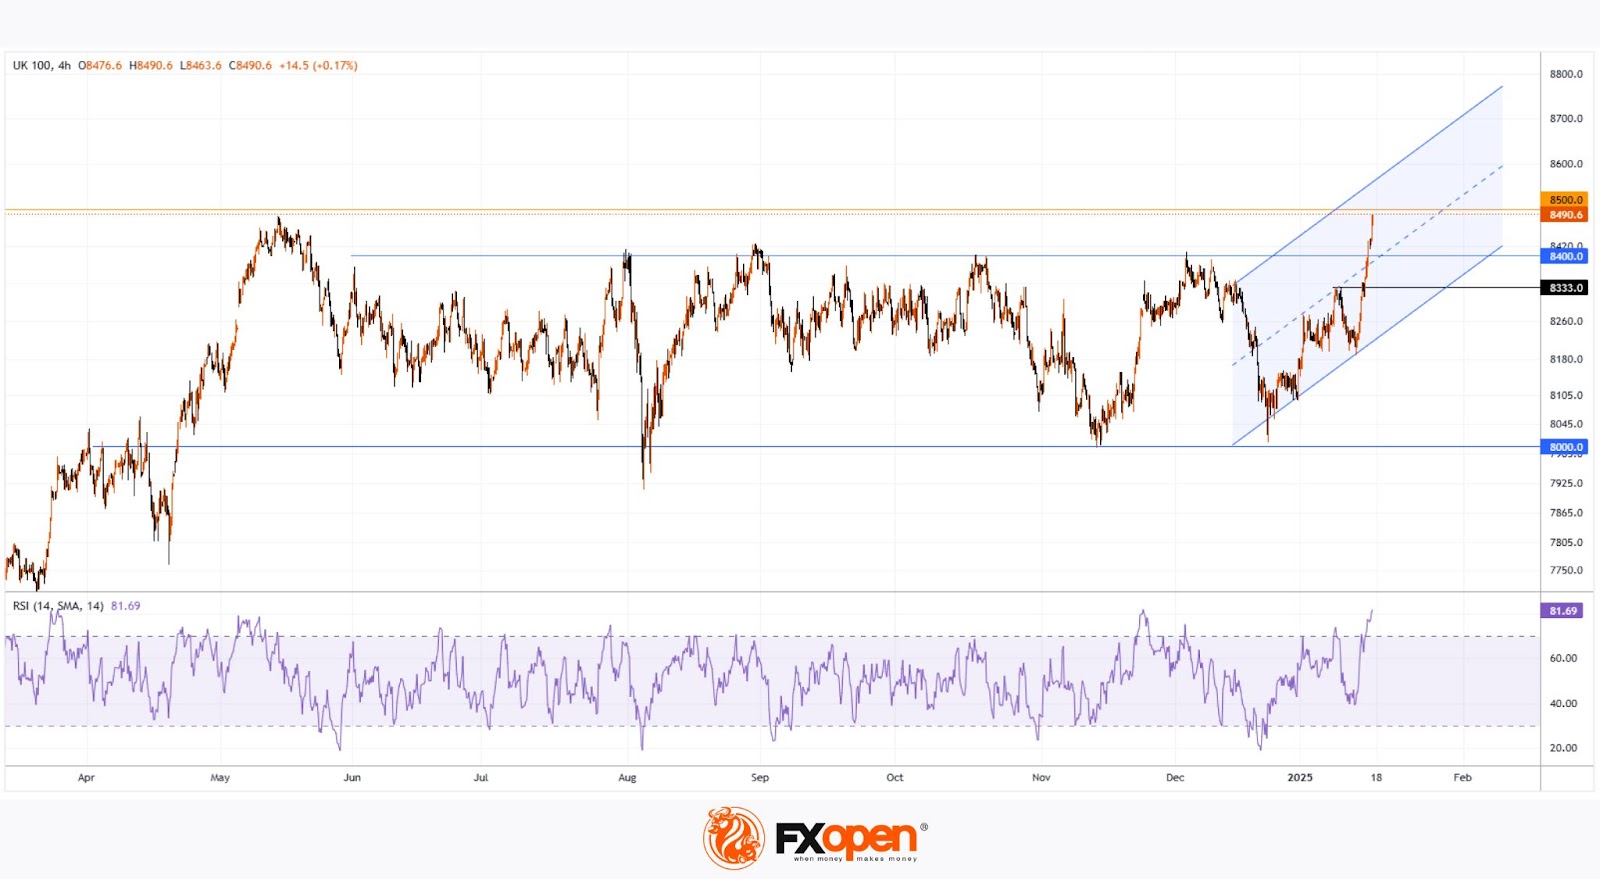
Technical analysis of the FTSE 100 (UK 100 on FXOpen) chart shows that since mid-2024, the index has predominantly fluctuated within the 8000–8400 range, only briefly moving beyond it, which was accompanied by spikes in the RSI indicator.
The current RSI level indicates strong overbought conditions, making the FTSE 100 (UK 100 on FXOpen) vulnerable to a pullback. Should this occur, it will provide important insights into the strength of demand. This could be assessed by the index’s ability to remain above the 8333 support level and the lower boundary of the ascending channel (marked in blue).
Potential challenges for bulls are highlighted by MT Newswires, which report that analysts forecast higher inflation and weaker growth in 2025, amid expectations of a significant rise in labour costs.
Trade global index CFDs with zero commission and tight spreads. Open your FXOpen account now or learn more about trading index CFDs with FXOpen.
This article represents the opinion of the Companies operating under the FXOpen brand only. It is not to be construed as an offer, solicitation, or recommendation with respect to products and services provided by the Companies operating under the FXOpen brand, nor is it to be considered financial advice.
EUR/GBP Daily Outlook
Daily Pivots: (S1) 0.8404; (P) 0.8421; (R1) 0.8435; More...
Intraday bias in EUR/GBP remains neutral first with focus on 0.8446 resistance. Decisive break there will resume the rally from 0.8221 to 0.8624 cluster resistance zone. On the downside, however, break of 0.8403 minor support will indicate rejection by 0.8446, and turn bias back to the downside for 55 D EMA (now at 0.8332).
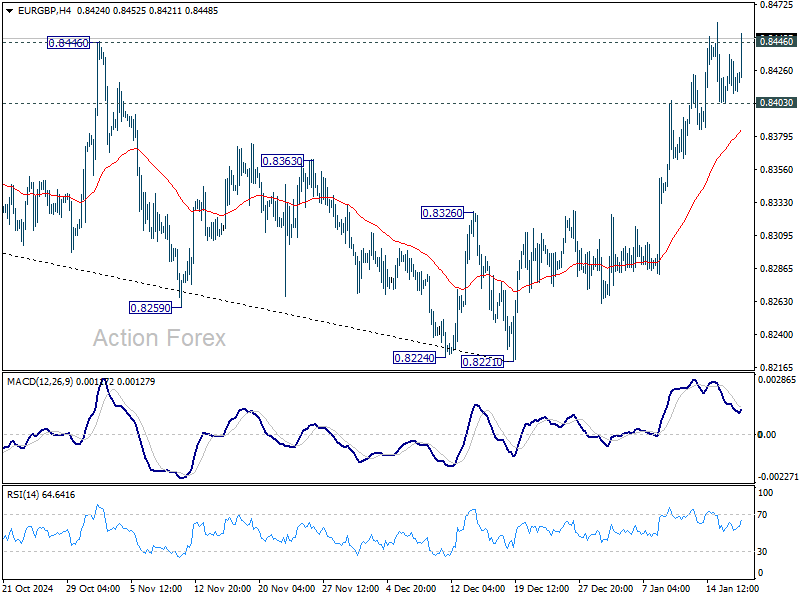
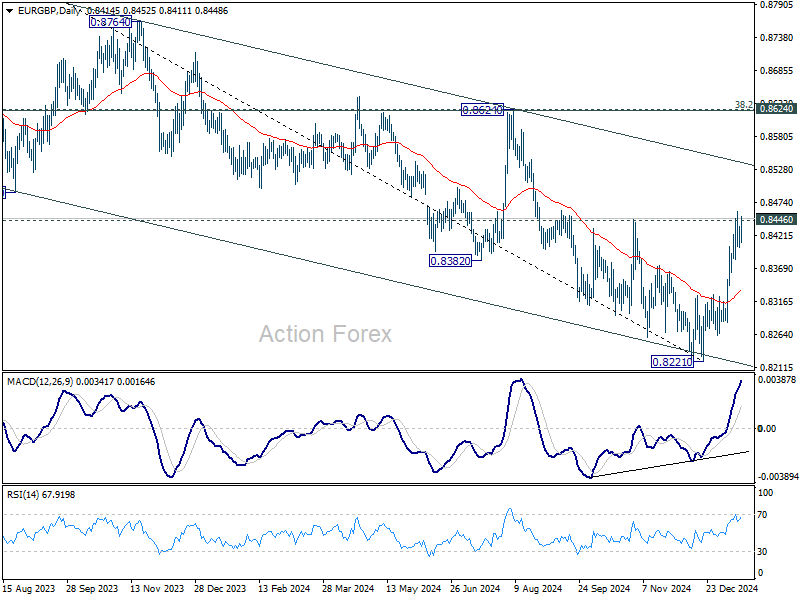
In the bigger picture, considering bullish convergence condition in D MACD, decisive break of 0.8446 resistance and 55 W EMA (now at 0.8446) should confirm medium term bottoming at 0.8221, just ahead of 0.8201 key support (2022 low). Further rally should be seen towards 0.8624 key resistance, even as a correction to the down trend from 0.9267 (2022 high). Overall, however, medium term outlook will be neutral at best until decisive break of 0.8624 cluster zone (38.2% retracement of 0.9267 to 0.8221 at 0.8621). Risk will stay on the downside even in case of strong rebound.
Sterling Remains Pressured as Retail Sales Round Out Weak UK Data Trio
Sterling continues to trade under pressure following a week of disappointing UK economic data, with weak December retail sales completing a trio of negative reports that also included lower-than-expected GDP growth and CPI readings. The data has reinforced market expectations that BoE would ease monetary policy in 2025, as the economy struggles under the new measures of the government's Autumn Budget.
Current interest rate futures are pricing in just two 25bps rate cuts for the year, but a recent Reuters poll (January 10–15) suggests greater dovish sentiment among economists. Of the 63 surveyed, 38 anticipate four rate cuts in 2025, which would bring the Bank Rate down to 3.75%. Immediate action is expected at the February 6 policy meeting, with all 65 participants in the survey forecasting a 25 bps cut.
However, elevated core inflation, which remains stubbornly high at 3.2%, limits BoE's room to signal further easing ahead. This hesitation risks limiting both business confidence and broader economic morale, even on a psychological level.
In Asia, the market reaction to China's 2024 GDP report has been notably subdued. The data showed that China's economy met its official growth target of 5%, despite skepticism from analysts over the credibility of the figure. Yet, stocks in both China and Hong Kong posted only modest gains, reflecting tepid investor sentiment. Australian and New Zealand Dollars remained range-bound, with the latter under particular strain following weak manufacturing data.
In the currency markets, Pound ranks as the week's worst performer for the week so far, trailed by Dollar and Canadian Dollar. The greenback is consolidation recent gains ahead of the inauguration of US President-elect Donald Trump on Monday. In contrast, Yen is the strongest currency, buoyed by increasing speculation of rate hike from BoJ next week. Australian and New Zealand Dollars follow, recovering slightly from earlier losses in the month, while Euro and Swiss Franc are stuck in middle positions.
Technically, NZD/JPY is still struggling to break through 86.71 support despite trying to break through twice. Yet, outlook is staying bearish with clear rejection by 55 D EMA. Fall from 92.45 could be the second leg of the sideway pattern from 83.02, based on current momentum. Firm break of 86.71 will bring deeper decline to 83.02, where strong support is expected to contain downside and bring near term reversal.

UK retail sales fall -0.3% mom in Dec, down -0.8% qoq in Q4
UK retail sales volumes declined by -0.3% mom in December, significantly missing expectations for 0.4% mom increase. The drop was primarily driven by reduced supermarket sales, partially offset by a rebound in non-food stores such as clothing retailers, which saw recovery after recent declines.
On a quarterly basis, sales volumes in Q4 fell -0.8% qoq compared with Q3, highlighting a slowdown in consumer activity. However, year-on-year, Q4 sales volumes rose 1.9% compared to the same period in 2023.
China's Q4 GDP growth surpasses expectations, full-year growth hits 5% target
China’s economy ended 2024 on a strong note, with GDP expanding by 5.4% yoy in Q4, beating market expectations of 5.0%. This marked a significant acceleration from 4.6% in Q3, 4.7% in Q2, and 5.3% in Q1. The robust Q4 performance pushed full-year GDP growth to 5.0%, aligning with the government’s target of “around 5%.”
December's economic indicators also showed positive momentum. Industrial production surged 6.2% yoy, exceeding the forecast of 5.4%. Retail sales grew by 3.7% yoy, marginally beating expectations of 3.5%. However, fixed asset investment lagged, rising only 3.2% year-to-date, just below the 3.3% forecast.
Despite the upbeat data, concerns remain. Statistics Bureau spokesperson Fu Linghui acknowledged lingering weakness in consumer spending and cautioned that in 2025, the “unfavorable impact of external factors may deepen.”
BNZ PMI at 45.9: NZ manufacturing completes 2024 fully in contraction
New Zealand's BNZ Performance of Manufacturing Index rose marginally in December, increasing from 45.2 to 45.9. While this marks a slight improvement, the sector remains in a prolonged contraction, far below the long-term average of 52.5 since the survey's inception. December also marked the 22nd consecutive month of contraction, a record-breaking trend for the PMI.
Catherine Beard, Director of Advocacy at BusinessNZ, noted that 2024 was unprecedented, as it was the first year in the survey’s history with all 12 months in contraction. By comparison, the next closest period was 2008 during the Global Financial Crisis, which saw nine months of contraction.
Breaking down the December data, production dropped further, slipping from 42.3 to 41.9. Employment showed modest improvement, rising from 46.9 to 47.6, while new orders also edged up from 44.5 to 46.5. However, finished stocks fell significantly, declining from 49.2 to 45.9, and deliveries dipped slightly below the neutral 50 mark, moving from 50.0 to 49.8.
EUR/GBP Daily Outlook
Daily Pivots: (S1) 0.8404; (P) 0.8421; (R1) 0.8435; More...
Intraday bias in EUR/GBP remains neutral first with focus on 0.8446 resistance. Decisive break there will resume the rally from 0.8221 to 0.8624 cluster resistance zone. On the downside, however, break of 0.8403 minor support will indicate rejection by 0.8446, and turn bias back to the downside for 55 D EMA (now at 0.8332).
In the bigger picture, considering bullish convergence condition in D MACD, decisive break of 0.8446 resistance and 55 W EMA (now at 0.8446) should confirm medium term bottoming at 0.8221, just ahead of 0.8201 key support (2022 low). Further rally should be seen towards 0.8624 key resistance, even as a correction to the down trend from 0.9267 (2022 high). Overall, however, medium term outlook will be neutral at best until decisive break of 0.8624 cluster zone (38.2% retracement of 0.9267 to 0.8221 at 0.8621). Risk will stay on the downside even in case of strong rebound.
UK retail sales fall -0.3% mom in Dec, down -0.8% qoq in Q4
UK retail sales volumes declined by -0.3% mom in December, significantly missing expectations for 0.4% mom increase. The drop was primarily driven by reduced supermarket sales, partially offset by a rebound in non-food stores such as clothing retailers, which saw recovery after recent declines.
On a quarterly basis, sales volumes in Q4 fell -0.8% qoq compared with Q3, highlighting a slowdown in consumer activity. However, year-on-year, Q4 sales volumes rose 1.9% compared to the same period in 2023.
China’s Q4 GDP growth surpasses expectations, full-year growth hits 5% target
China’s economy ended 2024 on a strong note, with GDP expanding by 5.4% yoy in Q4, beating market expectations of 5.0%. This marked a significant acceleration from 4.6% in Q3, 4.7% in Q2, and 5.3% in Q1. The robust Q4 performance pushed full-year GDP growth to 5.0%, aligning with the government’s target of “around 5%.”
December's economic indicators also showed positive momentum. Industrial production surged 6.2% yoy, exceeding the forecast of 5.4%. Retail sales grew by 3.7% yoy, marginally beating expectations of 3.5%. However, fixed asset investment lagged, rising only 3.2% year-to-date, just below the 3.3% forecast.
Despite the upbeat data, concerns remain. Statistics Bureau spokesperson Fu Linghui acknowledged lingering weakness in consumer spending and cautioned that in 2025, the “unfavorable impact of external factors may deepen.”
BNZ PMI at 45.9: NZ manufacturing completes 2024 fully in contraction
New Zealand's BNZ Performance of Manufacturing Index rose marginally in December, increasing from 45.2 to 45.9. While this marks a slight improvement, the sector remains in a prolonged contraction, far below the long-term average of 52.5 since the survey's inception. December also marked the 22nd consecutive month of contraction, a record-breaking trend for the PMI.
Catherine Beard, Director of Advocacy at BusinessNZ, noted that 2024 was unprecedented, as it was the first year in the survey’s history with all 12 months in contraction. By comparison, the next closest period was 2008 during the Global Financial Crisis, which saw nine months of contraction.
Breaking down the December data, production dropped further, slipping from 42.3 to 41.9. Employment showed modest improvement, rising from 46.9 to 47.6, while new orders also edged up from 44.5 to 46.5. However, finished stocks fell significantly, declining from 49.2 to 45.9, and deliveries dipped slightly below the neutral 50 mark, moving from 50.0 to 49.8.
China Hit Growth Target of “Around 5%” in 2024
Markets
All eyes were on December US retail sales yesterday, but a CNBC interview with Fed governor Waller turned out to be the key market-moving event. The hawk-turned-dove copied tactics of BoE Taylor on Wednesday, by pointing out that the central bank could have more room to lower rates during 2025 than stretched valuations (especially after Friday’s payrolls) suggest(ed). He didn’t go as far as Taylor by putting 125-150 bps on the table, but put rate cuts in the first half of the year on the table if the Fed continued to get inflation data like Wednesday. A January pause is a done deal, but Waller wouldn’t entirely rule out action in March. Following the Fed’s hawkish tilt in December and in anticipation of growth (and inflation) boosting fiscal policies by US president Trump, we still think that March will be out of the equation. Especially given ongoing strength in the US labour market and the economy. That brings us back to yesterday’s retail sales which increased by 0.4% M/M in December on a headline level (after an upwardly revised +0.8% M/M in November) with the control group (used as a proxy for consumption in GDP calculations) even growing by 0.7% M/M. A huge surge in the January Philly Fed business outlook to the 2nd best level since January 1984 is also worth mentioning. Surging new orders, shipments, employment and average workweek all bode well for a further recovery in the manufacturing sector. The US Treasury market ignored the data, but extended the post-CPI repositioning rally. US yields eventually lost 2.4 bps to 5.1 bps with the belly of the curve outperforming the wings. EU swap rates corrected a more modest 1 to 2 bps across the curve. The US dollar switched small intraday gains for losses. EUR/USD closed at 1.0301 up from 1.0289. US stock markets failed to profit with key indices losing 0.2% (Dow and S&P 500) to 0.9% (Nasdaq). European stock indices outperformed gaining up to 2.15% for the (luxury-heavy) French CAC 40. The EuroStoxx 50 gained 1.5% and is now 0.3% away from taking out the 2024 top to the best level since 2000. Today’s eco calendar in uneventful. Markets are counting down to US president-elect Trump’s return to office. A flurry of (executive) orders and policy directives could create quite some nervousness and volatility next week suggesting to err on the side of caution going into the long weekend. US markets are closed on Monday for Martin Luther King Day.
News & Views
China hit its growth target of “around 5%” in 2024 on the mark. GDP expanded 5% last year, exceeding the 4.9% consensus estimate slightly. The quarterly pace picked up from an upwardly revised 1.3% to 1.6% in Q4. Growth was supported by a surge in exports late last year amid companies frontloading potential tariff increases on Chinese goods by the incoming US administration. The accompanying monthly data set also showed retail sales picking up from 3% to 3.7% y/y in December. The resulting 3.8% y/y increase for the whole Q4 was the quickest in 2024. Industrial production accelerated from 5.4% to 6.2% y/y in the final month of the year. China’s property market remains under pressure with home prices again dropping on a monthly basis. But the drop in residential property sales continues to decelerate in December (-17.6% YtD YoY). The data suggest China’s barrage of stimulus over the last couple of months is gradually filtering through. The statistics bureau does warn though that they “must be aware that the adverse effects brought by external environment are increasing, the domestic demands are insufficient, some enterprises have difficulties in production and operation, and the economy is still facing difficulties and challenges.” Both Chinese stocks and the yuan catch a tiny bid this morning. USD/CNY eases to 7.328.
Bulgaria’s parliament yesterday approved the next government coalition, consisting of the Gerb party of former PM Borisov, the pro-Russian BSP and a populist-labeled group called There is Such a People. It’s another minority administration that got a majority backing in parliament with the support of an ethnic Turkish party. Bulgaria has gone through a range of caretaker governments and minority governments over the last couple of years. Seven straight elections failed to produce a ruling majority. The new centre-right PM Zhelyazkov of Gerb sought to ease concerns of taking BSP on board with a spokesperson by stressing that “The Euro-Atlantic agenda is among the main priorities.” The goal after bringing back (political) stability is to join the Eurozone as well as strengthening its fiscal position. Bulgaria fulfilled the last criteria on inflation for euro membership. After the expected positive assessment by the ECB, a date could be set, probably the start of next year.
Bond Relief
Optimism yesterday could’ve been boosted by slower-than-expected US retail sales in December, another set of strong bank and TSM earnings and hawkish comments from the Federal Reserve’s (Fed) Christopher Waller who said that he sees multiple rate cuts in 2025 and a rate cut sooner than market is pricing – if, of course, inflation continues to trend lower, which is his base case scenario. But a quick glance at the inflation metrics in the US confirms the worries that the US inflation is trending lower at a relatively slow speed. The energy and goods inflation is under control, but the core services inflation remains pretty sticky. And Donald Trump’s tariff threats and plans to jolt the energy space with further sanctions against oil-producing countries like Iran, Russia and Venezuela, threaten to maintain the upside pressure in oil prices this year. Although Trump explicitly wants to finish with the war in Ukraine, members of his new team say that they support further sanctions against Russian oil giants. On top, Trump will tighten his grip on Iran against its nuclear work and punish Venezuela for its anti-democratic turn... US crude eased yesterday as hitting the $80pb psychological mark encouraged many traders to realize profit, but crude is better bid this morning on good news from China, this time, and closing the week above the $80pb level could give investors another incentive to stick with their bullish bets – especially if China optimists join the party. Against odds, the Chinese economy improved in the final stretch of the year and managed to hit the 5% target in inflation-adjusted terms. But the country has been in deflation for the second straight year, and retail sales expanded just 3.5% versus a 5.8% advance in industrial production. Industrial production is easier to boost with stimulus measures than consumption, but consumption is the end goal for a healthy growth – and China is not there just yet. Anyhow, the CSI 300 index looks better today than it did for the past two weeks, the yuan is slightly higher against the dollar, but the Chinese 10-year yield remains under pressure.
Speaking of yields, the selling in US and European treasury markets slowed yesterday partly on the back of dovish comments from some central bank members, and partly due to a technical correction after days of dumping. The US 2-year yield slipped below the 50-DMA and the 10-year yield fell to around 4.60%. The British 10-year gilt yield retreated for the second day, letting the British government breath a sigh of relief – especially after yesterday’s GDP data showed that the UK economy hasn’t expanded – at all – under the new Labour government. The think tank of Labour circles accused the Bank of England (BoE) for the slow recovery saying that they’re putting the country’s prosperity ‘at risk for no good reason’ – they must have missed the inflation spiking past the 10% mark in summer 2023... Anyway, Cable managed to recover losses and return to the 1.22 level but the pair is under pressure again this morning. While in Europe, the EURUSD remains offered between the 1.03/1.0350 range as yields retreat from early-week peaks as well, also explained by a global correction across sovereign papers. But the narrative of exploding debt levels at both sides of the Atlantic Ocean, a possible U-turn in inflation trends and political worries remain the major drivers of sentiment, suggesting that the bond selloff may have further room to run and the yields are more likely to settle higher than the post-GFC levels – an expectation that could weigh on risk appetite.
That’s maybe why equity traders’ reaction to softening yields wasn’t unified yesterday. The European equities rallied on the back of softer yields and AI optimism following the TSM results. ASML jumped nearly 5%. But the European stocks were also boosted by a rebound in luxury stocks as the Swiss Richemont jumped nearly 17% to a record high yesterday on double-digit sales growth in Q4 – giving hope that the holiday season may have been prosperous for other luxury names like LVMH and Hermes, as well. LVMH jumped almost 10% to above its 200-DMA and Hermes closed nearly 5% higher, at a record high. But the German stocks saw less enthusiasm – although the DAX index was also pushed to a fresh record as well. In the UK, the FTSE 100 gained more than 1% as energy, mining, bank and real estate stocks advanced on the back of rising energy prices, and more dovish BoE expectations following a softer-than-expected set of inflation and growth data this week. As such, the US traders took over a cheery session but the cheerfulness quickly faded. Despite softer yields and appetizing TSM earnings, the builder of Nvidia and Apple chips remained short of breaking a fresh record in New York yesterday, Nvidia fell nearly 2% - as worries that the new chip curbs could weigh on its activity along with earlier news of delays in chip deliveries and order cuts. Together, the Magnificent 7 stocks retreated nearly 2%, while bank stocks advanced on another set of better-than-expected results from big banks. Morgan Stanley’s profit more than doubled, while Bank of America’s investment banking fees hit the highest in three years. All in all, the US big banks announced a blowout Q4 and deserved their overperformance on the rest of the S&P500 index.
What now? Good news is sparking a positive reaction from investors, with encouraging earnings keeping certain sectors in demand. However, the strongest gains are seen in areas benefiting from lower valuations, such as sovereign bonds and cyclical stocks, rather than high-valuation tech peers. The S&P500’s equal-weighted version recovered more than the normal-weighed index since the January 13 dip, and potential for a further convergence remains the base case scenario – especially if the global rate cut expectations get softer and yields come lower.
Final Euro Area HICP Data to Reveal Inflation Drivers
In focus today
Today, we receive the final euro area HICP data for December, which will reveal in more detail the drivers of inflation. The flash release showed inflation rising to 2.4% y/y with core remaining at 2.7%.
From the US, we get industrial production for December, consensus expects an uptick of +0.3% m/m following November's -0.1% m/m, and past months with negative growth in figure.
Economic and market news
What happened overnight
In China, the economy concluded 2024 on a more positive note than expected, with Q4 GDP growing by 5.4% y/y (cons: 5.0%, prior: 4.6%). The growth was aided by the wave of stimulus measures gaining momentum and robust exports driven by pre-tariffs front-loading by US importers. As a result, GDP for 2024 expanded by 5.0%, aligning with the government's official target. Retail sales increased by 3.7% in December (cons: 3.5%, prior: 3.0%), influenced by Beijing's initiatives to bolster lagging domestic demand.
What happened yesterday
In the US, retail sales for 2024 concluded on a strong note. The retail control group sales showed robust growth at +0.7% m/m s.a. (cons: +0.4%, prior: +0.4), despite headline sales increasing slightly less than expected at +0.4% m/m (cons: +0.6%). This indicates strong economic demand and reinforces the Fed's cautious stance on rate cuts in 2025. In the context of rate cuts, Fed's Waller remarked in an interview with CNBC that "inflation is likely to continue to ease and possibly allow the U.S. central bank to cut interest rates sooner and faster than expected". Waller maintained dovish tones heard earlier and suggested that three or four cuts could be possible in 2025.
Initial jobless claims ticked slightly higher with 14k to a seasonally adjusted 217k (prior: 201k, cons: 210k). though the figure remained consistent with past weeks' typical levels.
In Poland, the key rate was left unchanged at 5.75%. It will be interesting to see if Governor Glapinski maintains his recent hawkish stance at the upcoming press conference, especially after yesterday's core inflation print surprised to the downside. However, a detailed discussion on future policy is more likely at the March meeting.
Equities: Global equities rose yesterday, buoyed by the cyclical sector in Europe, while the US counterparts significantly underperformed despite the release of strong key figures from the US. Europe has outperformed the US by approximately 2% year-to-date. However, what is more intriguing is the noticeable lacklustre appetite for high-valued global, and particularly US, tech growth companies lately. Actually, the tech sector is the second worst performing sector year to date. US tech and growth have been the dominant trades of 2023 and 2024, and one should exercise caution when moving prematurely against such a strong trend. Nevertheless, there are increasing signs of fatigue in this trade, which is particularly interesting to observe. If investors suddenly realise that the premium on US tech growth, or more specifically the MAG 7, is unjustifiably high, there could be significant room for downward adjustment. Remember, the MAG 7 is trading at a 100% premium to the S&P 500 equal weight. The notion that "big is beautiful" has not always held, and just to remind you, 15 years ago, it was the other way around, with the equal weight S&P 500 trading at a 10% premium to the cap-weighted index. In the US yesterday, the Dow fell by 0.2%, the S&P 500 by 0.2%, the Nasdaq by 0.9%, while the Russell 2000 rose by 0.2%. Asian markets are mixed this morning despite some solid Chinese key figures, with Chinese markets among the better performers. European and US futures indicate a higher opening this morning.
FI: Global bond yields declined, and the curves steepened on the back of comments from Federal Reserve's Waller, that the Federal Reserve could cut again in the first half of 2025 if inflation stay well-behaved. Hence, he was striking a very dovish tone compared to comments from other Fed Officials earlier this week.
FX: The drop in global yields continue to drive an overperformance in the JPY with USD/JPY notably setting new lows just north of the 155 area. Despite intraday volatility EUR/USD remains close to the 1.03 level while a slight underperformance in NOK has returned NOK/SEK back close to the 0.98 figure. Finally, EUR/GBP continues to trade just north of 0.84.
The Exchange Rate and the Big Pivot
A depreciating exchange rate sometimes gets interpreted as a ‘vote of no confidence’ in that economy or currency. In fact, it is often a necessary and welcome shock absorber.
Exchange rates are often seen as a judgement. A depreciating exchange rate gets interpreted as a ‘vote of no confidence’ in that economy or currency. People sometimes forget that an exchange rate necessarily involves two currencies. As we have already highlighted, the recent sell-off in the Australian dollar against the US dollar is more about the strength of the US dollar than anything specific to Australia. Likewise, on the days the sell-off has reversed, it has mostly been the result of US news.
We have, of course, seen these periods of ‘American exceptionalism’ – and a weak Australian dollar – before. The period around 2000 is a case in point. Back then, both the exchange rate against the US dollar and the TWI were around the 50 mark – much lower than even current levels. Indeed, the Australian dollar appeared to be undervalued relative to the fundamentals that were thought to drive exchange rate movements normally.
There were several reasons for this apparent undervaluation. The then RBA Governor, Ian Macfarlane, discussed this in a speech at the time. Market participants’ expectations about interest rates played a role then as now. So did bullish expectations about new technologies and their implications for productivity. Australia compared poorly when the focus was on the producers of the new technology, rather than on how it was being adopted by users. We were seen as an ‘old economy’ that dug things out of the ground rather than manufacturing semiconductors as a ‘new economy’ would. Looking at developments in the relative price of iron ore to semiconductors since then, though, being an ‘old economy’ turned out to not be such a terrible thing.
There are some crucial differences between the turn of the century and now, though. Back then, Australia’s productivity performance actually outstripped that of the United States, though many observers seemed to ignore this point at the time. Growth in private sector demand was strong, especially consumption; real household incomes were rising; and the housing market was booming. Perhaps more importantly, the turn of the century was just before the entry of China into the WTO, and the exceptional period of Chinese economic growth that followed. China’s share of Australia’s total trade more than tripled over the following decade.
The Australian dollar responded to these shifts. After hitting a low point soon after 9/11 in 2001, the TWI had by 2005 already appreciated by 25%. While the GFC induced some volatility, before too long, the AUD appreciated above parity with the USD for a time.
These outcomes highlight the floating exchange rate’s role as a shock absorber. ‘Risk off’ events such as 9/11, the GFC and the pandemic lead market participants to sell the AUD. So do longer-run developments that are believed to weigh on Australia’s prospects more than those of peer economies. But that sell-off does not last forever. It can also become a positive: Australian production becomes more price-competitive relative to foreign alternatives, which boosts domestic activity over time. The domestic-currency values and income of Australia’s foreign assets (Australia has net foreign-currency assets) rise, so too the profits of externally-focused Australian firms such as our mining companies. These in turn boost tax revenue for the Australian government.
The Big Pivot ahead
Even with the exchange rate acting as a shock absorber, though, there are times when an economy needs to pivot in the face of shocks and shifting trends.
Back in the 1950s and 1960s, it was said that Australia rode on the sheep’s back. Wool was the top export, with wheat coming in second. In the 1980s and 1990s, coal topped the export rankings, before iron ore took first place this century. Currently, the three next most important exports are coal, LNG and education-related travel services. LNG exports only came to prominence recently, with the volume exported more than doubling since the early 2010s. Meanwhile education exports increased steadily in importance through the 1990s and early 2000s, ramping up further in the mid-2010s to reach more than 8% of total exports. (On a current price basis, it’s now a little below that share.)
The prominence of iron ore is a direct result of the entry of China into the global trading system. China’s demand for steel increased roughly eight-fold as it developed, and without much existing scrap to use in arc furnaces, most of that steel was made in blast furnaces using fresh iron ore. Australia was well-placed to supply the iron ore, less so the steel. This was a good outcome for Australia: starting from just about any date in the past, imported steel prices have increased by less than the price of the iron ore that went into it. This is part of the reason why Australia’s terms of trade – the prices of exports divided by the prices of imports – has averaged a much higher level over the past fifteen years than in prior decades.
That incredible ramp-up is not going to be repeated, however. As we have highlighted previously, China has reached ‘Peak Steel’. Even if additional iron ore supply weren’t coming online in other countries, there is no material upside from here for Australia’s iron ore export volumes.
Coal production, as we have previously noted, is already declining. This is by design: the climate-related energy transition implies that global demand for thermal coal will fade away at some point. Metallurgical coal may have longer to run, but this depends on how long China and other producers stick with blast furnaces.
Like iron ore, LNG exports expanded following a significant increase in Australian supply capacity. That investment has completed and there are no major plans to expand capacity further; most of the currently underway or planned projects fall into the category of ‘sustaining investment’, without which production volumes would fall. While gas is likely to remain part of the energy mix for longer than coal in most countries, existing capacity and investment plans imply little scope to expand Australia’s LNG export volumes much from here.
Education services exports, as we have also learned recently, has its capacity limits, too. While global demand for university education in Australia could increase over time, the resulting population growth runs up against a housing stock that is inherently slow to react, being a stock of mostly already existing homes.
Australia’s top four exports are therefore all more or less capped in volumes terms. There is no crisis here: the run of large trade surpluses Australia recorded in recent years were historically unusual, and partly driven by the effects of the pandemic and Russia’s invasion of Ukraine on iron ore and energy prices. That said, it does mean that future growth in export volumes is mostly going to have to come from somewhere other than the current top four exports.
Australia is going to need to pivot. The good news is that history shows that it can, and the behaviour of the exchange rate will help it navigate that period of change.