
Sample Category Title
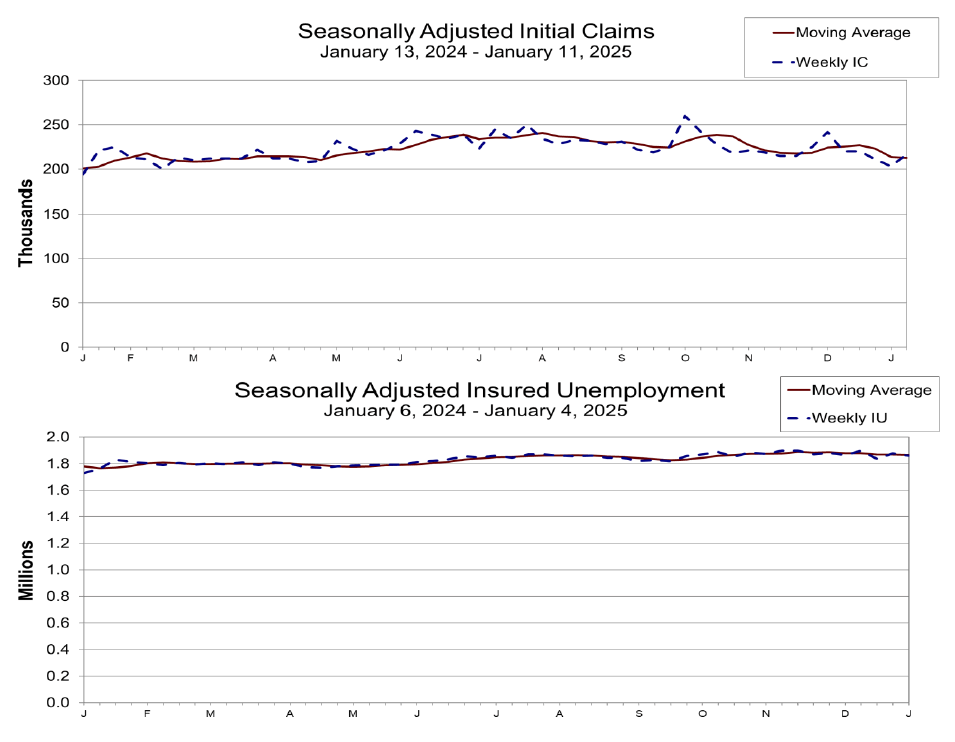
US initial jobless claims falls to 217k vs exp 210k
US initial jobless claims rose 14k to 217k in the week ending January 11, above expectation of 210k. Four-week moving average of initial claims fell -750 to 213k.
Continuing claims fell -18k to 1859k in the week ending January 4. Four-week moving average of continuing claims fell -1k to 1867k.
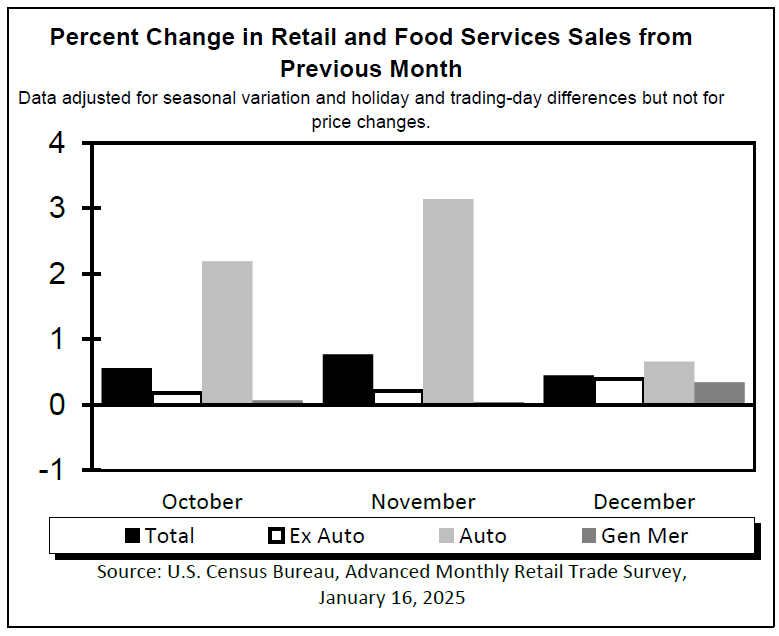
US retail sales rise 0.4% mom in Dec, ex-auto sales up 0.4% mom
US retail sales rose 0.4% mom to USD 729.2B in December, below expectation of 0.5% mom. Ex-auto sales rose 0.4% mom to USD 586.3B, below expectation of 0.5% mom. Ex-gasoline sales rose 0.4% mom to USD 676.8B. Ex-auto & gasoline sales rose 0.4% mom to USD 533.9B.
Total sales for the October through December period were up 3.7% from the same period a year ago.
ECB Minutes: Gradual easing essential to monitor disinflation check points
ECB’s December 11–12 meeting minutes noted that while the 25 bps rate cut decided at the meeting was widely supported, some members argued for a more aggressive 50 bps reduction.
Some policymakers contended that a larger rate cut would have better addressed Eurozone’s weakening economic projections, with one noting that “successive projection exercises have shown increasing downside risks to growth.”
However, the majority concurred that a smaller, measured cut aligned with the “controlled pace of easing” and provided a "sense of the direction" of the path of interest rates.
The minutes emphasize while projections were conditional on a further rate cut in January, the meeting underscored that “data dependency precluded any foregone conclusions.”
The minutes also stated that the “measured pace of interest rate cuts” was essential to ensure that ECB could “pass critical checkpoints to verify disinflation remains on track.” Furthermore, it was highlighted that optionality must be preserved to address risks that could derail inflation stabilization, including geopolitical tensions, global trade disruptions, and energy price volatility.
Nevertheless, "if the baseline projection for inflation is confirmed over the next few months and quarters,” the minutes noted, a “gradual dialing back of policy restrictiveness” would be appropriate.
(ECB) Monetary policy accounts
Account of the monetary policy meeting of the Governing Council of the European Central Bank held in Frankfurt am Main on Wednesday and Thursday, 11-12 December 2024
16 January 2025
1. Review of financial, economic and monetary developments and policy options
Financial market developments
Ms Schnabel noted that, since the Governing Council’s previous monetary policy meeting on 16-17 October 2024, the narrative in financial markets had shifted as a result of rising trade and economic policy uncertainty. Investors had increasingly focused on the divergence in growth prospects between the euro area and the United States. This had manifested itself in a divergence of bond yield and equity price developments between the euro area and the United States, as well as a pronounced weakening of the euro against the US dollar. While the euro area near-term inflation outlook embedded in market pricing had shifted upwards, inflation compensation had declined over longer horizons. This had led investors to expect a frontloading of ECB rate cuts and a lower terminal rate. Owing to these expectations regarding the rate-cutting cycle, combined with the weakening of the euro exchange rate against the US dollar and still benign risk asset price constellations, financial conditions had loosened further.
Two key factors had shaped euro area financial market developments in the inter-meeting period: the US presidential election and the surge in policy uncertainty in the two largest euro area economies. However, so far the rise in macroeconomic uncertainty had not translated into higher financial market volatility. On the contrary, market volatility had decreased since the Governing Council’s previous monetary policy meeting. But even in an environment of generally benign financial market conditions, higher economic and political uncertainty could have implications for economic sentiment, with knock-on effects on asset prices. A case in point was the weak euro area Purchasing Managers’ Index (PMI) in November 2024. Initially, after the Governing Council’s October monetary policy meeting, macroeconomic data had surprised consistently to the upside, both in the United States and in the euro area. However, the November euro area PMI – produced after the US presidential election in November – had disappointed, pulling the Citigroup Economic Surprise Index back into negative territory. Meanwhile, the equivalent index for the United States had remained firmly in positive territory.
Rising uncertainty and diverging macroeconomic data had been reflected in a sharp divergence in monetary policy expectations. In the euro area, the overnight index swap (OIS) forward curve had shifted lower compared with the expectations prevailing at the time of the Governing Council’s previous monetary policy meeting. Markets currently expected a further frontloading of rate cuts and the expected terminal rate had moved lower, to 1.66%, compared with 1.84% at the time of the October meeting. Participants in the December round of the ECB Survey of Monetary Analysts (SMA) also anticipated that rate cuts would be brought forward, but they had not lowered their expectations for the terminal rate relative to the October round of the survey.
In contrast, the US fed funds futures curve had moved in the opposite direction, as investors had scaled back expectations of further rate cuts by the Federal Reserve System. Whereas for most of 2024 global investors had been expecting a broadly synchronised easing cycle across economies, the picture had changed markedly, bringing the differential between the expected terminal rates of the ECB and the Federal Reserve System to almost 200 basis points.
The divergence in risk-free rates between the euro area and the United States was visible across maturities. A breakdown of euro area and US OIS rates into changes in inflation compensation and real rates showed that the main driver had been a divergence in real rates.
The perception of heightened downside risks to economic growth had not exerted downward pressure on near-term inflation expectations as reflected in inflation fixings (swap contracts linked to specific monthly releases in euro area year-on-year HICP inflation excluding tobacco). The latest inflation fixings had shifted upwards significantly, reversing part of the previous decline, and were currently close to 2% – converging with the inflation trajectory implicit in the December Eurosystem staff projections. Over the longer term, five-year forward inflation compensation five years ahead had continued its decline and currently stood at 2%. According to evidence from option prices, the risks to inflation were broadly balanced.
Turning to foreign exchange market developments, the main driver of the EUR/USD exchange rate had been the sharp divergence in interest rates. The reappraisal of expectations regarding the ECB’s monetary policy had led to lower risk-free OIS rates, which in turn had been transmitted to euro area sovereign bond markets. Sovereign bond yields had declined across euro area jurisdictions since the Governing Council’s October meeting. At the same time several euro area sovereigns had seen increased spreads between their bond yields and OIS rates. This mainly reflected the reduced scarcity of sovereign bonds, driven by the reduction of the Eurosystem’s monetary policy bond holdings as well as prospects of increased net issuance.
The structural factors influencing asset swap spreads had also recently shaped dynamics in the repo market. As the Eurosystem balance sheet was being reduced and excess liquidity was declining, the repo market was shifting towards a regime of collateral abundance: a trend expected to persist into 2025. Rising collateral availability had contributed to the convergence of repo rates toward the deposit facility rate (DFR) across jurisdictions.
Market perceptions of diverging growth trajectories had also been reflected in equity markets. While US stocks had rallied to new historical highs, euro area equity prices had temporarily dropped back to near early 2024 levels before gradually recovering from early December onwards. The better performance of US equity markets had been driven, in particular, by those sectors expected to benefit most from the incoming US Administration. Higher risk premia in the euro area, coupled with a further fall in risk premia in the United States, had contributed to a historically large valuation gap between the US and euro area equity markets.
Recent financial market developments had had implications for overall financial conditions. Taking a longer-term perspective, financial conditions had eased significantly since the Governing Council’s last interest rate hike in September 2023 and currently stood close to the accommodative levels seen in early 2019. In particular, euro area real risk-free interest rates had declined further markedly across all maturities. Overall, recent developments had accelerated the easing of euro area financial conditions, while inflation expectations had firmed up around the ECB’s inflation target of 2%.
The global environment and economic and monetary developments in the euro area
Starting with inflation in the euro area, Mr Lane recalled that headline inflation had been 2.3% in November according to Eurostat’s flash estimate, 0.3 percentage points higher than in October. The increase had been expected and primarily reflected developments in energy inflation, which had moved up from -4.6% in October to -1.9% in November, owing mainly to base effects. Food inflation had edged down to 2.8% in November, from 2.9% in October. Core inflation (excluding energy and food) had been unchanged at 2.7%.
Indicators of underlying inflation ranged between 2% and 2.8% when excluding the measure of domestic inflation. The indicators of underlying inflation with the highest predictive power for headline inflation were suggesting a sustained return of inflation to target. In particular, the Persistent and Common Component of Inflation (PCCI) remained at around 2.0%. The domestic inflation indicator, which closely tracked services inflation, had again eased somewhat. But at 4.2% in October, it had remained high, reflecting strong wage pressures and the fact that prices of some services had still been adjusting to the past inflation surge.
At the same time the incoming information pointed to a moderation in services inflation dynamics, which should support an easing of domestic inflation. The three-month-on-three-month seasonally adjusted services inflation rate had fallen to 2.6% in November, from 3.4% in October, indicating a further softening in momentum. Meanwhile, the sizeable gap between services inflation and its medium-term underlying trend – captured by the PCCI for services, which stood at 2.5% – suggested there should be further downward adjustment in services inflation in the coming months. The gap suggested that idiosyncratic and non-persistent factors were contributing to the current high level of services inflation. The last step towards achieving the inflation target would be a moderation in services inflation, which was projected to decrease noticeably in the first half of 2025.
The incoming wage data broadly confirmed the previous assessment of elevated but easing wage pressures. The growth rate of compensation per employee had moderated to 4.4% in the third quarter from 4.7% in the second quarter, 0.1 percentage points below the December projection. The growth rate of unit labour costs had eased to 4.3% from 5.2%. Profit margins continued to buffer the impact of elevated labour costs on inflation: annual growth in unit profits had remained negative in the third quarter. Forward-looking wage trackers continued to point to a material easing of wage growth in 2025.
Headline inflation was expected to fluctuate around its current levels in the near term, as previous sharp falls in energy prices continued to drop out of the annual rates. It was then expected to settle sustainably at around the 2% medium-term target in the course of 2025. Easing labour cost pressures and the ongoing impact on consumer prices of the ECB’s past monetary policy tightening should help this process.
According to the latest Eurosystem staff projections, headline inflation was expected to average 2.4% in 2024, 2.1% in 2025 and 1.9% in 2026. It was then projected to increase to 2.1% in 2027 as a result of the expansion of the EU Emissions Trading System (ETS). The projections continued to foresee a rapid decline in core inflation, from 2.9% in 2024 to 2.3% in 2025 and then 1.9% in 2026 and 2027. Compared with the September round, the projections had been revised down by 0.1 percentage points for headline inflation in 2024 and 2025, and by the same amount for core inflation in 2026. The latest inflation expectations from the ECB’s Survey of Monetary Analysts (SMA) were broadly in line with the December staff projections for headline inflation. Market-based indicators of inflation compensation were also consistent with a timely return of inflation to target, while also showing a marked reduction in inflation risk premia for medium and longer-term maturities. This could suggest that markets had revised down the risk of future adverse supply shocks and revised up the risk of future adverse demand shocks.
Turning to the global environment, global growth momentum remained strong but was vulnerable to trade policy uncertainty. The global composite PMI excluding the euro area had increased further in November, to 53.2 from 52.8 in October, owing to improvements in both the services and the manufacturing sector. Anticipation of higher tariffs could support goods trade in the near term by leading to a further frontloading of imports, but implementation of such policies would ultimately weigh on trade. In the December Eurosystem staff projections global real GDP was expected to grow by 3.4% in 2024 and 3.5% in 2025, slowing to 3.3% in 2026 and 3.2% in 2027, with the outlook being largely unchanged from the September ECB staff projections.
Since the October Governing Council meeting, the euro had depreciated by 1.2% in nominal effective terms and by 3.0% against the US dollar. Oil prices had seen considerable volatility, with the forward curve fluctuating. But overall the curve was lower than that embedded in the ECB staff September projections and displayed a slightly negative profile over the coming years. Gas prices had increased quite substantially, although these had been very low at the start of the year and remained well below the peaks of 2022. Furthermore, the gas futures curve was downward sloping – partly due to expanded global supply capacity only becoming available in the future, rather than immediately. Food commodity prices had also been quite volatile, increasing by approximately 40% since the start of the year.
The euro area economy had grown by 0.4% in the third quarter, exceeding the September ECB staff projection. Excluding Irish data, the economy had grown by 0.3%. Growth had been driven mainly by an increase in consumption, partly reflecting one-off factors that had boosted tourism over the summer, and by firms building up inventories. These factors had outweighed a negative net contribution from trade. Overall, private domestic demand had remained subdued, as investment had contracted when excluding the contribution of the Irish data to the euro area aggregate. On the production side, growth had been driven by services. The interest-sensitive manufacturing sector had continued to contract, owing to competitiveness losses, still-high energy prices in relative terms, rising uncertainty, high regulatory costs and the lagged effects of previous monetary policy tightening.
The incoming information suggested a slowdown in the near term. The euro area composite output PMI had declined from 50.0 in October to 48.3 in November. The deterioration in the PMI continued to be broad-based across countries and sub-indices. The manufacturing PMI output index had fallen to 45.1 in November from 45.8 in October. The forward-looking PMI for new manufacturing orders had also fallen, pointing to a weak short-term outlook for industry. The PMI for services activity had fallen into contractionary territory for the first time since January, declining to 49.5 in November from 51.6 in October. Business and consumer confidence remained subdued in an environment of high uncertainty, which was leading to strong household savings and to firms holding back investment. Monthly indicators suggested a deceleration in private consumption growth and a continued contraction in both housing and business investment. The export sector also appeared to have weakened further.
The labour market remained resilient. Employment had grown by 0.2% in the third quarter, again surprising to the upside, and the unemployment rate had remained at its historical low of 6.3% in October. However, the demand for labour continued to soften. The job vacancy rate had declined to 2.5% in the third quarter, 0.8 percentage points below its peak, and surveys also pointed to fewer jobs being created in the fourth quarter.
Regarding fiscal policies, there had already been a significant correction in the euro area budget balance after the pandemic. The further reduction of national deficits, as foreseen in the projections, reflected countries’ fiscal and structural plans under the reformed EU economic governance framework. These plans needed to actually be delivered.
Looking ahead, conditions were in place for growth to strengthen over the projection horizon. According to the staff assessment, while structural factors had weighed on the euro area economy and especially the manufacturing sector, the weak productivity growth since 2022 also included a significant cyclical component. This component had largely been driven by the past tightening of monetary policy and weak external demand. Domestic demand should benefit from rising real wages, the gradual fading of the effects of restrictive monetary policy, and the ongoing recovery in the global economy. Although fiscal policies were set to remain on a consolidation path overall, Next Generation EU funds would still support investment in the next two years. On the external side, euro area export growth was expected to benefit from strengthening foreign demand. At the same time trade uncertainty had increased materially, and the effects of a potential increase in tariffs on the euro area economy would depend on the extent, timing and magnitude of tariff and non-tariff measures, as well as on the responses of the EU and other jurisdictions.
According to the December Eurosystem staff projections, real GDP growth was expected to average 0.7% in 2024, 1.1% in 2025, 1.4% in 2026 and 1.3% in 2027. Compared with the September projections, it had been revised down by 0.1 percentage points for 2024, 0.2 percentage points for 2025 and 0.1 percentage points for 2026. The latest SMA indicated a lower growth profile than the staff projections for 2025, 2026 and 2027.
Market interest rates in the euro area had declined further since the Governing Council’s October meeting, reflecting the perceived worsening of the economic outlook. Regarding monetary and financial analysis, a degree of normalisation had been observed in monetary dynamics. The annual growth rate of M3 had risen to 3.4% in October, up from 2.9% in August. Growth in the narrow monetary aggregate M1 had also continued to recover and its annual growth rate had turned positive for the first time since December 2022, standing at 0.2% in October. So far, the current monetary dynamics had to a large extent been driven by sizeable net monetary inflows from the rest of the world.
The ECB’s past interest rate cuts were gradually making it less expensive for firms and households to borrow. The average interest rate on new loans to firms had been 4.7% in October, more than half a percentage point below its peak a year earlier. The cost to firms of issuing market-based debt had fallen by more than a percentage point since its peak. The average rate on new mortgages had also come down, to 3.6% in October, around half a percentage point below its peak in 2023.
But financing conditions remained restrictive. The cost of new credit for firms was elevated from a historical perspective, particularly in real terms, and the cumulative tightening of credit standards since the beginning of the hiking cycle remained substantial overall. The average rate on the outstanding stock of mortgages was set to rise as fixed-rate loans were repriced at higher levels.
Bank lending to firms had only gradually picked up, from low levels, with the annual rate of increase rising to 1.2% in October. The annual growth rate of debt securities issued by firms, net of redemptions, had stood at 3.1% in October, remaining within the narrow range observed over recent months. Mortgage lending had continued to rise gradually, with an annual growth rate of 0.8% in October.
Monetary policy considerations and policy options
In summary, the incoming information and the latest staff projections indicated that the disinflation process remained well on track. While domestic inflation was still high, it was likely to come down as services inflation dynamics moderated and labour cost pressures eased. Recent cuts in the key ECB interest rates were also gradually being transmitted to funding costs, but financing conditions remained restrictive along the entire transmission chain, from the DFR to the rates that financial intermediaries charged to households and firms. Staff now expected a slower economic recovery than in the September projections, marking another downward adjustment in the growth outlook relative to recent projection rounds. Although growth had picked up in the third quarter of this year, survey indicators suggested it had slowed in the current quarter.
Under the December baseline projections, lower policy rates and a further easing of financing conditions were prerequisites for inflation to stabilise sustainably at the 2% target. Mr Lane therefore proposed that the three key ECB interest rates be lowered by 25 basis points. In particular, a decision to lower the DFR – the rate through which the Governing Council steered the monetary policy stance – was justified by the updated assessment of the inflation outlook, the dynamics of underlying inflation and the strength of monetary policy transmission.
In the current environment of high uncertainty, it was prudent to maintain agility by following a meeting-by-meeting approach and not pre-commit to any particular rate path. In terms of risk management, in the event of upside shocks to the inflation outlook and/or to economic momentum, monetary easing would be able to proceed more slowly than the path embedded in the December projections. Equally, in the event of downside shocks to the inflation outlook and/or to economic momentum, it would be able to proceed more quickly.
While policy was still restrictive and weighing on demand, the disinflation process was sufficiently advanced for the emphasis in communication to be adjusted, from expressing determination to ensure that inflation would “return to the target” to pledging that it should “stabilise sustainably at the target”. This alternative expression better described the Governing Council’s primary task on an ongoing basis. In connection with this, the intention to keep policy rates sufficiently restrictive should be replaced with a more two-sided pledge to adopt the appropriate stance to stabilise inflation sustainably at target. At the same time, Mr Lane proposed preserving continuity in the other key communication elements – including the commitment to a meeting-by-meeting, data-dependent approach to setting rates, supported by the three-pronged reaction function – and refraining from any pre-commitment on the speed and scale of monetary easing at future meetings.
Finally, in line with the Governing Council’s monetary policy strategy, a regular assessment of the links between monetary policy and financial stability had been carried out. It indicated that euro area banks remained resilient and there were few signs of financial market stress or a build-up of financial sector vulnerabilities. Financial stability risks nonetheless remained elevated. Macroprudential policy remained the first line of defence against the build-up of financial vulnerabilities, enhancing resilience and preserving macroprudential space.
2. Governing Council’s discussion and monetary policy decisions
Economic, monetary and financial analyses
As regards the external environment, members took note of the assessment provided by Mr Lane. Global activity had developed better than expected and the December staff projections saw global growth remaining solid overall. Both the United States and China were projected to grow more strongly than in the September projections, although their growth rates were likely to ease slightly over the projection horizon. Euro area foreign demand was seen to have recovered in 2024 and was expected to grow in line with global activity over the rest of the projection horizon. The dominant risk was related to increased fragmentation and to trade protectionism, notably in the United States. This could dampen trade and economic activity while also pushing up consumer prices in the United States – and globally in the event of retaliation. This risk notwithstanding, global activity was likely to have remained robust in the second half of 2024. Resilient trade growth in the third quarter likely reflected frontloading of goods imports amid uncertainty surrounding the trade policies of the incoming US Administration. Container freight rates for shipments from Asia to Europe and the United States had increased over the summer but had fallen back in the autumn. In the United States, economic activity had been strong in the third quarter and was expected to remain strong. Real GDP growth in 2025 had been revised up in the December projections, while uncertainty around the baseline projection had declined. In China, activity had been strengthening, which was supported by developments in consumption. The housing market had been the main weak spot and was likely to remain a drag on growth for the foreseeable future. The euro had depreciated in nominal effective terms since the last Governing Council meeting. And while oil prices had remained broadly stable and metal prices had declined, gas and food commodity prices had increased. There had been a broad-based appreciation of the US dollar after the US elections, as markets had started to factor in fewer rate cuts by the Federal Reserve in 2025. The divergence between the macroeconomic outlook for the euro area and for the United States had weighed on the euro.
Members underlined that geopolitical and economic policy uncertainty had become more pronounced since the last Governing Council meeting, owing to increased uncertainty about US policies on trade, migration and defence, as well as about the future of multilateral cooperation. It was remarked that the inflationary effects of the pre-announced US policies were likely to be bigger in the United States than in the rest of the world. However, it was seen as important to better understand the likely response of China to higher tariffs that would probably be imposed on Chinese products and the extent to which this might cause a diversion of Chinese exports from the United States to the euro area. In the meantime, the uncertainty about US policies had also been compounded by greater policy uncertainty in Europe. France had yet to form a new, stable government, while in Germany a snap election was expected to take place in February. Against this backdrop, members underscored the importance of European institutions – with a new European Commission just being inaugurated – in providing leadership and an anchor of stability.
With regard to economic activity in the euro area, members broadly agreed with the assessment presented by Mr Lane. The economy had grown by 0.4% in the third quarter, exceeding expectations and driven mainly by a stronger than expected increase in consumption – partly reflecting one-off factors that had boosted tourism over the summer – and also by firms building up inventories. But the latest information suggested that activity was losing momentum. Surveys indicated that manufacturing was still contracting and growth in services was slowing. Firms were holding back their investment spending in the face of weak demand and a highly uncertain outlook. Exports were also weak, with some European industries finding it challenging to remain competitive. At the same time, the labour market remained resilient. The economy was seen as likely to strengthen over time, although more slowly than previously expected. The rise in real wages should strengthen household spending. More affordable credit should boost consumption and investment. Provided trade tensions did not escalate, exports should support the recovery as global demand rose.
Broad agreement was expressed with the latest Eurosystem staff macroeconomic projections. However, the point was made that even after the downward revision to GDP growth over the projection horizon, the baseline probably remained too optimistic. It was based on the assumption that the trade policies of Europe’s key trading partners would remain unchanged and stronger foreign demand would support euro area exports. Although it was fully acknowledged that the projections were reasonable in such uncertain times, trade policies in the United States, above all, could play out in an adverse direction. While the effects on euro area growth would be clearly negative, the impact on inflation was rather uncertain. Since trade policy uncertainty had not been directly taken into account in the projection baseline, its negative impact on the outlook was only partly accounted for by using market prices, such as real interest rates, equity prices and the external value of the euro, as conditioning assumptions. Trade policy uncertainty had likely also influenced the forward-looking component of the most recent PMI. Trade policy uncertainty was therefore incorporated at least indirectly and partially in the baseline.
At the same time, it was pointed out that the near-term euro area economic outlook had evolved broadly in line with what had been projected in September, even if significant new challenges and uncertainties had emerged since. While surveys continued to signal lower economic growth, national accounts data for the third quarter had surprised on the upside. In particular, consumption growth had been much stronger than expected and also stronger than embedded in the December projections, in line with the narrative of a consumption-driven recovery. This was further supported by rising confidence in the retail trade sector, as well as higher consumer expectations for major purchases over the next 12 months. Moreover, the resilience of the labour market had once again been surprising, even though there were increasing signs that it was weakening in some countries. There were also first signs of a turnaround in housing markets, with house prices rising in many countries and mortgage demand recovering. Similarly, corporate debt financing was rebounding, to a large extent owing to a pick-up in the issuance of debt securities, encouraged by a decrease in interest rates that had outpaced the decline in rates on bank loans. Moreover, the rise in firms’ inventories might signal an imminent turnaround in the inventory cycle, removing a significant drag on growth. Therefore, there were clear signs that the dialling-back of policy restriction was already starting to be transmitted to financing conditions and to the economy. Furthermore, the significant upward revision of the saving rate in the projections suggested that consumption growth might turn out to be higher than foreseen, as it seemed implausible that the saving rate would remain significantly above its pre-pandemic average on a sustained basis.
The weakest spot, however, remained business investment, which was not yet showing any signs of a turnaround. It was argued that, on balance, the euro area economy remained fragile and that the rebound in GDP growth in the third quarter, following a negative surprise in the second quarter, could be temporary. The summer boost to consumption could be short-lived, as also suggested by weaker retail sales in October. In addition, the industrial sector continued to contract, and the headline composite PMI indicator had fallen below 50 in November. In this context, it was also pointed out that growth had so far been supported by public consumption and public investment, which was not sustainable as the fiscal stance was not expected to be expansionary over the projection horizon. The projections for economic growth had once again been revised down, with a cumulative downward revision to growth over 2025 and 2026 of around 0.3 percentage points compared with the September staff projections. Growth had been revised down despite the lower interest rate path priced in by markets, which suggested that monetary policy was seen as only mitigating the effects of a worsening macroeconomic environment. Some incoming information pointed to weaker private domestic demand.
Against this background it was argued that not much of the consumption-led recovery in the euro area that had been foreseen for some time had materialised so far – apart from the evidence seen in the third quarter. It remained to be seen whether the expected rebound in consumption was merely delayed – partly reflecting lags in the catching-up of real wages – or whether there were other factors at work. Reference was made to analysis for the largest euro area economy which suggested that the persistently higher saving rate was due to a larger contribution from non-labour income, which had been a significant part of household income in the last two years. This source of income was known to have a weak link with consumption, as it was more likely to be saved. Another driver of the high saving rate was high uncertainty. In the coming three years, the saving rate could therefore be expected to decline again, as financial income was likely to account for a smaller portion of overall income. Furthermore, it was also argued that financial conditions should soon cease to produce headwinds for growth. The argument was put forward that the current level of interest rates was in fact comparable to the level in 2006 and 2007, implying that financial conditions should not be restraining aggregate demand to the same extent as in the past. That being said, the ongoing high degree of uncertainty meant that it might take a while for savings to normalise.
In addition, it was highlighted that households were still pessimistic about developments in their real disposable income and more negative about the level of their real disposable income than would be justified on the basis of available data. Such misperceptions might also explain why households continued to save more than before, dampening consumption further. It appeared from survey evidence that the price level, especially for goods purchased frequently, mattered more than the annual inflation rate in households’ inflation perceptions. Looking ahead, consumption might thus continue to be weighed down by low consumer confidence.
Similar caution was expressed by members on the outlook for investment, as the economic recovery was not expected to receive much support from capital accumulation – a demand component especially likely to suffer in an uncertain environment. Overall, the projections indicated a period of relatively low growth which would limit investment in physical and human capital and suppress medium-term growth by dragging down potential output – thereby lowering the economy’s “speed limit” for activity. The share of investment in GDP at the end of the forecast horizon would be 2 percentage points lower than in 2023, despite a strong increase in public investment.
Turning to the labour market, members acknowledged that it had remained resilient so far. The unemployment rate had stayed at a historical low, with continuing but slowing employment growth. Employment growth had outperformed GDP growth in recent years, and its slowdown should not necessarily be interpreted as a weakening of the labour market, but more as a return to the historical relationship between labour market conditions and GDP growth. Structurally the euro area labour market might be stronger than currently assessed and the robust labour market performance in recent years might be consistent with downward revisions of the non-accelerating inflation rate of unemployment (NAIRU), as low unemployment and relatively moderate wage growth continued to coincide. At the same time, labour market flows had been deteriorating, which was typically an early sign of falling job availability. While flows out of employment were fairly stable overall, this measure masked the fact that job quits and lay-offs typically moved in opposite directions over the business cycle.
Questions were raised about the projected increase in labour productivity, which was explained in the projections by higher capacity utilisation in response to higher demand. Some scepticism was expressed about the extent to which low labour productivity was linked to cyclical factors. To the extent that low productivity also reflected the structural challenges faced by the euro area economy, it remained to be seen whether the rebound in productivity growth embedded in the projections would actually materialise. European manufacturing was facing a longer-term deterioration in competitiveness, due to elevated energy costs and other challenges. This once again illustrated the difficulty of distinguishing cyclical from structural factors in real time. While potential output was likely higher in 2024 but potential growth had likely weakened over the longer term, it had to be acknowledged that there was a limit to more substantial reassessments of that variable, as more data were needed which became available only gradually.
However, it was also argued that the economy was mainly lacking demand and was not running at its potential – as suggested by, among other things, a growing current account surplus – with possible new trade barriers likely to make the gap between potential and actual growth even larger. In this context, a remark was made that there was reason to question the rationale for having the economy running at below potential when sustained growth at potential would make it easier to address structural problems. More investment was needed to upgrade the capital stock, and having more people in work was the best way to enable the workforce to be retrained and acquire the skills needed for the new digital economy. An economy running at its potential would also make it much easier to implement structural reforms. While a significant part of the growth challenge was undeniably structural, as had been pointed out in the recent report by Mario Draghi, it should not be ignored that part was cyclical. In a context of declining inflation and a high saving rate, it had to be acknowledged that weak aggregate demand was part of the growth challenge, at least in the short term.
Against this background, members reiterated that fiscal and structural policies should make the economy more productive, competitive and resilient. It was crucial to swiftly follow up – with concrete and ambitious structural policies – on Mario Draghi’s proposals for enhancing European competitiveness and Enrico Letta’s proposals for empowering the Single Market. Members welcomed the European Commission’s assessment of governments’ medium-term plans for fiscal and structural policies, as part of the EU’s revised economic governance framework. Governments should now focus on implementing their commitments under this framework fully and without delay. This would help bring down budget deficits and debt ratios on a sustained basis, while prioritising growth-enhancing reforms and investment.
With respect to fiscal policy, it was argued that the future fiscal stance would likely be looser than currently expected. In the current geopolitical context, it was doubtful whether fiscal plans would be fully implemented, not least because pressure to increase defence spending was mounting. More generally, fiscal policy might remain a lot looser than before the pandemic. At the same time, it was remarked that the euro area fiscal stance was still tighter than that of the United States and that it was unclear whether and to what extent fiscal policy would eventually contribute to economic growth in the euro area.
Against this background, members assessed that the risks to economic growth remained tilted to the downside. The risk of greater friction in global trade could weigh on euro area growth by dampening exports and weakening the global economy. Lower confidence could prevent consumption and investment from recovering as fast as expected. This could be amplified by geopolitical risks, such as Russia’s unjustified war against Ukraine and the tragic conflict in the Middle East, which could disrupt energy supplies and global trade. Growth could also be lower if the lagged effects of monetary policy tightening lasted longer than expected. It could be higher if easier financing conditions and falling inflation allowed domestic consumption and investment to rebound faster.
With regard to price developments, members generally agreed with the assessment presented by Mr Lane in his introduction and concurred that the incoming data had bolstered confidence that inflation would return to target in the course of 2025. Satisfaction was expressed that monetary policy action had been effective in bringing inflation down. Headline inflation was projected to return to 2% in 2025 and was then expected to fluctuate around the target. While it was widely regarded as too early to declare victory, the return to target was within reach. However, it was cautioned that the inflation picture was to some extent flattered by the fact that energy prices had come down by more than expected, and also non-energy industrial goods inflation was much lower than had been expected a couple of months ago. At the same time, higher gas and food prices showed that new shocks could quickly affect the inflation outlook. It was argued that at a time when people remained highly attentive to inflation, it was necessary to pay particular attention to new, potentially inflationary shocks hitting the economy. The projection for 2027 took account of the estimated impact of the expanded EU ETS. If this were not included, inflation would drop below target in 2027, which was seen as surprising and driven mainly by very weak projected energy price inflation in 2027, far below historical averages. Food price inflation was also assumed to be below historical averages in spite of the increased frequency of extreme weather events due to climate change. Therefore, the view was expressed that there were clear upside risks to the 2027 inflation projection.
Moreover, attention was drawn to the prospect of substantial supply and demand shocks on the horizon, which, looking ahead, could make it challenging to keep inflation at the target. It had to be considered that geopolitical risk, economic fragmentation and the ongoing climate and nature crises might create bottlenecks – increasing in frequency, intensity and persistence – in the productive capacity of the economy. Specifically, with respect to potential policy shocks from across the Atlantic, inflation could be pushed significantly higher through the exchange rate channel by an appreciation of the US dollar, especially as the pass-through to prices tended to be more rapid in the wake of high inflation, while retaliation could have a direct inflationary effect on import prices. In addition, bottlenecks might again emerge in global supply chains and, operating through a trade supply shock channel, might outweigh the downward impact on inflation from weaker demand.
Against this background, it was recalled that some parts of the disinflationary path still had to materialise and “the job was not yet done” even though the “last mile” appeared to have shortened somewhat. In particular, domestic inflation had stood at 4.2% in October, driven mainly by high services inflation, standing at 4.0% in October and 3.9% in November. A remark was made that, while the momentum of services inflation was indicating a slowdown, seasonal adjustment might be distorted by shifts in household consumption patterns. Hence, actual momentum could be higher than the statistics showed. Caution was also expressed on the signal from the fall in core inflation, which tended to be volatile. Instead, more weight had to be placed on the ongoing easing of wage pressures. Especially the cooling of the labour market and new information on negotiated wages seemed to confirm the moderation of wage growth. At the same time, lower productivity growth than projected could put upward pressure on unit labour costs and hence inflation. The projections for inflation for 2025 were close to survey results and to the forecasts from Consensus Economics beyond the short term. Market pricing, on the other hand, was incorporating expectations of lower inflation than in the staff projections, possibly reflecting a somewhat more pessimistic view of euro area growth over the medium term. All in all, risks to inflation appeared to have become more two-sided.
At the same time, it was argued that the risks to inflation in the medium term were more to the downside, especially given the higher probability of weaker growth. In this context it was also argued that the expanded ETS was unlikely to have the full projected impact on inflation, as consumers would reallocate their spending towards less polluting sources of energy over time. The point was also made that higher taxation, similarly to tariffs and protectionism, usually gave rise to lower economic activity in the medium term and would ultimately exert downward pressures on inflation.
Regarding services inflation, which was a component that deserved further scrutiny, it was underlined that the month-on-month change in November had been among the largest monthly drops in services prices since the pandemic. Services inflation momentum had been declining significantly, especially in the wage-sensitive components, while in the non-wage sensitive components there were some idiosyncratic elements which would disappear. However, a number of services were due to be repriced at the turn of the year, so new surprises should not be excluded. Given that most of the price changes that were still having an impact on current inflation had happened in the first half of the year, the first months of next year would reveal important information about inflation during the remainder of 2025.
Wage pressures were an important driver of the persistence of services inflation, and wage growth remained high and bumpy. The decline in wage growth so far anticipated by the projections and the ECB wage tracker still needed to be confirmed by hard data. At the same time, there were a number of indicators suggesting that wage growth was likely to slow from the current high level. Looking at the track record of the wage tracker in projecting future wage growth, increasing confidence appeared warranted that wage growth would be more subdued in the future. This should also help bring down services inflation. Overall, for inflation to be sustainably at 2%, wage inflation would have to settle at the targeted inflation rate plus trend productivity growth.
As regards longer-term inflation expectations, members took note of the latest developments in market-based measures of inflation compensation and survey-based indicators. Some market-derived measures of medium-term inflation expectations had now dropped to below 2%, while longer-term inflation expectations stood close to 2%. Consumer inflation expectations had moved up significantly in November, especially over the three-year horizon.
Against this background, with respect to risks to the inflation outlook, members assessed that inflation could turn out higher if wages or profits increased by more than expected. Upside risks to inflation also stemmed from the heightened geopolitical tensions, which could push energy prices and freight costs higher in the near term and disrupt global trade. Moreover, extreme weather events, and the unfolding climate crisis more broadly, could drive up food prices by more than expected. By contrast, inflation could surprise on the downside if low confidence and concerns about geopolitical events prevented consumption and investment from recovering as fast as expected, if monetary policy dampened demand more than expected, or if the economic environment in the rest of the world worsened unexpectedly. Greater friction in global trade would make the euro area inflation outlook more uncertain.
Turning to the monetary and financial analysis, market interest rates in the euro area had declined further since the October Governing Council meeting, reflecting the perceived worsening of the economic outlook and a repricing of policy rate expectations. Financial markets had repriced particularly strongly after recent PMI releases and were expecting significant further rate cuts between the current time and next autumn. In the context of the considerable uncertainty regarding the implications of changes to US policies, but also the uncertain domestic political outlook, financial markets were translating downside risks into lower real rates, lower equity prices and a weaker euro exchange rate.
Past interest rate cuts, together with the anticipation of future cuts, had contributed to an easing of financing conditions. Bank lending to both the non-financial corporate sector and households was recovering slowly, suggesting that the impact of the past monetary policy tightening was waning and the effect on credit growth of the removal of policy restriction was starting to become visible. The net issuance of corporate debt securities, which had already seen a larger decrease in interest rates than bank loans, had picked up. Housing markets were showing the first signs of a turnaround, with house prices rising and mortgage demand recovering in many countries.
In their biannual exchange on the links between monetary policy and financial stability, members concurred that euro area banks had remained resilient and continued to have solid capital and liquidity positions. On the whole, euro area banks had navigated the phase of monetary policy restriction well, although concerns persisted with regard to governance, operational resilience and risk management, including in relation to climate and nature-related risks. Nonetheless, financial stability risks remained elevated in view of stretched US stock market valuations and risks of financial deregulation, as well as increased global activity in the realm of cryptocurrency, involving non-bank financial intermediaries and, to a lesser extent, the banking sector. Finally, geopolitical risks were often not fully priced in by financial markets until they materialised, which could lead to an abrupt repricing of risks and jeopardise banks’ capital adequacy. It was recalled that macroprudential policy remained the first line of defence against the build-up of financial vulnerabilities.
Monetary policy stance and policy considerations
Turning to the monetary policy stance, members assessed the data that had become available since the last monetary policy meeting in accordance with the three main elements that the Governing Council had cited in 2023 as shaping its reaction function. These comprised (i) the implications of the incoming economic and financial data for the inflation outlook, (ii) the dynamics of underlying inflation, and (iii) the strength of monetary policy transmission.
Regarding the inflation outlook, members were increasingly confident that inflation would return to target in the first half of 2025, which was earlier than had been foreseen in the previous projections. While the Governing Council’s job was not yet fully done, the return of inflation to target was getting closer according to the staff projections. Moreover, the new projections foresaw inflation rates of around 2% as early as the second quarter of 2025 and notably lower inflation over the near term than had been foreseen in the September 2024 projections. It was also noted that for the past two years the staff inflation projections had been remarkably accurate and that, despite the large inflation shock over the past three years, measures of longer-term inflation expectations remained well anchored.
It was clear, however, that the Governing Council should not let its guard down in the final stretch of disinflation, particularly as some assumptions underlying the projections still needed to be corroborated by hard data and were conditional on monetary policy making its contribution and working its way through the economy. There were still many upside and downside risks to the inflation outlook, with key aspects of the projections, such as the recovery in productivity growth, still to be confirmed. Uncertainty surrounded the future policies to be pursued by the incoming US Administration – including the impact of tariffs and potential retaliation, fiscal and trade uncertainty, the evolution of the exchange rate and its pass-through to inflation. This was added to domestic political uncertainties and the outlook for energy and food prices. In this context it was recalled that the Governing Council had a single mandate, namely to maintain price stability, rather than a dual mandate which would pose a trade-off between price stability on the one hand and growth and employment considerations on the other hand – although it had to be recognised that a weaker economy could imply further downward pressure on inflation. It was remarked that, if the economy did not pick up, the likelihood would increase that inflation would undershoot the target further down the road.
Comfort could be drawn from the fact that the staff projections for inflation in 2025 were close to both market pricing and survey results. Beyond the short term, markets were pricing in lower inflation than foreseen in the December Eurosystem staff projections, although market-based indicators also incorporated risk premia, which were negative over the medium term. This could mean that markets held a similar view of the inflation outlook as was entailed in the projections, but required higher compensation for downside risks over the medium term.
Turning to underlying inflation, members concurred that most measures were consistent with inflation returning to target in a timely manner. The PCCI, which had good forecasting properties for medium-term inflation, had declined substantially. However, domestic inflation was still high, driven mainly by high services inflation, and core inflation had also remained stubbornly high for several quarters. Although key data that could conclusively confirm the projected moderation in wage growth would only become available in the course of 2025, the softening of the labour market and recent information on negotiated wages were in line with a gradual easing of labour cost pressures.
As regards monetary policy transmission, the monetary policy stance remained restrictive, even though the DFR had been reduced by a series of cuts from its peak of 4%. As some of the lagged effects of past monetary policy tightening were still feeding through the macroeconomy, financing conditions – including for both market-based and bank-based financing – also continued to be restrictive overall. The cost of new credit for firms was elevated from a historical perspective, particularly in real terms, and the cumulative tightening of credit standards since the beginning of the hiking cycle had remained elevated. In addition, the average interest rate on the outstanding stock of mortgages was set to rise as fixed-rate loans were repriced at higher levels. At the same time, it was remarked that, since financial markets were expecting further rate cuts, the term structure of real risk-free interest rates had already become aligned with neutral levels for maturities of one year and above. The dialling-back of monetary policy restriction over the past few months was also being transmitted to financing conditions, although it had not yet fully passed through, with interest rates on new loans to firms and households having started to come down. The gradual fading of restriction had started to reach the real economy and should provide support to consumption and investment growth in the future.
At the same time, it was noted that the sensitivity of credit demand to the level of the interest rate was low, indicating that the monetary policy stance had already become noticeably less restrictive. According to the results of the latest available euro area bank lending survey, referring to the third quarter of 2024, a large share of banks (93%) reported that the general level of interest rates was not currently affecting overall demand for loans and credit lines to enterprises. This was in contrast to the results one year ago, when almost half of the respondent banks had seen an impact, and also reflected the anticipation of further rate cuts to come.
A remark was made that the general level of interest rates – including bank funding costs – had been much higher before the global financial crisis than it was now. To assess the restrictiveness of financing conditions it was necessary to take into account the level of the natural or neutral rate of interest. It was argued that several factors might have shifted the rate upwards since the outbreak of the pandemic. These included rising public debt around the world, the need for major investment to tackle the digital and green transitions, and global fragmentation, contributing to a reversal of the global savings glut. Conversely, factors that could drive the natural rate lower were related to demographic and productivity developments, as well as a higher propensity to save. Productivity developments were surrounded by high uncertainty in view of the conflicting influences stemming from the structural decline in traditional manufacturing and from the rise of artificial intelligence. Overall, while the natural or neutral rate of interest was a useful analytical concept, available estimates could only be a rough gauge of the restrictiveness of monetary policy owing to very high model and parameter uncertainty. Therefore, it was argued that a gradual approach was needed to allow an assessment of whether policy rates had reached a broadly neutral level, taking proper account of transmission lags.
More generally, it was advisable to draw on a broad range of approaches to estimate or model the natural rate and assess the restrictiveness of policy, and to also look at the interplay of output, inflation and interest rates. Credit dynamics, allowing for transmission lags, were also informative about the level of restrictiveness of monetary policy. In a predominantly bank-based financial system like the euro area, there was also a need to assess average funding costs, taking into account the cost of bank loans, not only the cost of financing through the bond market, given the importance of banks for small and medium-sized enterprises.
Finally, it was remarked that the monetary policy stance was not predicated only on interest rates but also on the size of the Eurosystem balance sheet, which would shrink by around €40 billion per month from January 2025. At the same time, it was recalled that the reduction in the Eurosystem balance sheet had been announced well in advance and should already have been priced in to a significant extent at the time of that announcement.
Monetary policy decisions and communication
Against this background, all members supported the proposal by Mr Lane to lower the three key ECB interest rates by 25 basis points. A cut of this magnitude was in line with a controlled pace of easing and provided a sense of the direction of the path of interest rates. While the projections were conditional on a downward path for policy rates that implied another cut in January, it was reiterated that data dependency precluded any foregone conclusions regarding the future rate path. A measured pace of interest rate cuts was consistent with the general notion that more “check points” had to be passed to ascertain whether disinflation remained on track and kept open the optionality to make adjustments along the way. This cautious approach was still warranted in view of the prevailing uncertainties and the existence of a number of factors that could hamper a rapid decline in inflation to target. Nevertheless, if the baseline projection for inflation was confirmed over the next few months and quarters, a gradual dialling-back of policy restrictiveness was seen as appropriate.
Some members noted that a case could be made for a 50 basis point rate cut at the current meeting and would have favoured more consideration being given to the possibility of such a larger cut. These members emphasised the deterioration in the euro area economic outlook over successive projection exercises and stressed that the risks to growth – amid many global and domestic political uncertainties – were tilted to the downside. A larger rate cut would provide insurance against downside risks to growth. Moreover, if the economy did not pick up, the risk that inflation could undershoot the target would increase. This suggested that monetary policy might become too restrictive, with interest rates still some distance from a neutral level. In this context, the need to signal the Governing Council’s commitment to the symmetric target was stressed, as well as the need to remain vigilant to prevent the materialisation of both upside and downside risks to inflation.
At the same time, members widely concurred that a 25 basis point cut was appropriate in light of the gradual but not complete progress made towards returning inflation to 2% on a sustained basis and in view of the prevailing risks and uncertainties. In this respect, it was pointed out that if, as reflected in the staff projections, the economy was to expand at a pace around its potential growth in the coming years, inflation should neither overshoot nor undershoot the 2% target materially. It was also underlined that, in any case, the ECB had a single mandate of price stability, not a dual mandate, and since the disinflation process had not yet been concluded it was too early to cut rates by a larger amount. Moreover, it was remarked that a 50 basis point cut could be perceived as the ECB having a more negative view of the state of the economy than was actually the case. This was not desirable unless warranted by additional negative shocks. Furthermore, it had to be kept in mind that with the rate cut decided at the October meeting the Governing Council had already demonstrated its commitment to react to a worsening macroeconomic outlook associated with a weakening of inflationary pressures by increasing the speed of interest rate adjustments.
The point was also made that the frequency of price adjustments was likely lower in a situation of weak growth or when facing negative shocks, implying a flatter Phillips curve. This meant that the case for adjusting interest rates by 50 basis points was not the same on the way down as it had been during the rate-hiking cycle. Similarly, any unanchoring of inflation expectations was likely to be less rapid on the way down, although it could be more persistent owing to the lower bound on interest rates. Therefore, a significant worsening of the growth outlook under a flat Phillips curve might not necessarily trigger a steep decline in inflation, implying that the downside risks to inflation were not very large. This reasoning should not rule out more decisive action in adverse scenarios or in the event that the Phillips curve were to become steeper.
Members also pointed out that a significant part of the economic slowdown was likely attributable to structural factors that monetary policy could not address and which needed to be addressed by governments. Only part of the economic slowdown was seen as cyclical, and in these conditions accommodative monetary policy would be unable to boost potential growth if for structural reasons firms did not wish to invest. However, it was argued that a faster normalisation of monetary policy, aimed at running the economy at potential, would provide more room for governments to address structural problems. At the same time, monetary policy was ineffective in resolving structural weaknesses. It could not take on responsibility for long-term growth, which was rather the responsibility of governments. The best contribution that monetary policy could make was to provide price stability and thereby remove a major source of uncertainty.
Members also argued in favour of maintaining a data-dependent and meeting-by-meeting approach to determining the appropriate level of policy rates, taking into account transmission lags and emphasising that data dependency did not mean only looking backwards at past data but also forwards at the medium-term outlook. It was remarked that data dependency implied taking an analytical approach, using not just hard data and survey indicators but also economic models and judgement to project trends in inflation dynamics and assess the risks surrounding the outlook.
Turning to communication aspects, members supported the proposed change in the wording of the monetary policy statement that removed the tightening bias by replacing the intention to “remain sufficiently restrictive” with a more two-sided pledge to adopt the appropriate stance “to ensure that inflation stabilises sustainably at our 2% medium-term target”. This change in the communication was seen as reinforcing the rate cut.
Overall, members concluded that the proposed changes to the communication struck a fine balance between removing the reference to maintaining monetary policy restrictiveness while avoiding sending a signal that the path of rate adjustments was preset. In this context, the change in the communication was seen as an adjustment to better reflect the ECB’s reaction function in view of the latest circumstances, rather than being a change in the way monetary policy was conducted.
Members also agreed with the proposal by Mr Lane for reinvestments of the principal payments from maturing securities purchased under the pandemic emergency purchase programme (PEPP) to cease at the end of 2024, in line with the Governing Council’s intention expressed at its meeting in June 2024. Moreover, members highlighted that in December 2024 banks would repay the remaining amounts borrowed under the targeted longer-term refinancing operations, which concluded this part of the balance sheet normalisation process.
Taking into account the foregoing discussion among the members, upon a proposal by the President, the Governing Council took the monetary policy decisions as set out in the monetary policy press release. The members of the Governing Council subsequently finalised the monetary policy statement, which the President and the Vice-President would, as usual, deliver at the press conference following the Governing Council meeting.
Monetary policy statement
Monetary policy statement for the press conference of 12 December 2024
Press release
Meeting of the ECB’s Governing Council, 11-12 December 2024
Members
- Ms Lagarde, President
- Mr de Guindos, Vice-President
- Mr Centeno
- Mr Cipollone
- Mr Demarco, temporarily replacing Mr Scicluna
- Mr Elderson
- Mr Escrivá
- Mr Holzmann
- Mr Kazāks
- Mr Kažimír
- Mr Knot
- Mr Lane
- Mr Makhlouf*
- Mr Müller*
- Mr Nagel*
- Mr Panetta
- Mr Patsalides
- Mr Rehn
- Mr Reinesch
- Ms Schnabel
- Mr Šimkus
- Mr Stournaras*
- Mr Vasle
- Mr Villeroy de Galhau
- Mr Vujčić
- Mr Wunsch*
* Members not holding a voting right in December 2024 under Article 10.2 of the ESCB Statute.
Other attendees
- Mr Dombrovskis, Commission Executive Vice-President**
- Ms Senkovic, Secretary, Director General Secretariat
- Mr Rostagno, Secretary for monetary policy, Director General Monetary Policy
- Mr Winkler, Deputy Secretary for monetary policy, Senior Adviser, DG Economics
** In accordance with Article 284 of the Treaty on the Functioning of the European Union.
Accompanying persons
- Mr Arpa
- Mr Garnier
- Mr Gavilán
- Mr Gilbert
- Mr Horváth
- Mr Kaasik
- Mr Kelly
- Mr Koukoularides
- Mr Lünnemann
- Mr Nicoletti Altimari
- Mr Novo
- Mr Rutkaste
- Ms Schembri
- Mr Šiaudinis
- Mr Šošić
- Mr Tavlas
- Mr Ulbrich
- Mr Välimäki
- Mr Vanackere
- Ms Žumer Šujica
Other ECB staff
- Mr Proissl, Director General Communications
- Mr Straub, Counsellor to the President
- Ms Rahmouni-Rousseau, Director General Market Operations
- Mr Arce, Director General Economics
- Mr Sousa, Deputy Director General Economics
Release of the next monetary policy account foreseen on 27 February 2025.
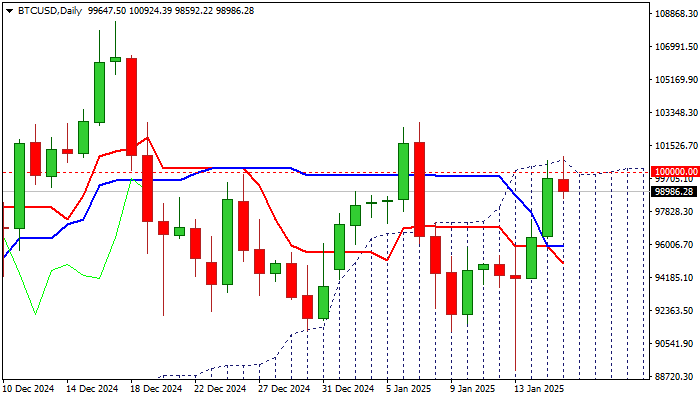
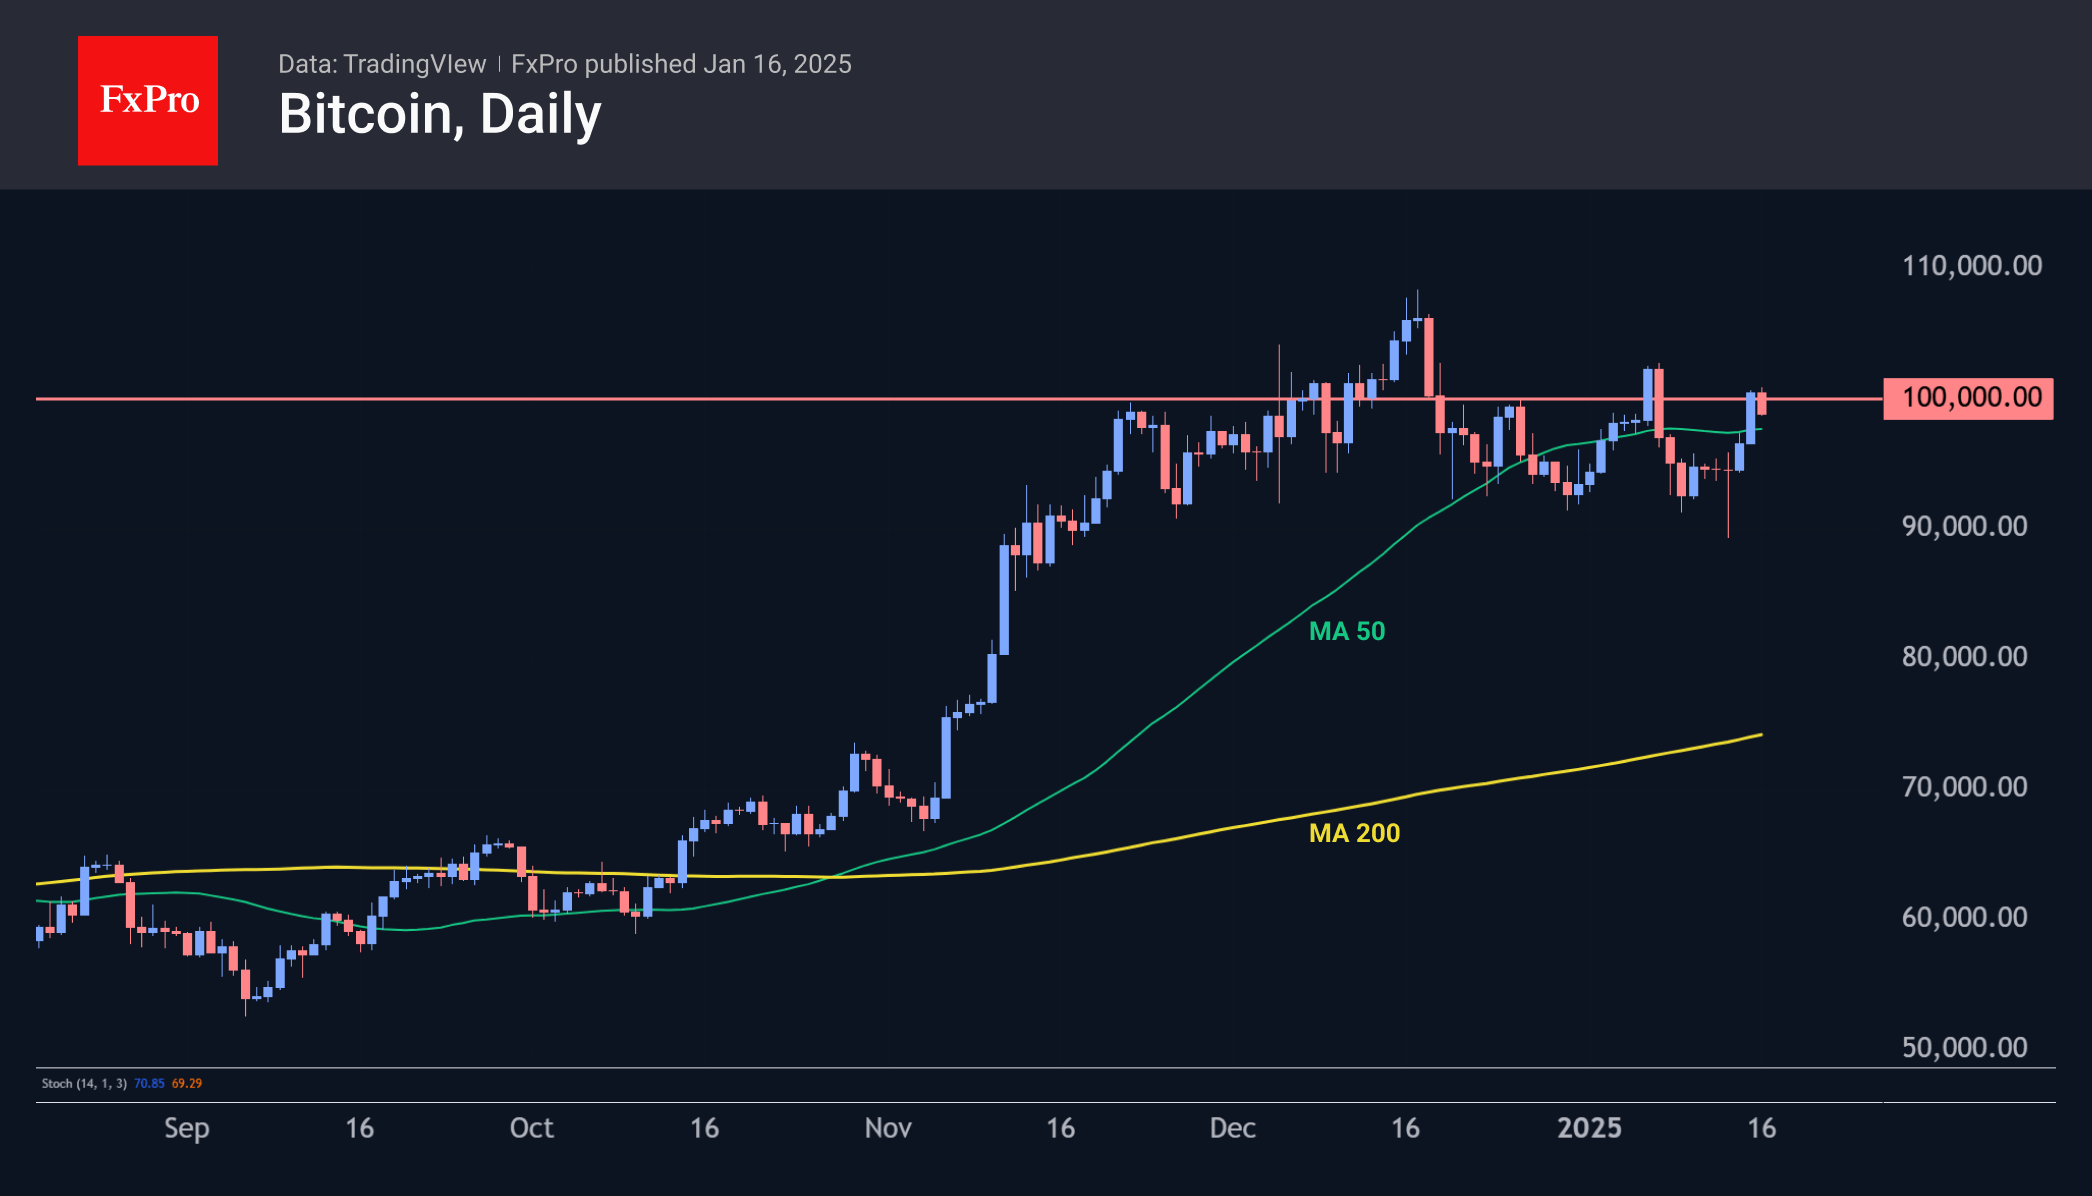
BTCUSD Cracks 100K Barrier as Sentiment Brightens
BTCUSD – quick rebound after recent strong downside rejection at key 90K support zone, probed through psychological 100K barrier, signaling that bulls are back to play.
The sentiment improved on news that incoming Trump’s administration will start overhauling US SEC cryptocurrency policies as soon as they take power next week.
Top Republican officials at the Securities and Exchange Commission will work on rules that will clarify when the cryptocurrency become a security, as well as work on ending a crypto crackdown lead by former SEC chair from the Democrat party.
Dynamic of works of new officials will directly reflect on crypto’s price action, with brightening outlook expected to continue to inflate the price.
Meanwhile, fresh bulls may show further hesitation at 100K barrier (reinforced by the top of thick daily Ichimoku cloud), as the price repeatedly fails to sustain gains above this barrier.
Partial profit taking in this zone (also due to overbought conditions on daily chart) would push the price lower, but dips are likely to be limited and mark positioning for final push higher.
Initial supports lay at 98300/98100 zone (10-period MA on 4-hr chart / Fibo 23.6% of 89039/100924 recovery leg), followed by 97570 (200-period MA on 4-hr chart), with extended dips not to exceed 96500 support zone.
Firm break of 100K to open way for test of 102770 (Jan 7 lower top) and unmask target at 103830 (Fibo 76.4% of 108400/89038).
Res: 100100; 102730; 103830; 104030
Sup: 98300; 98100; 97570; 96400
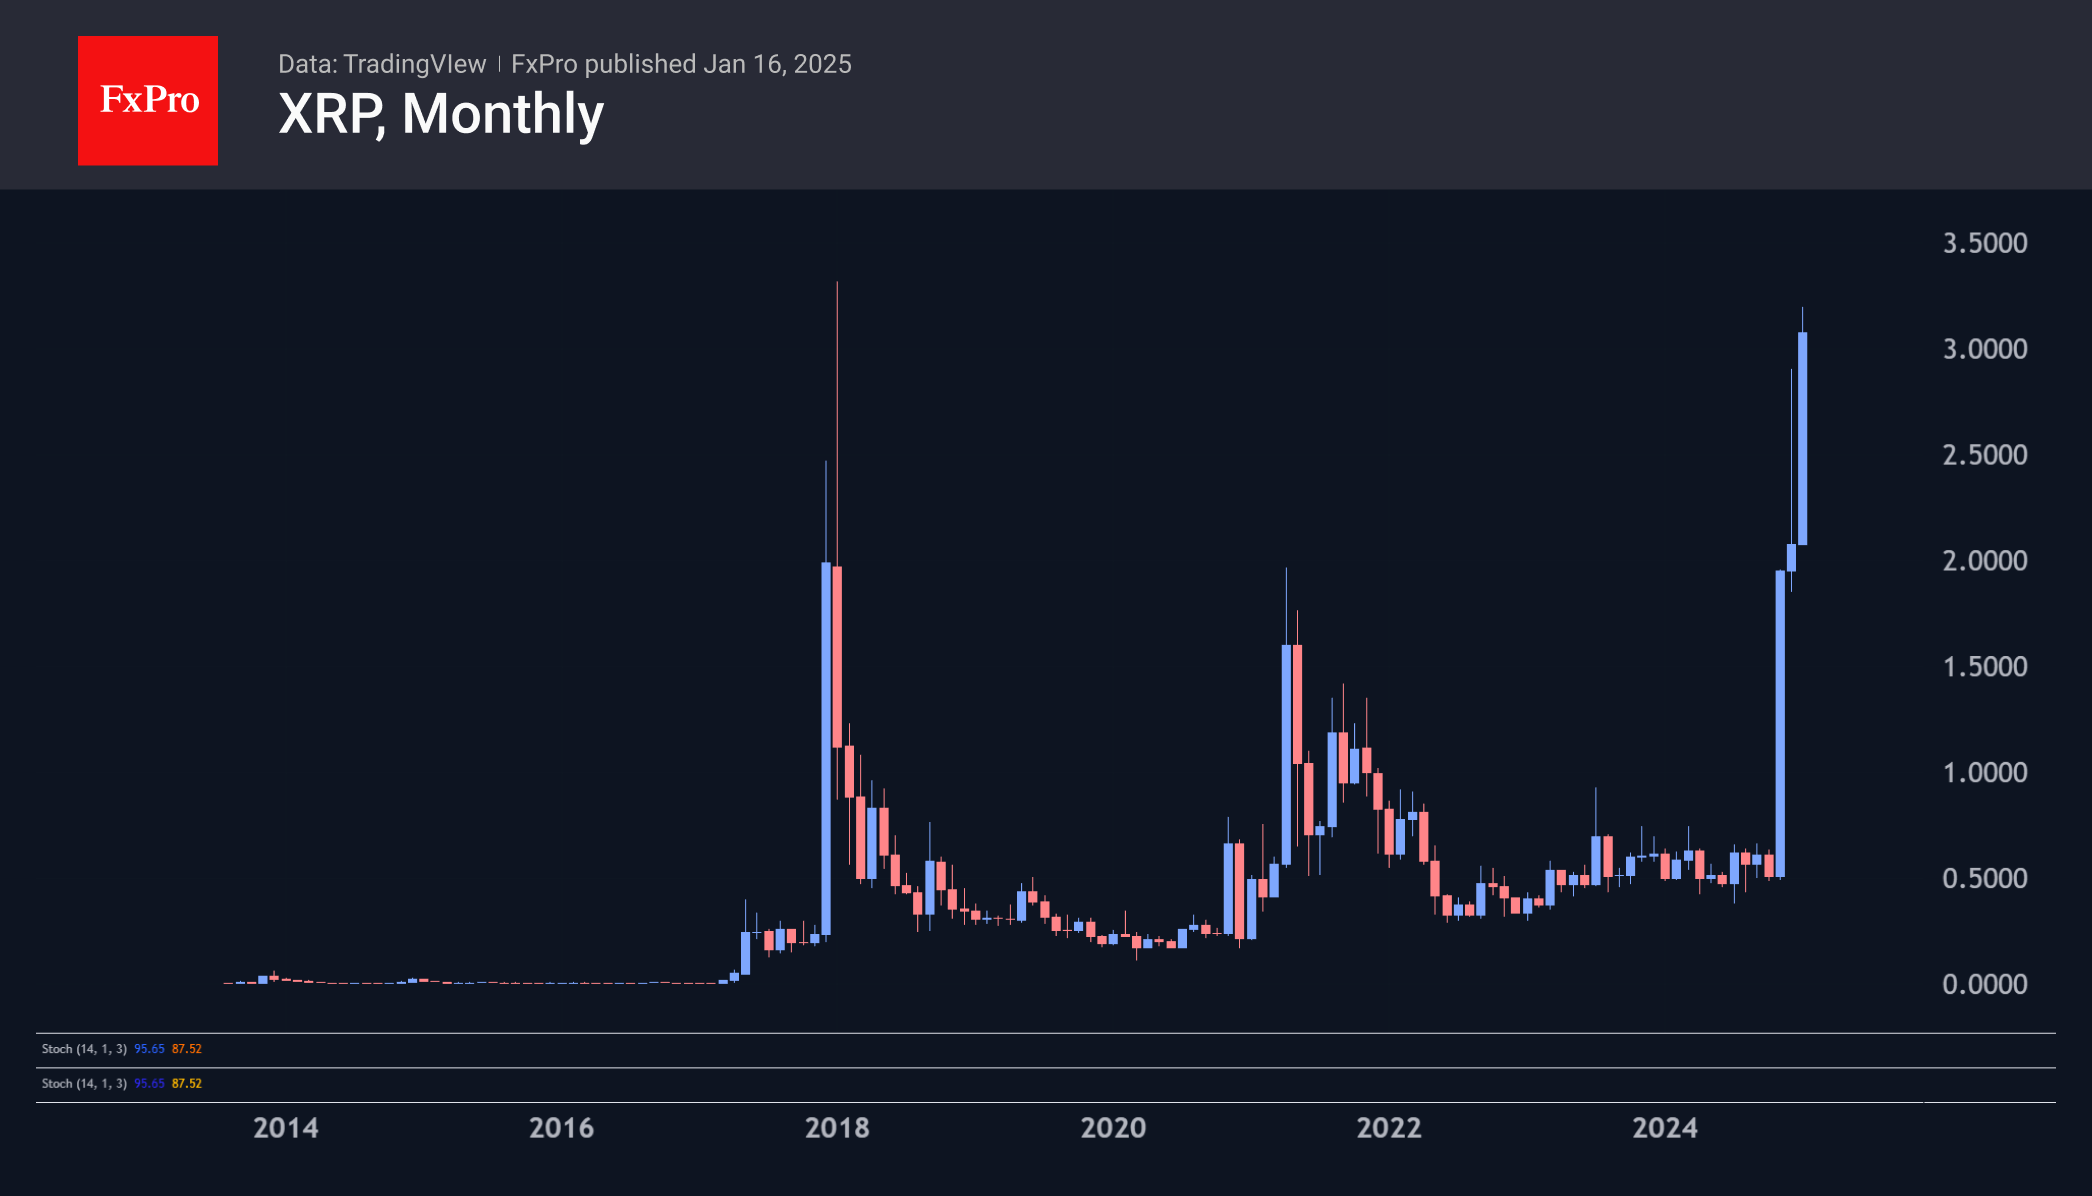
Bitcoin Hits $100K Again, XRP Tests Highs
Market picture
Crypto market capitalization rose another 3.4% in 24 hours to $3.5 trillion, recovering to levels seen before the January 7 sell-off. Both the decline at the beginning of the month and the latest recovery are due to U.S. economic data, which temporarily has an unusually strong impact on cryptocurrencies. Recently, crypto lacks its own drivers, other than Ripple’s case against the SEC and its impact on XRP.
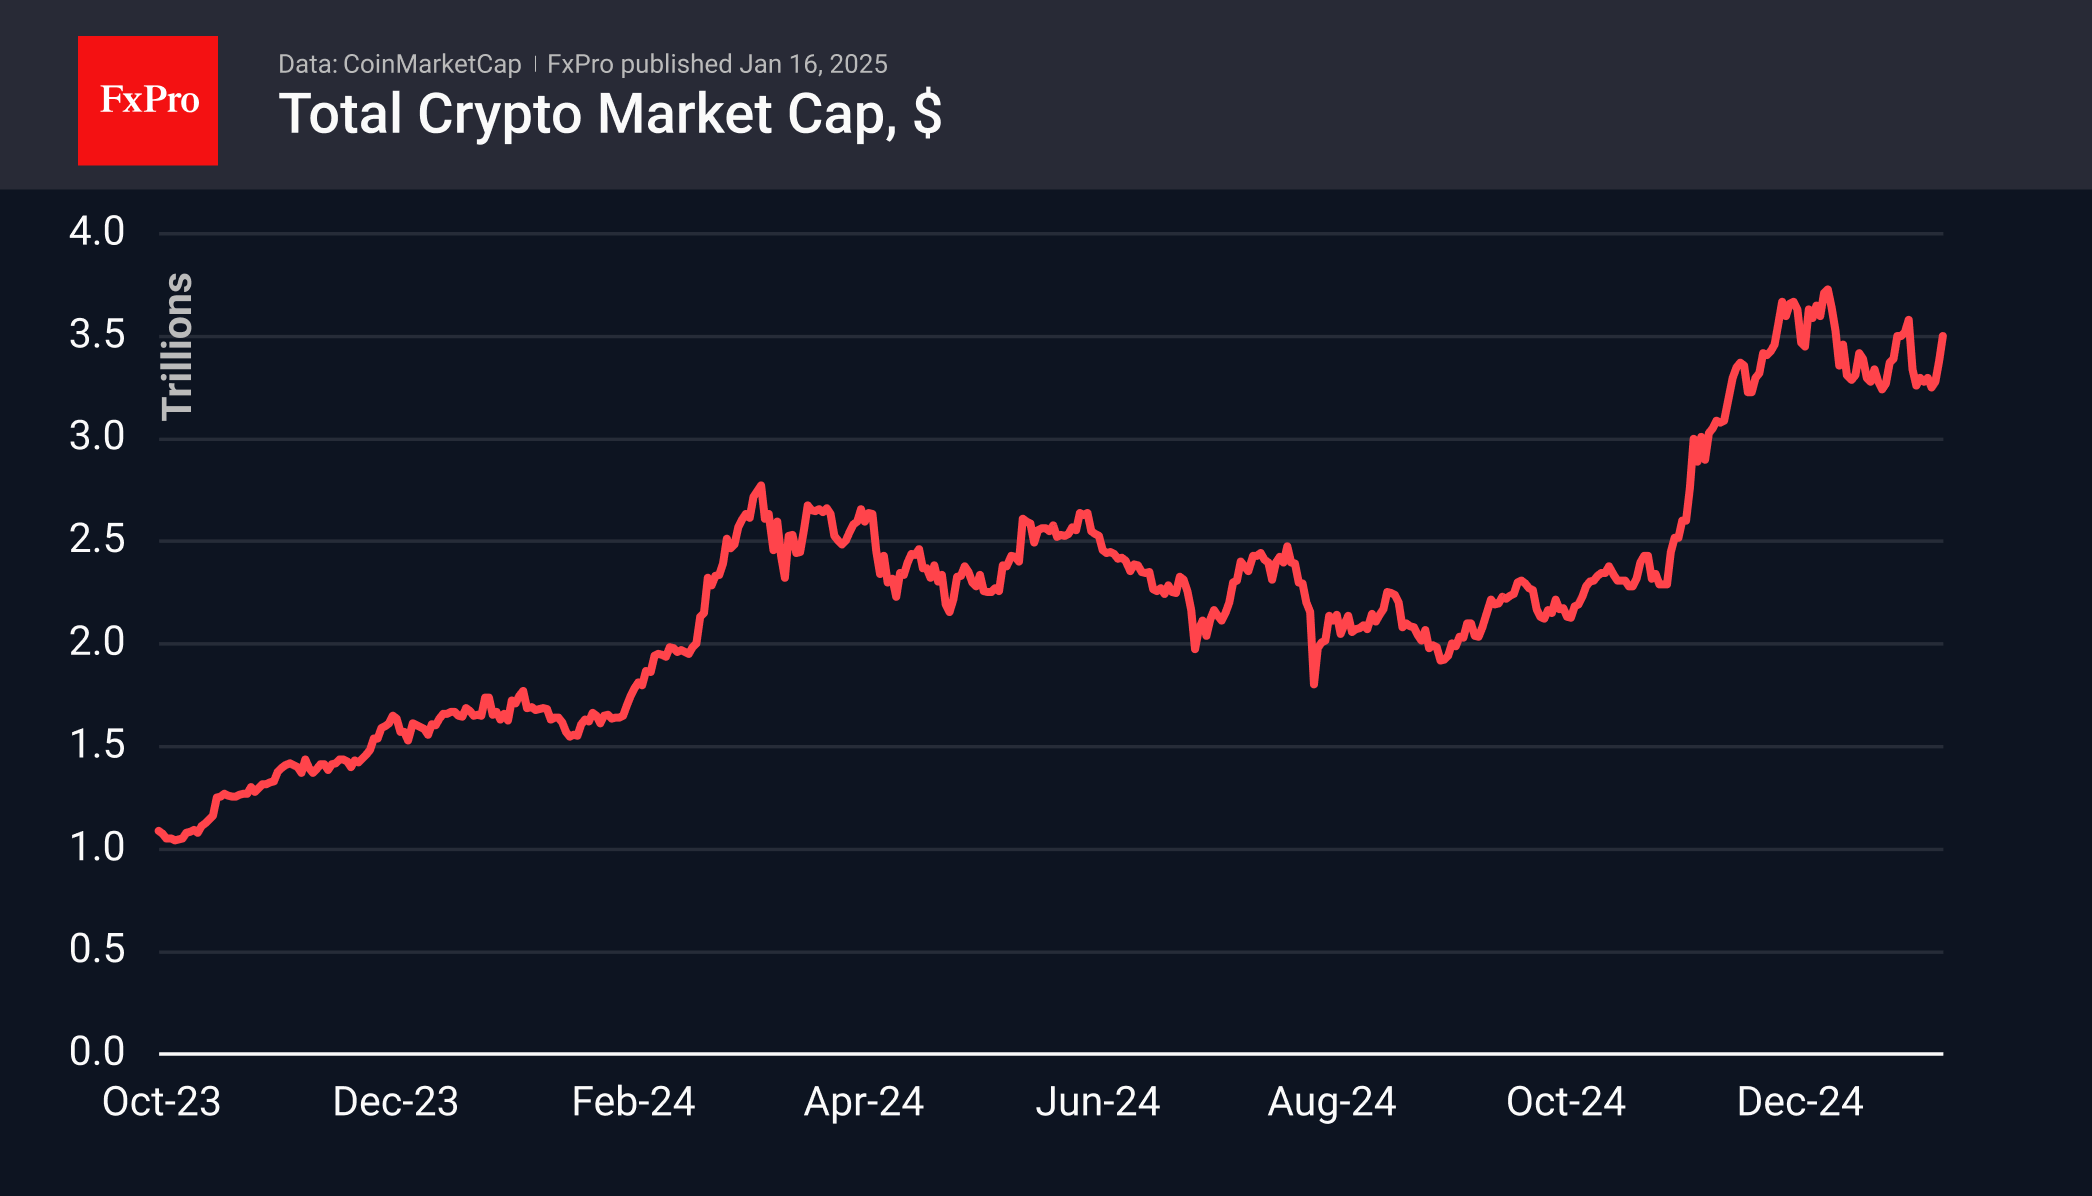
Bitcoin briefly climbed above $100K on Wednesday evening and Thursday morning, stabilizing near $99,600 by the start of active trading in Europe. The price closed Wednesday above the 50-day moving average (bullish signal), but this may just be another test of a meaningful round level. The selling activation after surpassing $100K is still clearly visible.
The XRP price soared to $3.20, pulling back later to $3.0. The coin was only above this mark for minutes in January 2018. This is an area of historical highs where you should prepare for increased volatility. Bulls are intrigued by the potential for a Fibonacci extension pattern with a potential target of $4.40. On the other hand, many long-term holders will probably want to get rid of this coin after years of losses, and some will want to lock in profits after a 10-fold increase in two years.
News background
The average purchase price through the Bitcoin ETF is $94K, and falling below that level can cause sell-offs in the BTC ETF.
Thanks to developments in blockchain infrastructure and clarifying legislation, 2024 was a positive year for USDC, Circle’s annual report notes. Compared to 2023, the asset’s turnover increased by 78%.
The U.S. SEC has extended by 45 days the deadline for a decision on an application to convert an index fund from Bitwise into an ETF. The Bitwise 10 Crypto Index Fund (BITW) product tracks the 10 “most valuable proven cryptocurrencies” weighted by market capitalization.
According to Bloomberg, the CFTC may open an investigation against Crypto.com. The commission questioned the legality of the exchange’s futures contracts, which allow users to bet on sporting events.
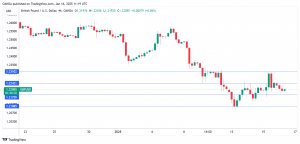
UK GDP Less Than Expected, Pound Edges Lower
The British pound has edged lower on Thursday. In the European session, GBP/USD is currently trading at 1.2205, down 0.22%.
UK GDP posts weak gain of 0.1%
The UK economy climbed out of negative growth for the first time in three months but not by much. After GDP contracted by 0.1% in September and October, November saw a small gain of 0.1%, missing the market estimate of 0.2%. In the three months to November, GDP showed no growth.
The small uptick in growth in November was welcome news for the government but the economic outlook is not very bright. The recent “tax and spend” budget will see tax increases take effect in April, including a rise in employer National Insurance contributions. This will hurt the business sector and many firms will cut back on spending and investment, which in turn will dampen economic growth. Inflation remains high and combined with low growth, stagflation is a real danger.
Another headache for the government is Donald Trump, who has promised to slap tariffs on US trading partners. The UK is heavily reliant on its export sector and a trade war with the US would be devastating for the fragile UK economy. As well, Trump’s protectionist trade polices could lead to higher inflation which could derail much of the progress made to contain inflation. This week’s soft UK inflation and GDP reports have raised expectations that the Bank of England will lower interest rates at the next meeting on Feb. 6.
In the US, December’s inflation release presented a mixed picture, as headline CPI rose for a third straight month, while core CPI eased slightly. Expectations for a rate cut rose in the aftermath of the inflation report, sending the US dollar lower against many of the majors.
GBP/USD Technical
- GBP/USD tested resistance at 1.2242 earlier. Above, there is resistance at 1.2310
- 1.2176 and 1.2108 are the next support levels
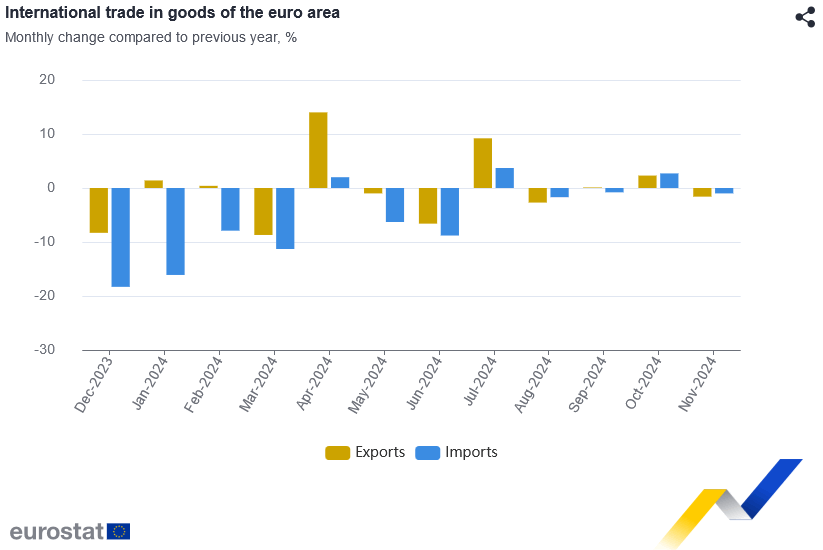
Eurozone goods exports fall -1.6% yoy in Nov, imports down -1.0% yoy
Eurozone goods exports fell -1.6% yoy to EUR 248.3B in November. Good imports fell -1.0% yoy to EUR 231.9B. Trade balanced showed a EUR 16.4B surplus. Intra-Eurozone trade fell -7.0% yoy to EUR 214.8B.
In seasonally adjusted term, goods exports rose 3.2% mom to EUR 240.6B.Goods imports rose 0.7% mom to EUR 227.8B. Trade balance widened from October's EUR 7.0B to EUR 12.9B, larger than expectation of EUR 7.2B. Intra-Eurozone trade fell -1.7% mom to EUR 210.4B.
USD/JPY: Yen Strength Elements Emerged Ahead of BoJ Meeting Next Week
- Hawkish speeches from BoJ officials coupled with a softer US core CPI print for December put an interim ceiling on US dollar strength against the yen.
- The leading 10-year yield spread of the US Treasury note against the JGB has staged a bearish breakdown condition.
- Medium-term uptrend of USD/JPY from 16 September 2024 low is at risk of shaping a potential multi-week corrective decline sequence.
- Watch the key medium-term resistance of 158.35/80 on the USD/JPY.
Since the start of the new year, the persistent US dollar strength against the Japanese yen seen in the last quarter (Q4) of 2024 has started to ease.
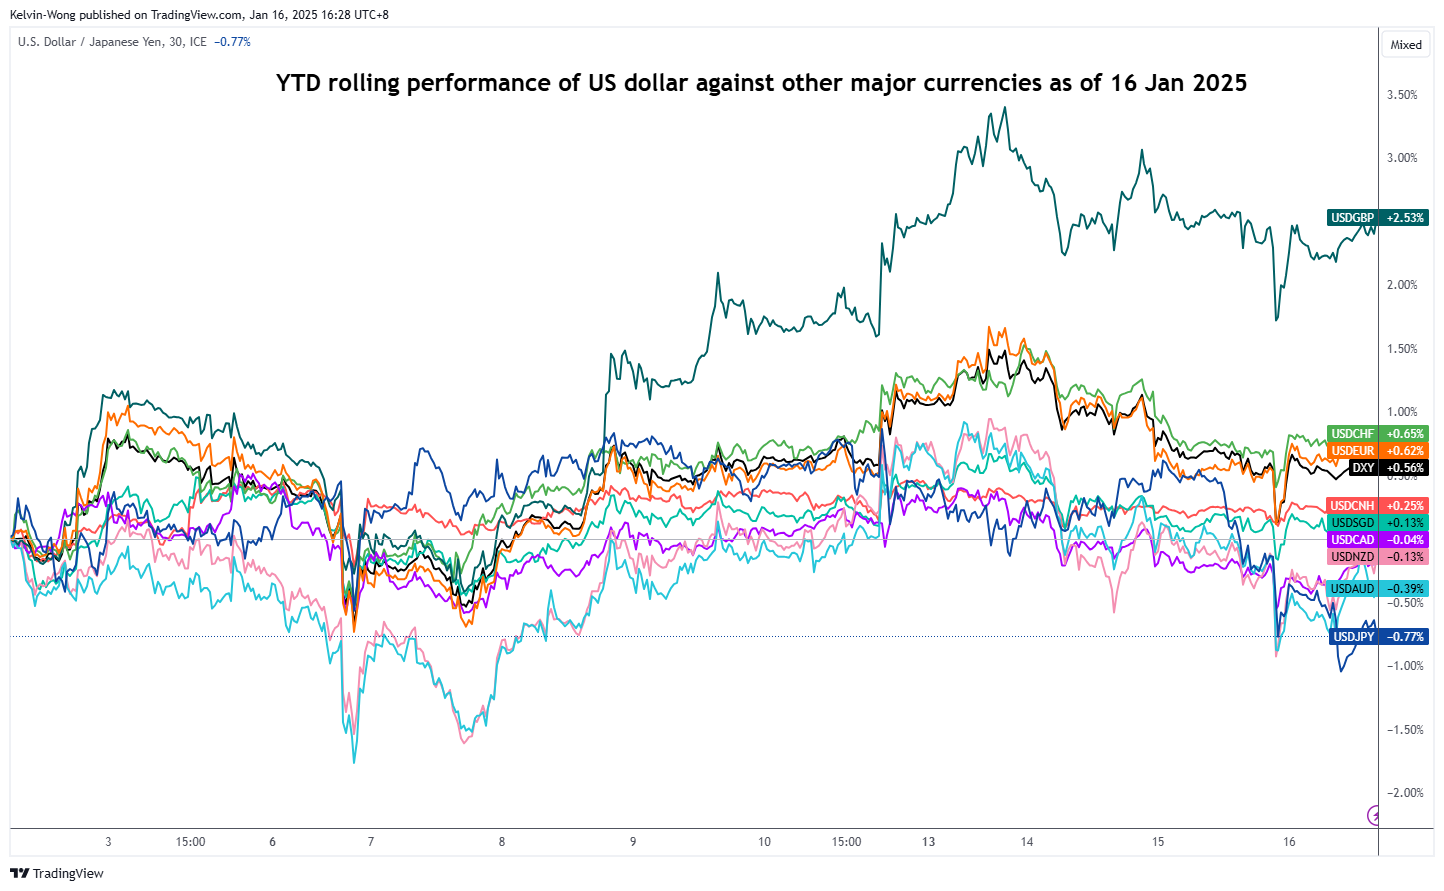
Fig 1: Year-to-date performance of the US dollar against major currencies as of 16 Jan 2025 (Source: TradingView, click to enlarge chart)
Based on the year-to-date rolling performance as of Thursday, 16 January, the performance of the US dollar is the weakest against the yen versus other major developed nations’ currencies as the USD/JPY shed -0.77% (see Fig 1).
This week, speeches from the Bank of Japan (BoJ) Governor Ueda and his deputy Himino have mentioned encouraging remarks on a stronger positive outlook towards Japanese corporations raising employees’ salaries compared to December.
These positive remarks on wage growth in Japan have signalled a rate hike chance at the BoJ’s next policy meeting to be concluded on Friday, 24 January which in turn softened the USD/JPY’s prior bullish momentum coupled with a softer core US CPI print for December that eased to 3.2% y/y from November print of 3.3% and came in slightly below expectations of 3.3%.
Longer-term US Treasury yield premium shrinkage over JGB
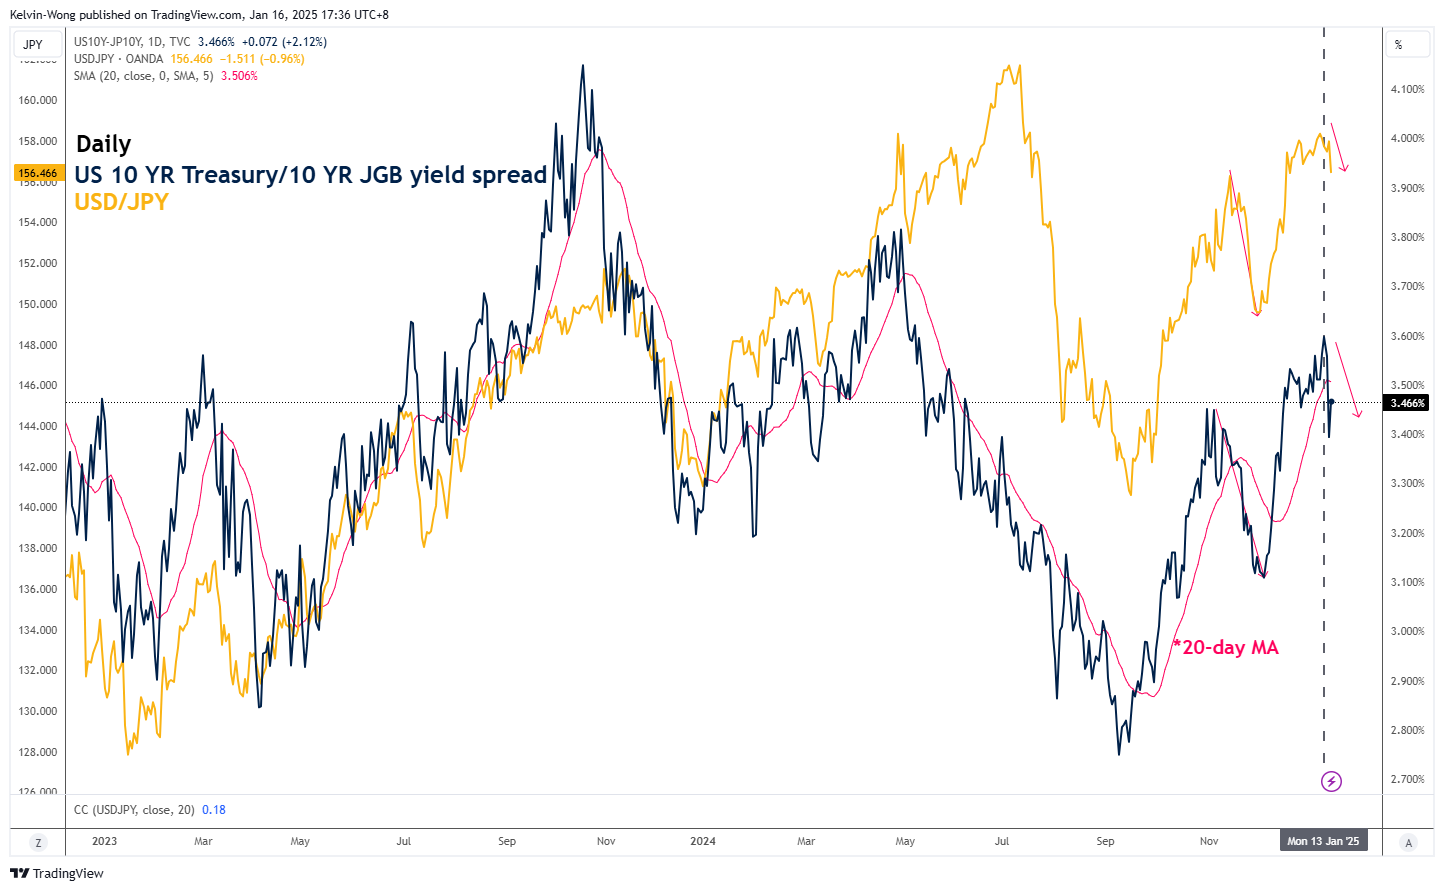
Fig 2: 10-year yield spread of US Treasury/JGB with USD/JPY as of 16 Jan 2025 (Source: TradingView, click to enlarge chart)
The yield spread between the 10-year US Treasury note and the 10-year Japanese Government Bond (JGB) has a direct correlation movement with the USD/JPY (see Fig 2).
Based on past observations, the movement of the 10-year yield spread of the US Treasury against JGB has a lead time over the USD/JPY where the yield spread inched downwards on 5 November 2024 and broke below its 20-day moving average thereafter on 20 November 2024.
This prior bearish movement of the yield spread between the 10-year US Treasury note over the JGB took precedence ahead of the USD/JPY medium-term decline of 7% from 14 November 2024 to 2 December 2024.
Right now, a similar bearish movement of the 10-year yield spread of the US Treasury against JGB has been detected from 13 January 2025 to 14 January 2025 where the US Treasury yield premium declined from 3.6% to 3.7% and broke below the 20-day moving average at this time of the writing.
Hence, if the yield spread between the 10-year US Treasury note over the JGB continues to inch lower, the USD/JPY may see further downside pressure.
Bearish momentum detected
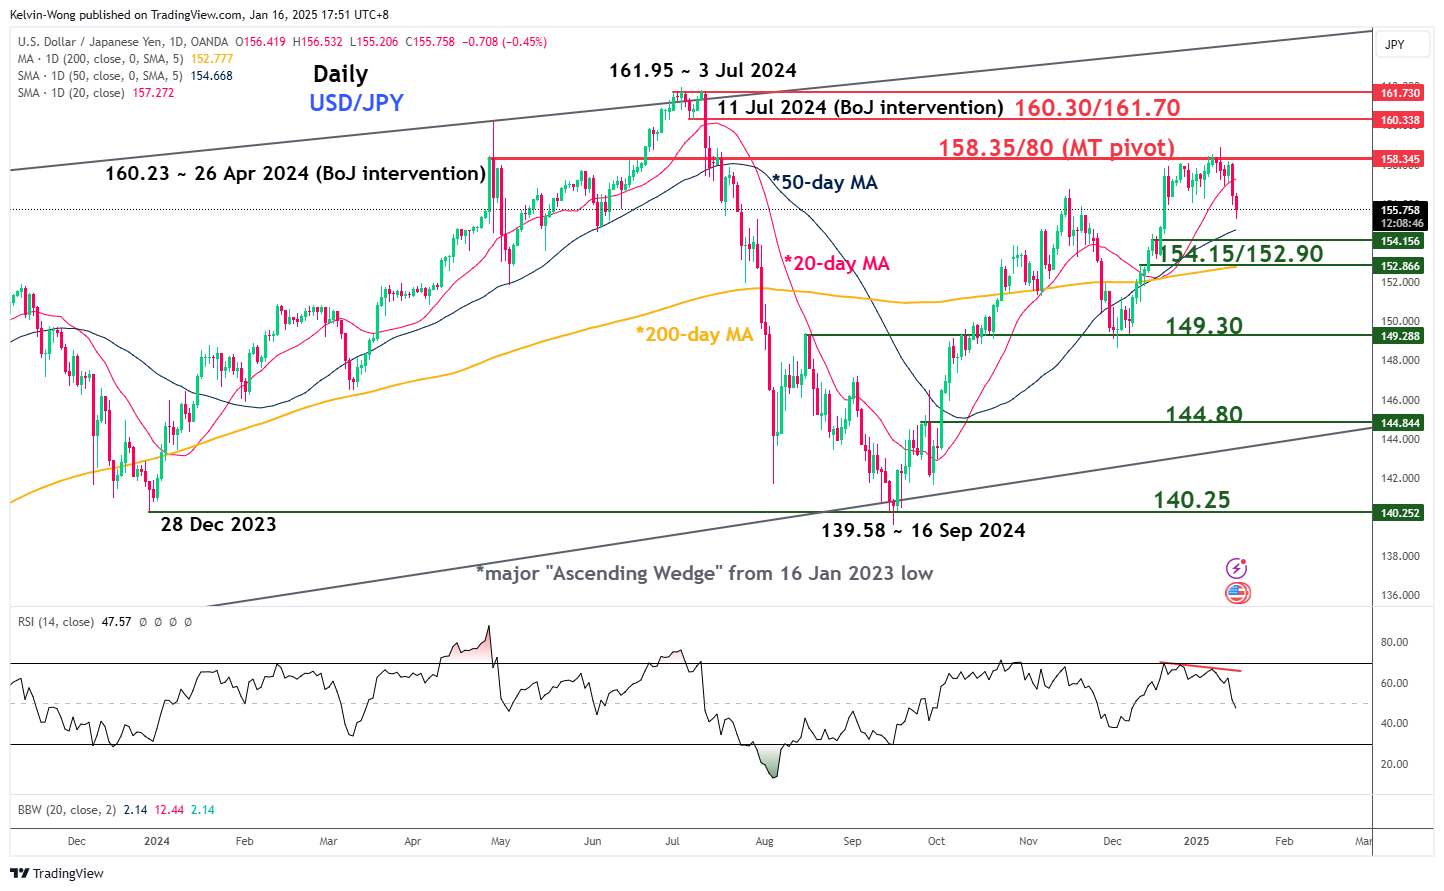
Fig 3: USD/JPY medium-term & major trend phases as of 16 Jan 2025 (Source: TradingView, click to enlarge chart)
The daily RSI momentum indicator of the USD/JPY has flashed on a recent bearish divergence condition at its overbought region since 8 January 2025 and just broke below the 50 level at this time of writing.
These observations suggest that the medium-term uptrend from the 16 September 2024 low of 139.58 is in jeopardy of shaping a potential multi-week corrective decline sequence.
Watch 158.35/80 key medium-term pivotal resistance and a break below 152.90 (also the 200-day moving average) may trigger the corrective decline to expose the next medium-term supports at 149.30 and 144.80 (see Fig 3).
On the other hand, a clearance above 158.80 invalidates the bearish scenario for a squeeze up to retest the 160.30/161.70 major resistance.
Dollar Falls Following US Inflation Data Release
Weaker-than-expected US Consumer Price Index (CPI) data released yesterday triggered a downward correction in the US dollar. The USD/JPY pair lost more than 150 points in just a couple of hours, USD sellers in USD/CAD managed to push the price below 1.4400, and European currencies partially recovered earlier-formed reversal patterns for buying.
USD/JPY
On the daily timeframe, the USD/JPY pair has broken out of a three-week consolidation range of 158.40–156.20. If sellers manage to secure the price below the lower boundary of this range, further downward movement towards 154.50–154.00 is possible. A resumption of the upward trend may occur if the price returns above 156.20.
Events likely to influence USD/JPY pricing include:
- 16:30 (GMT+2): US Core Retail Sales Index
- 16:30 (GMT+2): Initial Jobless Claims in the US
- 16:30 (GMT+2): Philadelphia Fed Manufacturing Index (US)
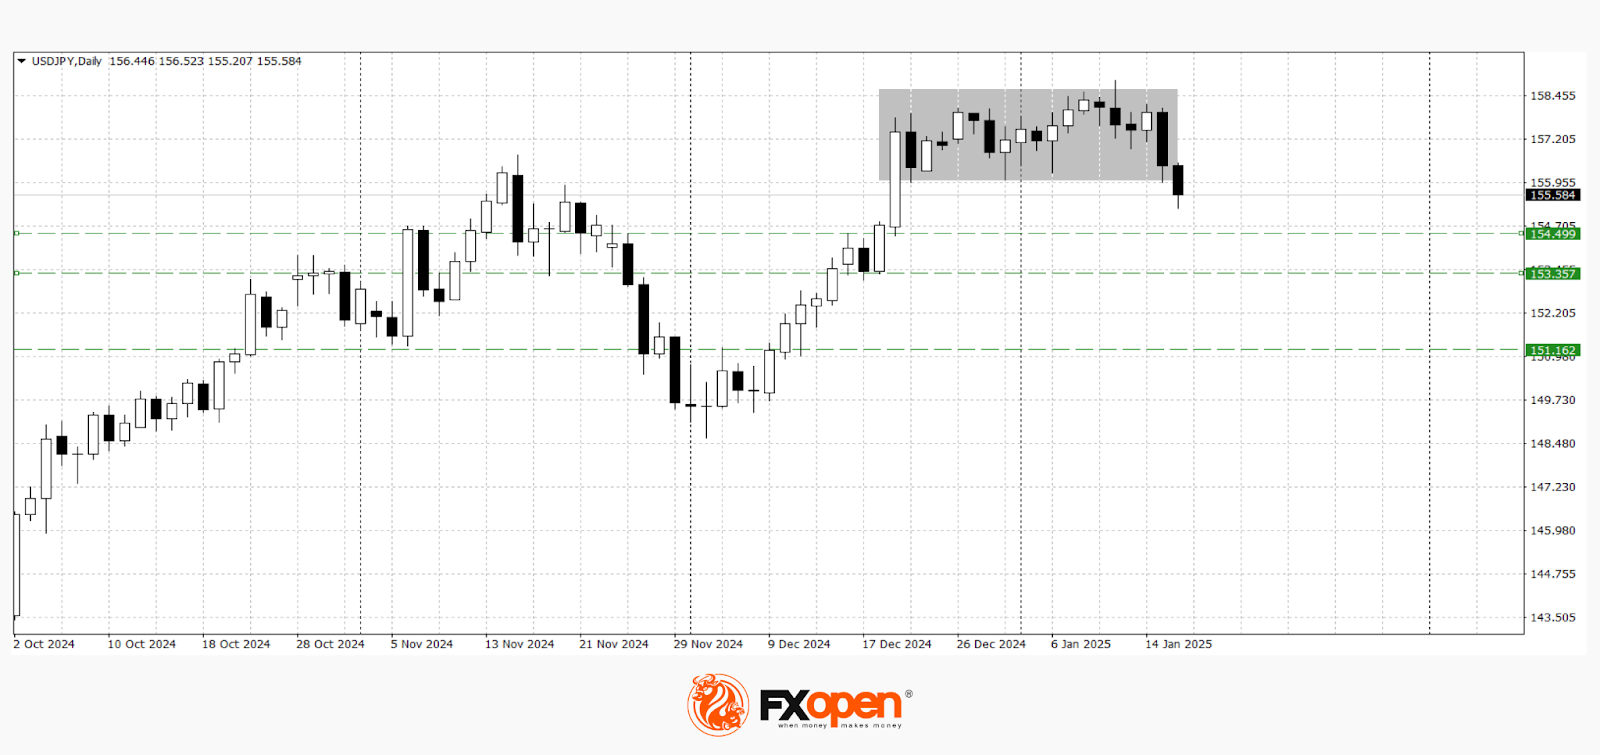
USD/CAD
A retest of the critical resistance level at 1.4450 proved unsuccessful for USD/CAD buyers. The rejection from this level resulted in a 120-point decline, leading the pair back to the 1.4300 zone. Technical analysis of USD/CAD suggests a sideways movement. Currently, the pair could decline to the 1.4300–1.4280 area. If the pair rebounds from this zone, price strengthening towards 1.4450–1.4400 is possible.
Events that may trigger a breakout from the USD/CAD flat range include:
- 16:15 (GMT+2): Canadian Housing Starts
- 20:30 (GMT+2): Speech by Bank of Canada Deputy Governor Gravel
- Tomorrow at 16:30 (GMT+2): Foreign Investment in Canadian Securities
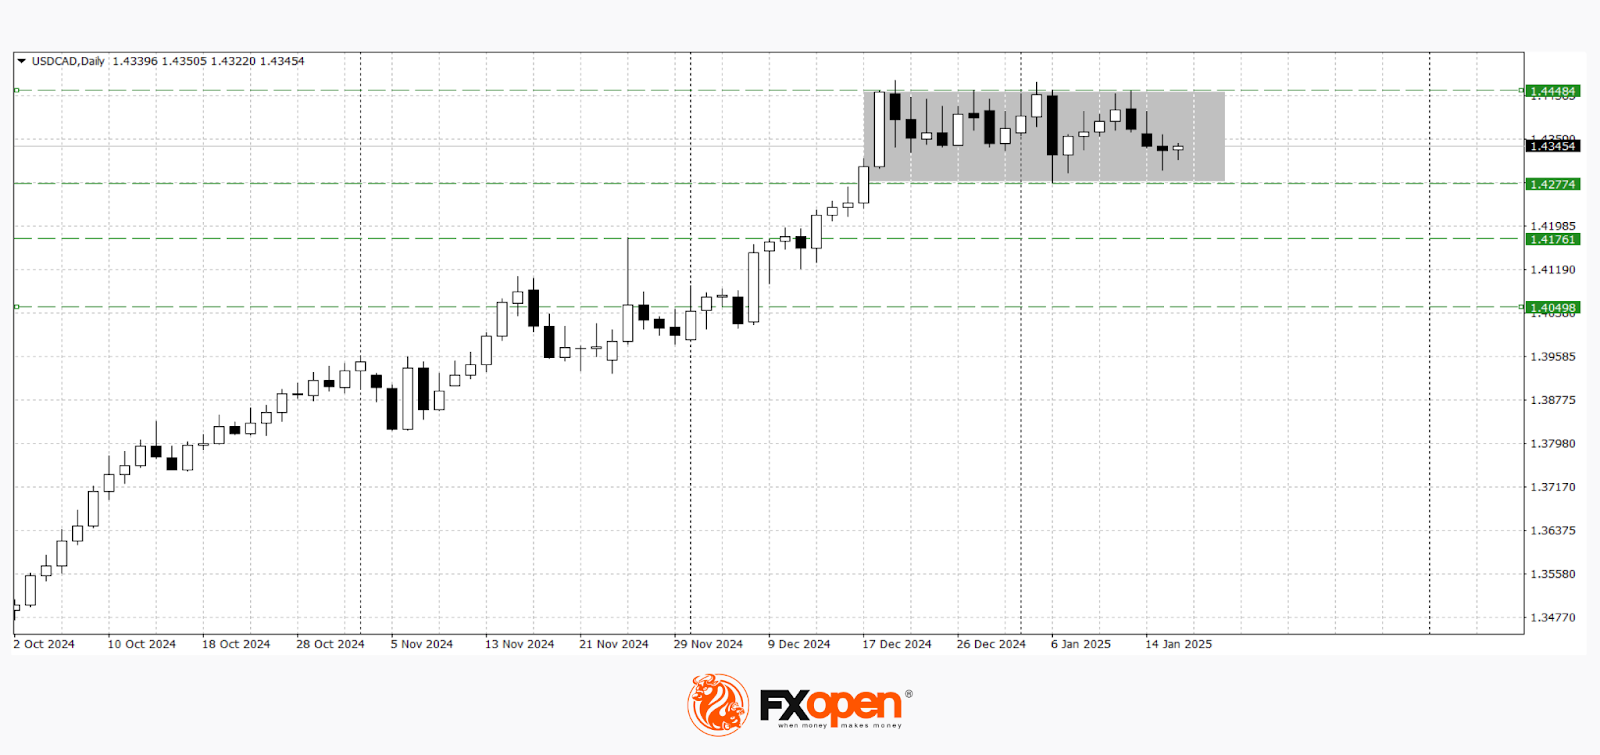
Trade over 50 forex markets 24 hours a day with FXOpen. Take advantage of low commissions, deep liquidity, and spreads from 0.0 pips. Open your FXOpen account now or learn more about trading forex with FXOpen.
This article represents the opinion of the Companies operating under the FXOpen brand only. It is not to be construed as an offer, solicitation, or recommendation with respect to products and services provided by the Companies operating under the FXOpen brand, nor is it to be considered financial advice.