
Sample Category Title
USD/CHF Daily Outlook
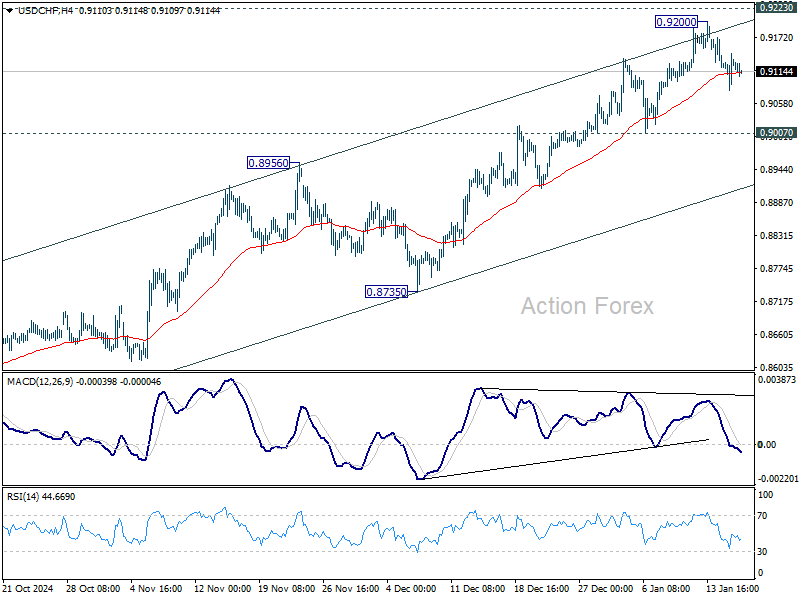
Daily Pivots: (S1) 0.9090; (P) 0.9122; (R1) 0.9158; More…
USD/CHF is staying in consolidation below 0.9200 and intraday bias stays neutral. As long as 0.9007 support holds, near term outlook remains bullish. On the upside, decisive break of 0.9223 will carry larger bullish implications. However, break of 0.9007 will confirm short term topping, and turn bias back to the downside for 55 D EMA (now at 0.8930).
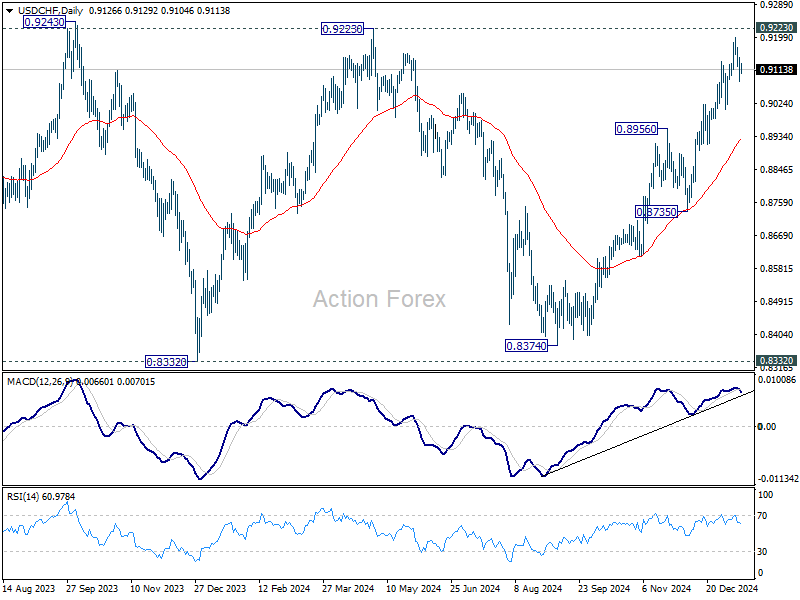
In the bigger picture, price actions from 0.8332 (2023 low) are currently seen as a medium term corrective pattern, with rise from 0.8374 as the third leg. Overall outlook will continue to stay bearish as long as 0.9223 resistance holds. Break of 0.8332 low is in favor at a later stage when the consolidation completes. However, decisive break of 0.9223 will be an important sign of bullish trend reversal.
AUD/USD Daily Report
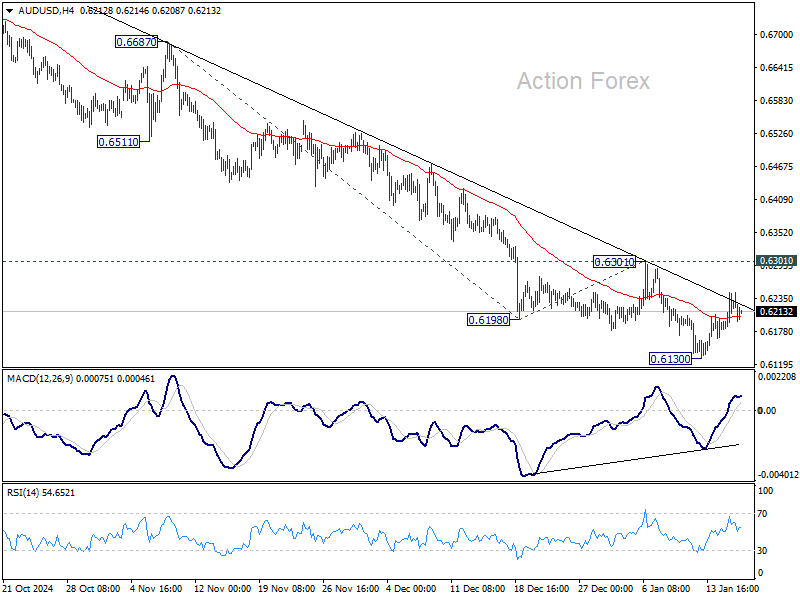
Daily Pivots: (S1) 0.6190; (P) 0.6218; (R1) 0.6256; More...
AUD/USD is staying in consolidation above 0.6130 and intraday bias remains neutral. Further decline is expected as long as 0.6310 resistance holds. Break of 0.6130 will resume the fall from 0.6941 to 61.8% projection of 0.6687 to 0.6198 from 0.6301 at 0.5999. However, considering bullish convergence condition in 4H MACD, break of 0.6310 will indicate short term bottoming, and turn bias back to the upside for stronger rebound.
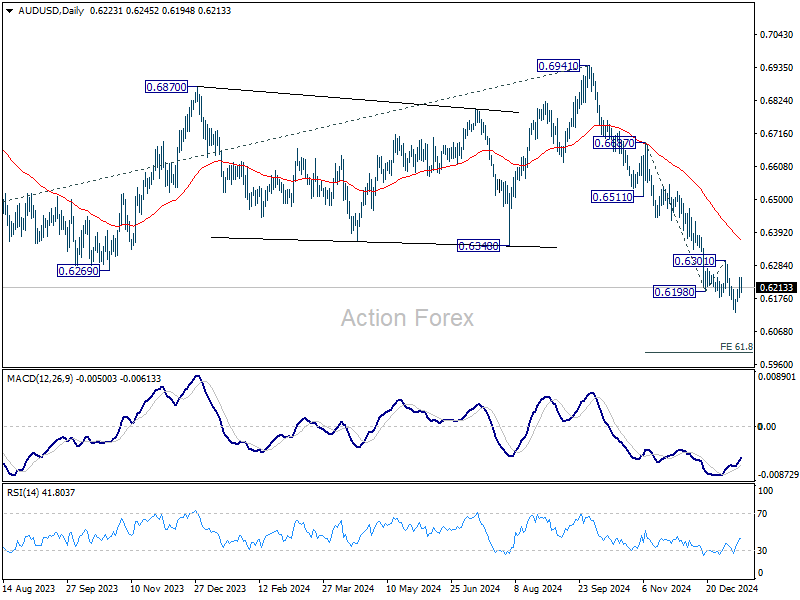
In the bigger picture, down trend from 0.8006 (2021 high) is resuming with break of 0.6169 (2022 low). Next medium term target is 61.8% projection of 0.8006 to 0.6169 from 0.6941 at 0.5806, In any case, outlook will stay bearish as long as 55 W EMA (now at 0.6587) holds.
USD/CAD Daily Outlook
Daily Pivots: (S1) 1.4306; (P) 1.4336; (R1) 1.4371; More...
No change in USD/CAD's outlook as consolidation continues below 1.4466. Intraday bias remains neutral for the moment. Break of 1.4279 support will bring deeper correction. But downside should be contained by 55 D EMA (now at 1.4179) to bring rebound. On the upside, break of 1.4466 will resume larger up trend to 1.4667/89 long term resistance zone.

In the bigger picture, up trend from 1.2005 (2021) is in progress for retesting 1.4667/89 key resistance zone (2020/2015 highs). Medium term outlook will remain bullish as long as 1.3976 resistance turned holds (2022 high), even in case of deep pullback.

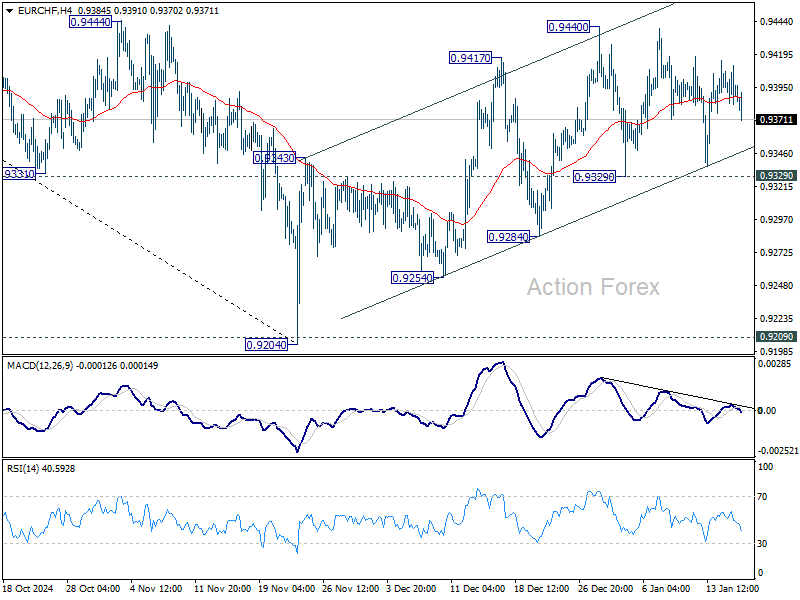
EUR/CHF Daily Outlook
Daily Pivots: (S1) 0.9377; (P) 0.9398; (R1) 0.9412; More....
Intraday bias in EUR/CHF remains neutral and range trading continues. Corrective rebound from 0.9204 could still extend higher. But upside should be limited by 0.9481 fibonacci resistance. On the downside, firm break of 0.9329 support will argue that the correction has completed, and turn bias back to the downside for 0.9284 support first.
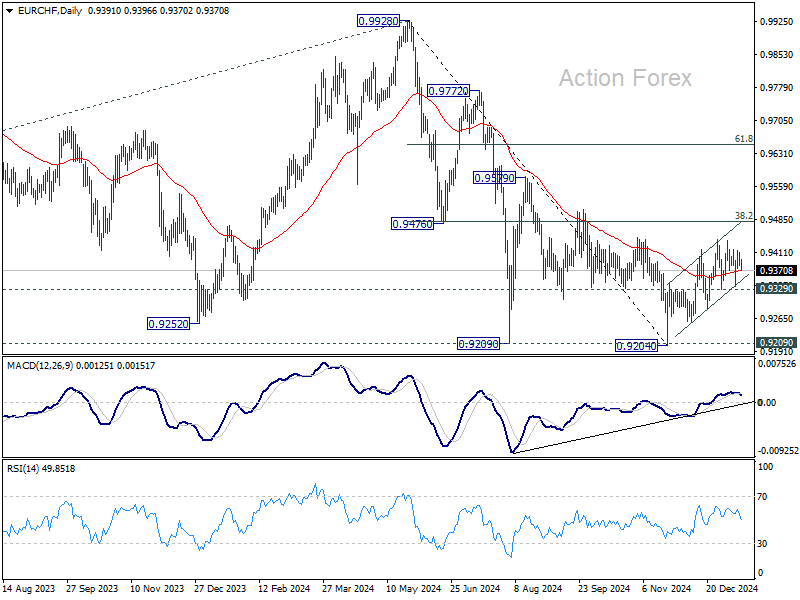
In the bigger picture, while corrective rebound from 0.9204 might extend higher, strong resistance could be seen from 38.2% retracement of 0.9928 to 0.9204 at 0.9481 to limit upside. Down trend from 0.9928 (2024 high) is still in favor to resume through 0.9204/9 support zone at a later stage.
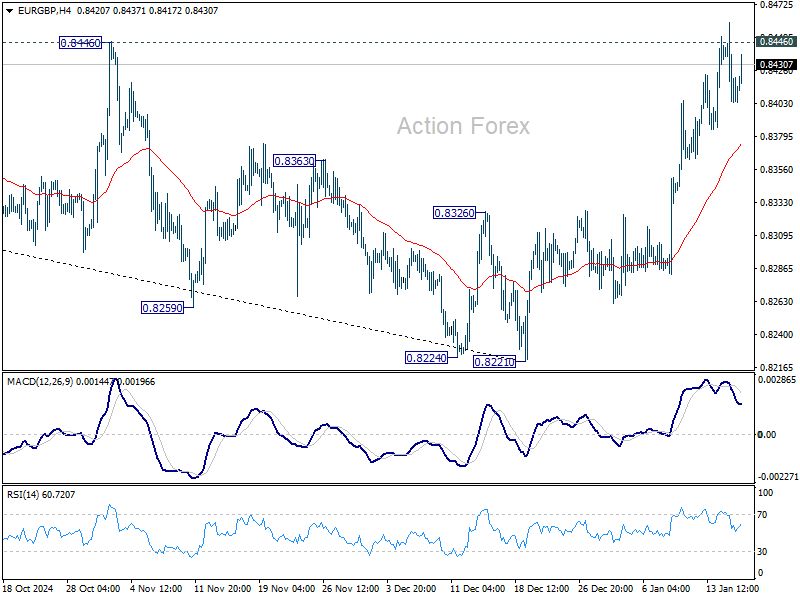
EUR/GBP Daily Outlook
Daily Pivots: (S1) 0.8388; (P) 0.8420; (R1) 0.8436; More...
Intraday bias in EUR/GBP is turned neutral first with the current retreat and with 4H MACD crossed below signal line. Some consolidations would be seen, but further rally is expected as long as 55 4H EMA (now at 0.8374) holds. Firm break of 0.8446 resistance will target 0.8624 cluster resistance zone, even as a corrective move.
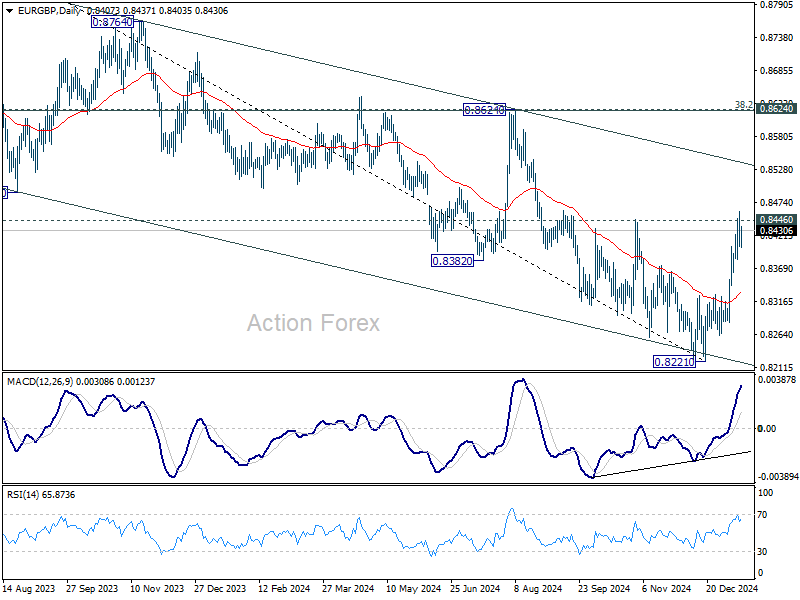
In the bigger picture, considering bullish convergence condition in D MACD, decisive break of 0.8446 resistance and 55 D EMA (now at 0.8446) should confirm medium term bottoming at 0.8221, just ahead of 0.8201 key support (2022 low). Further rally should be seen towards 0.8624 key resistance, even as a correction to the down trend from 0.9267 (2022 high). Overall, however, medium term outlook will be neutral at best until decisive break of 0.8624 cluster zone (38.2% retracement of 0.9267 to 0.8221 at 0.8621). Risk will stay on the downside even in case of strong rebound.
EUR/AUD Daily Outlook
Daily Pivots: (S1) 1.6475; (P) 1.6570; (R1) 1.6620; More...
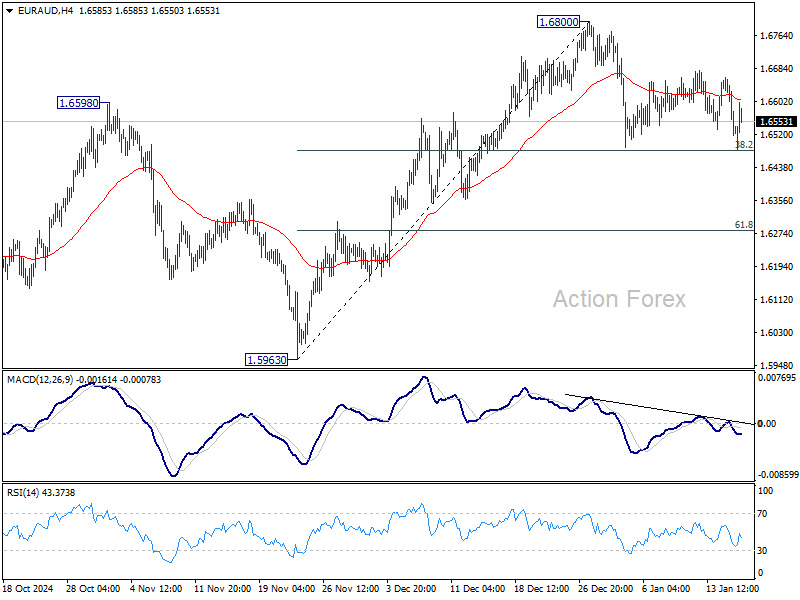
No change in EUR/AUD's outlook as consolidation continues below 1.6800. Strong support is still expected from 38.2% retracement of 1.5963 to 1.6800 at 1.6480 to contain downside. Firm break of 1.6800 will resume the rally from 1.5963. However, sustained break of 1.6480 will bring deeper correction 61.8% retracement at 1.6283.
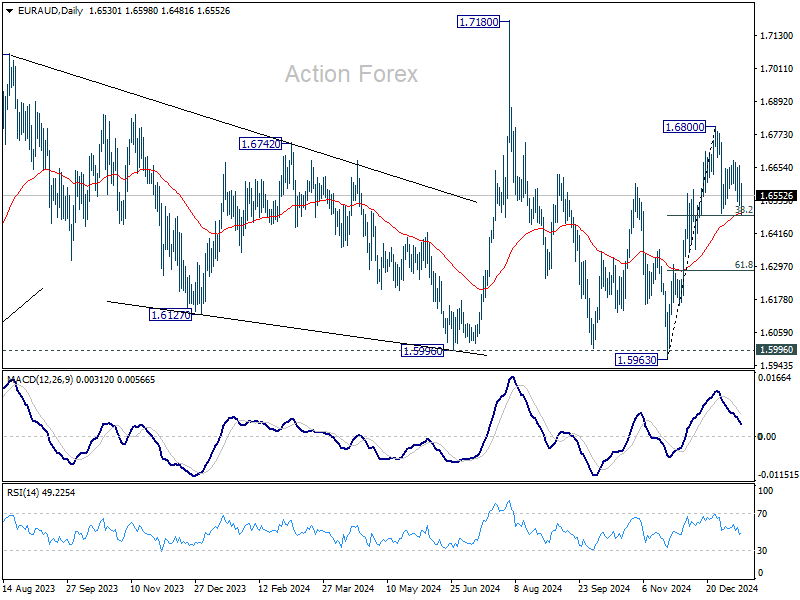
In the bigger picture, EUR/AUD is holding on to 1.5996 key support despite brief breach. Larger up trend from 1.4281 (2022 low) is still in favor to resume through 1.7180 at a later stage. Nevertheless, sustained break of 1.5995 will indicate that such up trend has completed and deeper decline would be seen.
EUR/JPY Daily Outlook
Daily Pivots: (S1) 160.22; (P) 161.59; (R1) 162.38; More...
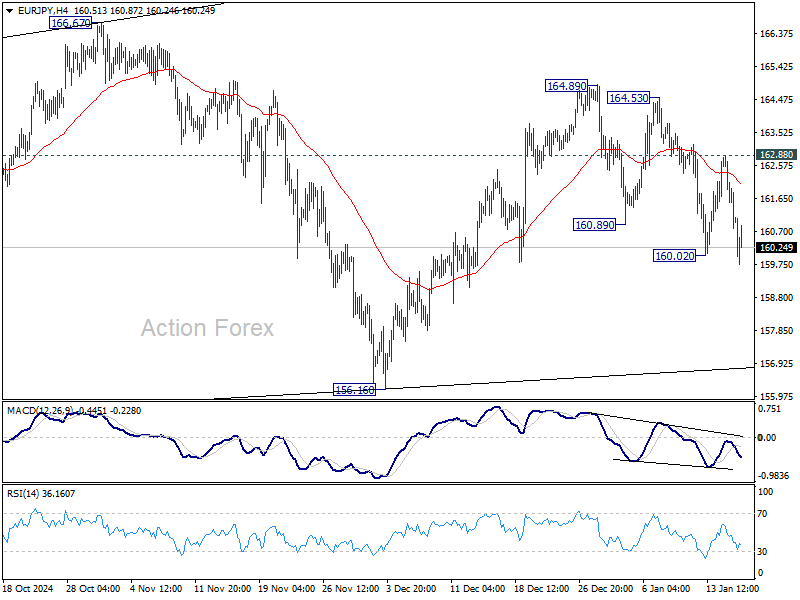
EUR/JPY's fall from 164.89 is resuming through 160.02 temporary low. Intraday bias is back on the downside for 156.16 support next. Firm break there will argue that corrective pattern from 154.40 has completed, and fall from 175.41 is ready to resume. For now, risk will stay on the downside as long as 162.88 resistance holds, in case of recovery.
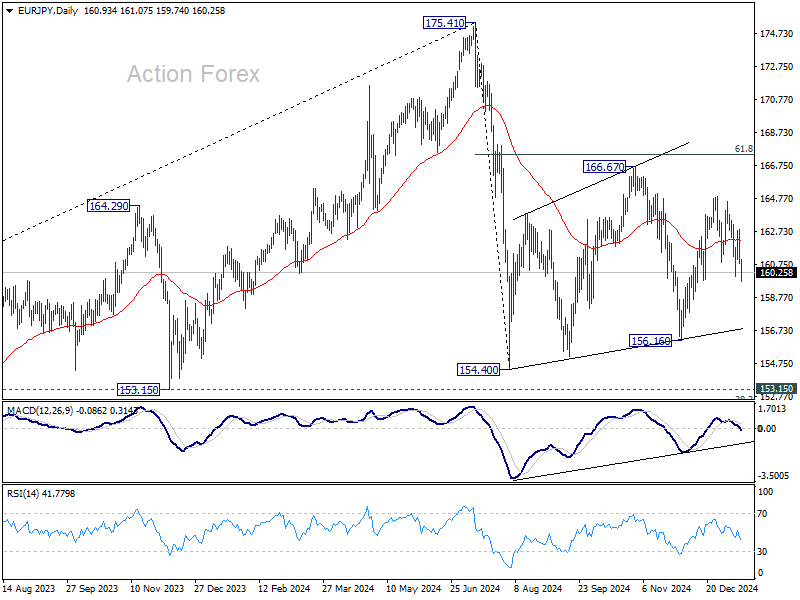
In the bigger picture, price actions from 175.41 are seen as correction to rally from 114.42 (2020 low). The range of consolidation should have been set between 38.2% retracement of 114.42 to 175.41 at 152.11 and 175.41 high. However, decisive break of 152.11 would argue that deeper correction is underway.
S&P 500 Index Rises to Psychological Level
The US stock market experienced an upswing following the release of inflation data yesterday. According to ForexFactory:
→ The annual Consumer Price Index (CPI) matched expectations at 2.9%.
→ The monthly Core CPI came in at 0.2%, below analysts' forecast of 0.3%.
Market participants interpreted this as a positive signal, leading to the S&P 500 index (US SPX 500 mini on FXOpen) gaining over 1% in the first 30 minutes after the data release.
As reported by Reuters:
→ Concerns about inflation eased, reviving hopes for a potential Federal Reserve rate cut, buoyed by a strong start to the earnings season (which we will cover in more detail later);
→ However, the rally may be short-lived, as inflation in the US remains uncomfortably high and could increase further due to aggressive tariff and tax policies under the new Trump administration;
→ Analysts caution that the Federal Reserve's rate is likely to remain unchanged for some time.
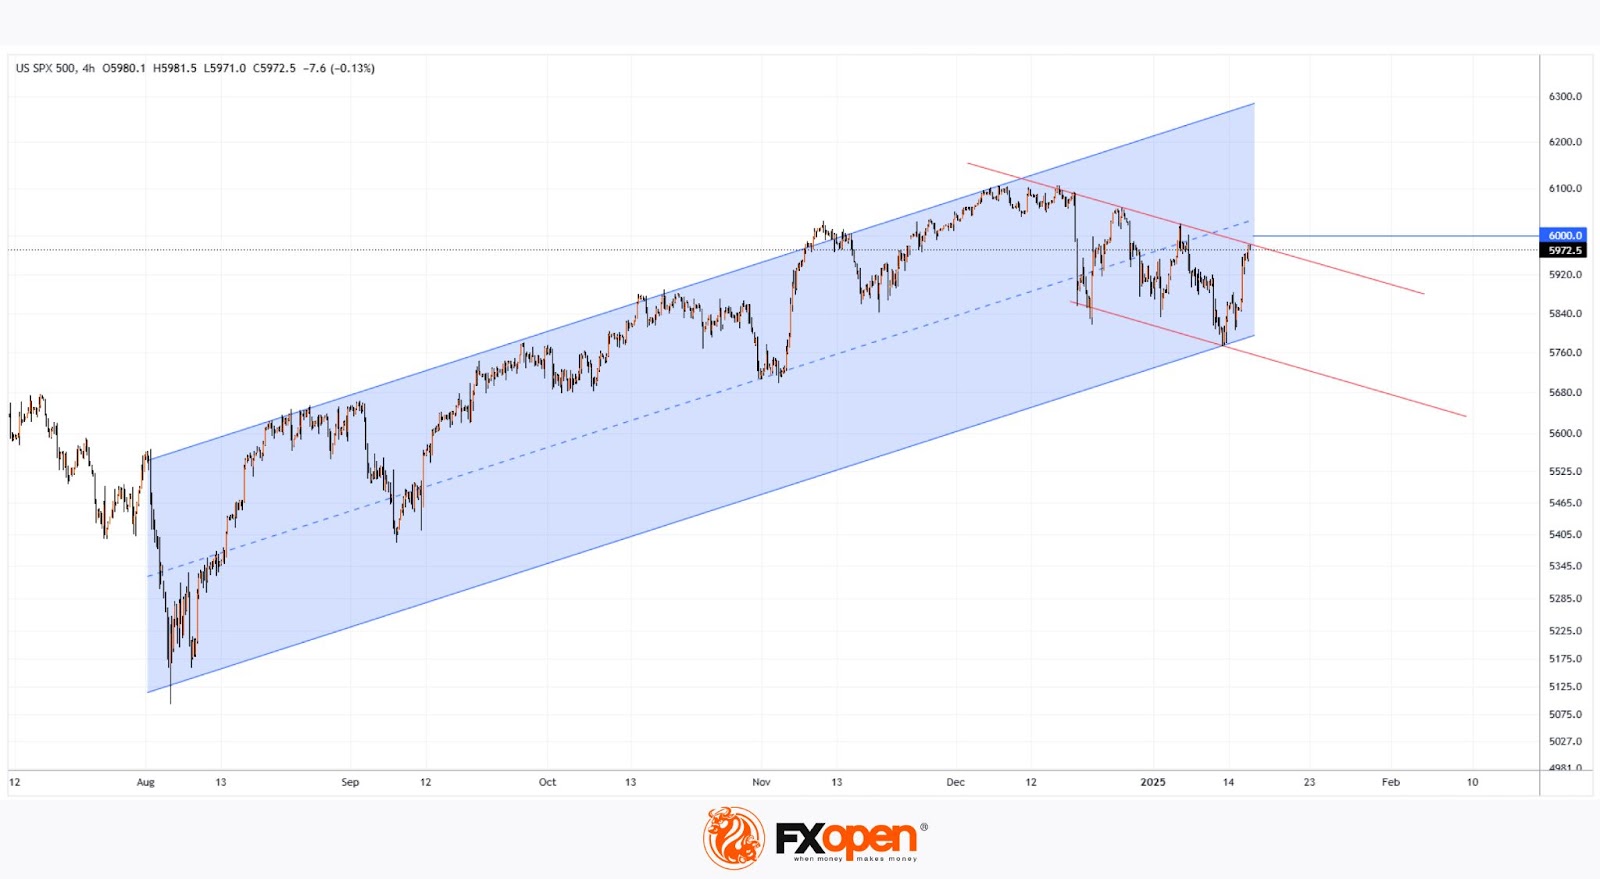
Technical analysis of the S&P 500 index chart (US SPX 500 mini on FXOpen) shows that since early August—when the Japanese stock market crash triggered concerns of a global recession, dragging US equities lower—the price has been in an upward trend, marked by a blue channel. The January mid-month low has provided a more precise point to define the lower boundary of this channel.
From this perspective, traders should note that the current S&P 500 price has reached a resistance zone, which consists of:
→ The median line of the blue channel;
→ The psychological level of 6,000 points;
→ The upper red line, drawn through the local highs of December 2024 and January 2025, suggesting that the decline beginning on 18th December could be viewed as an intermediate correction within the blue ascending channel.
This resistance area may serve as a key test of the bulls' determination to complete the correction and resume the upward trend.
Trade global index CFDs with zero commission and tight spreads. Open your FXOpen account now or learn more about trading index CFDs with FXOpen.
This article represents the opinion of the Companies operating under the FXOpen brand only. It is not to be construed as an offer, solicitation, or recommendation with respect to products and services provided by the Companies operating under the FXOpen brand, nor is it to be considered financial advice.
GBP/JPY Daily Outlook
Daily Pivots: (S1) 190.78; (P) 191.91; (R1) 192.72; More...
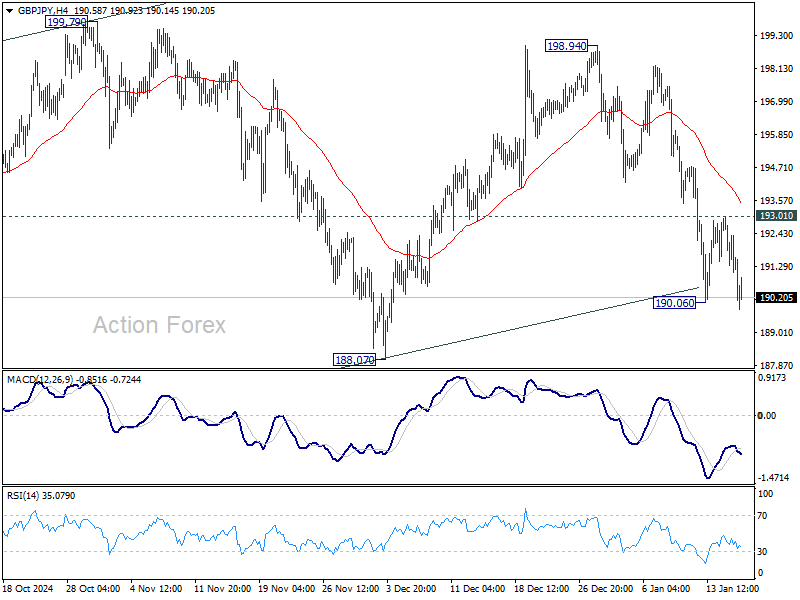
GBP/JPY's breach of 190.06 temporary low suggests that fall from 198.94 is resuming. Intraday bias is back on the downside for 188.07 support. Firm break there will argue that corrective pattern from 180.00 has finished too, and larger decline from 208.09 might be ready to resume. On the upside, above 193.01 resistance will delay the bearish case and turn intraday bias neutral again.
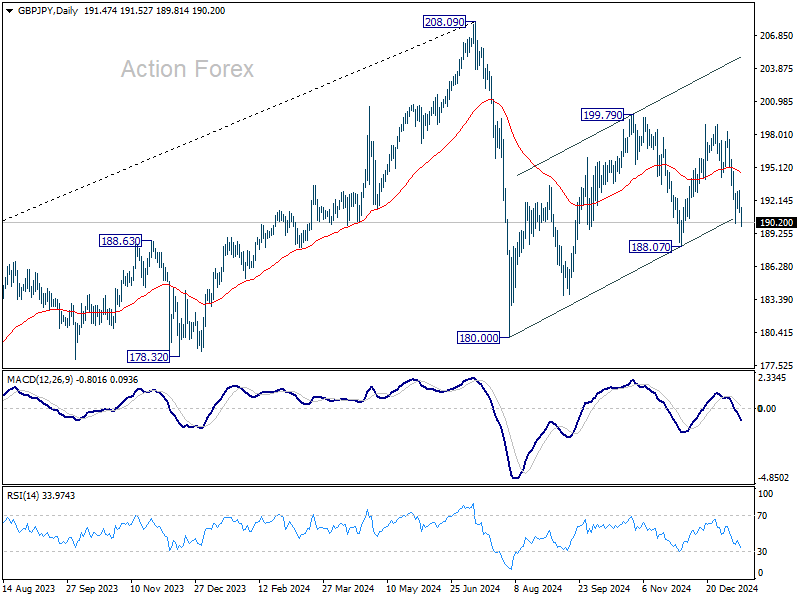
In the bigger picture, price actions from 208.09 are seen as a correction to whole rally from 123.94 (2020 low). The range of consolidation should be set between 38.2% retracement of 123.94 to 208.09 at 175.94 and 208.09. However, decisive break of 175.94 will argue that deeper correction is underway.
BoJ’s Repeated Hawkish Signals Fuel Yen Rebound, Sterling Falters on Stagnant Growth Data
Yen's near term rebound gained momentum again today, supported by BOJ Governor Kazuo Ueda’s persistent messaging about a potential rate hike at next week’s policy meeting. Ueda’s repeated remarks are interpreted as laying the groundwork for markets to brace for a monetary policy shift. While recent polls as of last week indicated only a minority expectation of a January hike, the market are clearly undergoing recalibration. However, the current move in Yen against Dollar remains largely corrective, and a sustained reversal in the broader down trend trend would require further confirmation.
Meanwhile, Sterling continues to face mounting pressure after UK GDP data highlighted stagnation in economic activity. Monthly GDP rose just 0.1% in November, falling short of expectations. More importantly, growth over the three months to November was flat. The data has heightened fears of a contraction in Q4. Adding to Sterling’s challenges, new MPC member Alan Taylor struck a dovish tone in his first public speech, noting that while inflation is nearing its endgame, the weakening economy justifies a return to more “normal” interest rates.
For the week so far, Sterling remains the weakest performer among major currencies, with no signs of a sustainable rebound. Dollar is the second worst, as it continues to consolidate recent gains. . Yesterday’s softer-than-expected core CPI reading alleviated fears of a Fed policy reversal toward tightening, while a resurgence in risk appetite has kept the Dollar’s recovery momentum in check. Canadian Dollar rounds out the bottom three.
On the other hand, Australian Dollar, buoyed by risk-on sentiment. However, the Aussie’s inability to extend its rally following robust employment data raises questions about its underlying strength. Yen is the second-best performer, with the potential to advance further as expectations for a BoJ policy shift solidify. New Zealand Dollar rounds out the top three, while Euro and Swiss Franc are mixed in the middle.
Technically, the US stock markets are back into focus with yesterday's strong rebound. It might be too early to call for resumption of record run in S&P 500. But price actions from 6099.97 are still clearly corrective looking. Downside is also supported above 5669.67 resistance turned support. So, break of 6099.97 remains in favor at a later stage, probably after Trump's inauguration that clear out some uncertainties over his trade policies, as tariff could be raised just gradually to minimize the shocks to the economy.
UK GDP grows only 0.1% mom in Nov, with mixed sector performance
UK’s economy posted modest growth in November, with GDP increasing by 0.1% mom, but slightly missing market expectations of 0.2%. Nevertheless, this marked a positive turnaround from the -0.1% mom contraction in October.
Sectoral performance was mixed, with services, the largest contributor to the economy, inching up by 0.1% mom, while production fell by -0.4% mom. Construction activity, however, provided a brighter spot, rising 0.4% mom during the month.
Despite November’s modest gains, the broader economic picture remains subdued. Over the three months to November 2024, real GDP showed no growth compared to the three months to August. Services, which account for a significant portion of the UK’s output, stagnated over this period. Production output contracted by -0.7%, offsetting the 0.2% growth seen in construction.
BoJ’s Ueda reiterates rate hike debate for next week’s policy meeting
BoJ Governor Kazuo Ueda indicated today, for the second time this week, that the central bank will "debate whether to raise interest rates" at its upcoming January 23-24 policy meeting. This marks the second time in this week that Ueda has emphasized
Ueda’s comments come as BoJ prepares its new quarterly economic report, which will serve as the basis for its policy decision. While the Governor has not committed to a specific outcome, the repeated message signals that a rate hike is a plausible scenario, barring any significant market shocks tied to the January 20 inauguration of U.S. President-elect Donald Trump.
Market sentiment, nevertheless, remains divided on the timing of the anticipated hike. A recent poll conducted between January 8-15 shows that 59 out of 61 economists expect BoJ to raise rates to 0.50% by the end of March. Yet, only 20 foresee the move occurring at this month’s meeting.
Japan's PPI holds steady at 3.8% as import prices turn positive
Japan's PPI held steady at 3.8% yoy in December, meeting market expectations and maintaining the previous month’s pace. Key drivers included a sharp 31.8% yoy rise in agricultural goods prices, fueled by soaring rice costs.
Energy costs also contributed significantly, with electric power, gas, and water prices climbing 12.9% year-on-year. This uptick comes as the government phases out subsidies designed to mitigate rising utility and gasoline prices.
Yen-based import prices turned positive, rising 1.0% yoy after three months of declines. While modest, this reversal underscores the lingering effects of Yen depreciation, which was recorded at -0.1% mom.
Australia’s employment grows 56.3k in Dec, showing continuous resilience
Australia’s labor market displayed resilience in December as employment surged by 56.3k, significantly exceeding expectations of a 15.0k increase. Number of unemployed people also rose by 10.3k, contributing to a slight uptick in the unemployment rate from 3.9% to 4.0%, in line with forecasts.
Participation rate climbed to a record high of 67.1%, up from 67.0%, reflecting an expanding labor force. Additionally, employment-to-population ratio rose by 0.1 percentage point to a new peak of 64.5%, showcasing the labor market’s capacity to absorb more workers. Monthly hours worked increased by 0.5% mom, equivalent to 10 million additional hours.
This data supports the view that the labor market’s earlier signs of easing have stabilized in the second half of 2024. Robust employment growth, consistent levels of average hours worked, and unchanged or lower levels of labor underutilization compared to a year ago affirm the ongoing strength of the job market.
GBP/JPY Daily Outlook
Daily Pivots: (S1) 190.78; (P) 191.91; (R1) 192.72; More...
GBP/JPY's breach of 190.06 temporary low suggests that fall from 198.94 is resuming. Intraday bias is back on the downside for 188.07 support. Firm break there will argue that corrective pattern from 180.00 has finished too, and larger decline from 208.09 might be ready to resume. On the upside, above 193.01 resistance will delay the bearish case and turn intraday bias neutral again.
In the bigger picture, price actions from 208.09 are seen as a correction to whole rally from 123.94 (2020 low). The range of consolidation should be set between 38.2% retracement of 123.94 to 208.09 at 175.94 and 208.09. However, decisive break of 175.94 will argue that deeper correction is underway.