Sample Category Title
AUD/USD: NAB Business Confidence
In a wake of the report showing strong improvement in Australian business confidence, the AUD/USD exchange rate jumped initially. Just after the release, the Aussie appreciated against the US Dollar by 0.06% to be seen trading higher than 0.7925 mark on Tuesday morning. The National Bank of Australia revealed in its July's survey that business conditions rose to the pre-GFC highs, supported by enhancing global environment, while business confidence reached the highest level in nine years. Moreover, strong employment conditions hearten optimism about the outlook of the Australian job market. However, data emphasised resumed divergence between the consumer and business sectors, as retail conditions were sluggish last month.
GBP/USD: Halifax HPI M/M
The Sterling strived to offset post-NFP losses, as Monday's report showed that the UK home prices rose more than anticipated in July. GDP/USD showed almost no reaction to the data, however, later on it posted a gradual fall to the 1.3040 mark, but then went back to the level seen before the release. The Halifax reported that its House Price Index rose 0.4% month-over-month in July, surpassing expectations for a 0.3% increase. However, experts suggested that the UK property market was relatively stagnant or cooling, as the yearly prices growth slowed pace to 2.1% in the reported period. Moreover, the demand for housing would weaken amid slow wage growth and an ongoing shortage of available properties, which is set to boost house prices in the upcoming months.
Foreign Exchange Market Commentary: EUR/USD, USD/JPY, GBP/USD, GOLD, WTI CRUDE, DJIA, FTSE100, DAX
EUR/USD
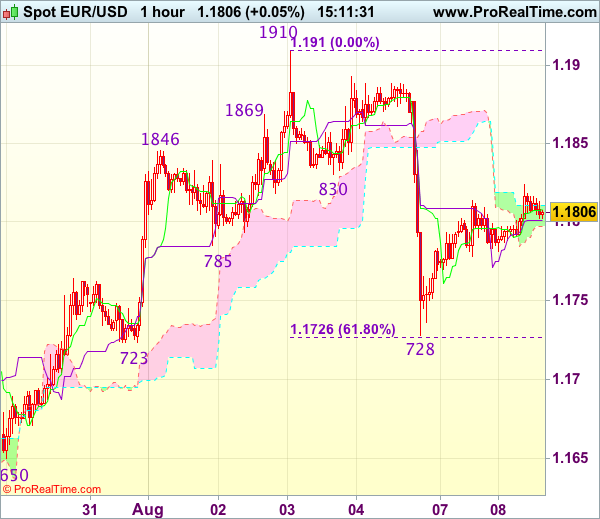
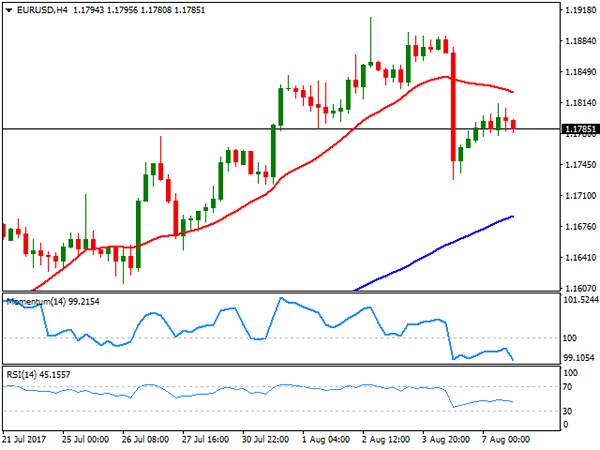
The EUR/USD pair ended Monday pretty much unchanged daily basis, barely a couple of pips above its Friday's close. The common currency saw some limited demand at the beginning of the day, raising up to 1.1807, although unable to extend gains beyond the level as local data released at the beginning of the day was softer-than-expected, with German industrial production down by 1.1% in June, against the 0.2% advance expected, whilst the annual figure came in at 2.4%, well below previous 4.8%. Also, the EU August Sentix confidence index fell to 27.7 from previous 28.3. Dollar gains were limited, by comments from Fed's Bullard, who said that current rates should "remain appropriate over the near term, adding that low jobless rate is no threat to inflation. Whilst market's reaction to the headline was limited, as Bullard is a well-known dove, it reaffirms market's negative stance towards the greenback.
Trading around 1.1785, the 4 hours chart for the EUR/USD pair suggests that the pair can ease further over the next sessions, as the price develops below a modestly bearish 20 SMA, currently around 1.1820, the immediate resistance, whilst technical indicators in the mentioned chart have resumed their declines within negative territory. Too early to consider a top in the pair, the downward move should extend below the 1.1715 support, 2015 yearly high, to be at risk of a steeper downward corrective move after rallying steadily for almost a month.
Support levels: 1.1750 1.1715 1.1680
Resistance levels: 1.1785 1.1820 1.1860
USD/JPY
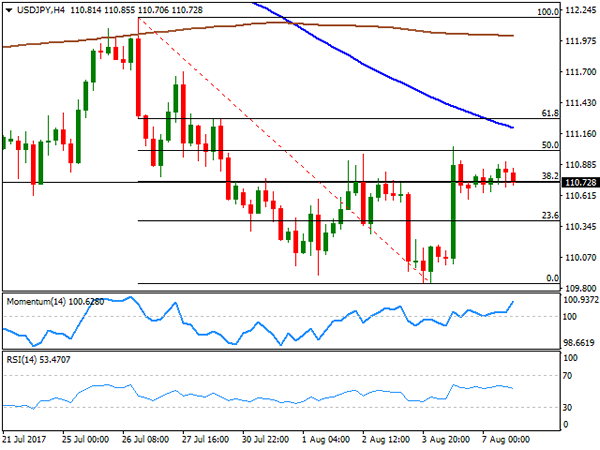
After a modest advance, the USD/JPY pair is back to square one daily basis hovering around the 110.70 price zone. The Japanese yen saw a limited intraday advance amid strength within local equities, as the Nikkei added over 100 points, tracking last Friday's Wall Street gains, also backed by strong local data. According to the official release, the coincident and leading indexes surged to their highest in over three years last June, with preliminary estimates at 117.2 and 106.3 respectively. Early Tuesday, attention will center on June trade figures, as Japan is expected to present a large surplus after a ¥115.1B deficit posted in June. From a technical point of view, the risk remains towards the downside, as the early intraday advance stalled short of the 50% retracement of its latest daily slide around 111.05, the immediate resistance whilst the 100 SMA maintains its sharp bearish slope well above the current level. The Momentum indicator in the mentioned chart continues heading north within positive territory, but the RSI indicator already turned south around 53, this last anticipating some further slides ahead.
Support levels: 110.35 109.85 109.50
Resistance levels: 111.05 111.40 111.85
GBP/USD
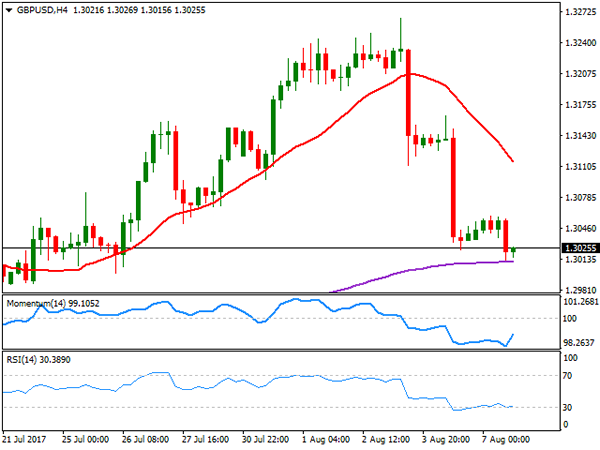
The GBP/USD pair edged lower for third consecutive day, ending the day around 1.3025 after trading as low as 1.3013. News over the weekend showed that the UK IS prepared to pay up to €40 billion as part of a deal to leave the European Union, according to a local newspaper that quoted "sources familiar with the matter," although negotiations have shown little progress over the last few weeks. Uncertainty surrounding Brexit is one of the factors weighing on the pair as noted by the Bank of England last week, when policy makers decided to keep their monetary policy on hold. This Tuesday the UK macroeconomic calendar will remain empty, with the focus on Thursday data, which includes industrial and manufacturing production, the NIESR GDP estimate and the trade balance. In the meantime, the pair remains biased lower, as in the 4 hours chart, the price is pressuring its 200 EMA, around 1.3005 while the 20 SMA extended further lower above the current level. The Momentum indicator aims modestly higher in the mentioned time frame, but the RSI indicator remains flat around 30, this last reflecting limited buying interest around the pair.
Support levels: 1.3000 1.2965 1.2920
Resistance levels: 1.3070 1.3110 1.3150
GOLD
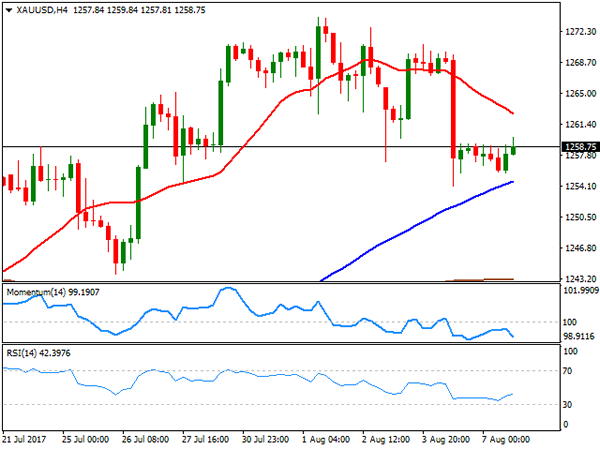
Gold prices remained range bound this Monday, with spot recovering from a daily low of 1,255.69 to end the day pretty much flat at $1,258.75 a troy ounce. The dollar traded firmer against its major rivals, keeping the safe-haven commodity steady near the two- week low posted last Friday. Fed's Bullard comments on rates, however, limited the downside as he said that he is comfortable with current rates, somehow indicating no rush in implementing the third rate hike promised by the Central Bank at the end of 2016. Technically, the daily chart shows that spot met buying interest around a bullish 20 DMA, which heads north a few points above a flat 100 DMA. In the same chart, however, the Momentum indicator extended its decline, now poised to break below its 100 level, whilst the RSI indicator stabilized around 54. In the shorter term, and according to the 4 hours chart, the risk is towards the downside, as the price remains well below a bearish 20 SMA, whilst the Momentum indicators accelerated south within negative territory as the RSI indicator consolidates around 41.
Support levels: 1,254.10 1,245.20 1,235.20
Resistance levels: 1,265.30 1,274.05 1,283.30
WTI CRUDE OIL
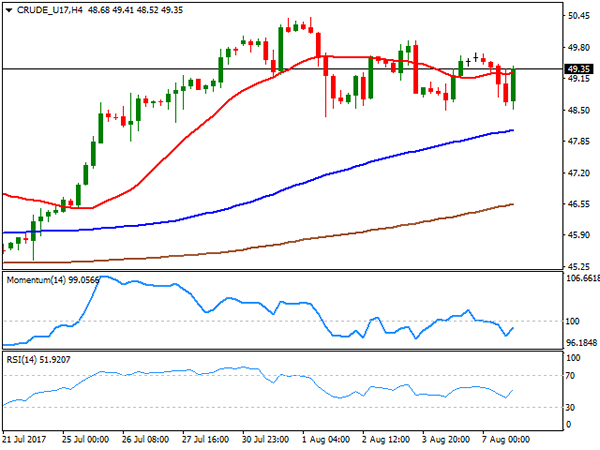
Oil prices edged lower on Monday, but trimmed most of their intraday losses ahead of the close, with West Texas Intermediate crude futures settling at $49.35 a barrel. Major oil producers are is undergoing a two-day meeting in Abu Dhabi, focusing on the compliance level to the output cut pact made last November. Nevertheless, market players will likely wait for US stockpiles data before taking fresh decisions on oil. In the meantime, the daily chart shows that the black gold remains below a flat 200 DMA but above the 20 and 100 DMAs, whilst the Momentum indicator aims north within positive territory, whilst the RSI indicator turned modestly lower, now around 59. In the 4 hours chart, the price is currently struggling with a flat 20 SMA, while technical indicators have turned higher within negative territory, now around their mid-lines, not enough to confirm an upward extension, at this point. The pair presents multiple intraday lows around 48.50, with a break below the level probably opening doors for a steeper decline.
Support levels: 48.50 47.90 47.20
Resistance levels: 49.65 50.20 50.85
DJIA
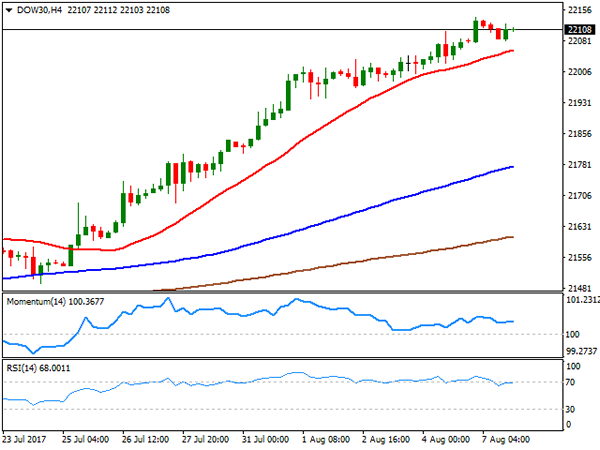
US equities closed modestly higher this Monday, with the Dow posting its ninth consecutive record close, settling at 22,118.42, up daily basis by 25 points. The Nasdaq Composite gained 0.51%, to end at 6,388.77, while the S&P added 4 points, to 2,480.91. Action was limited in the financial world as the NFP dust settled, and investors began the search for the next catalyst. Within the Dow, Apple was the best performer, adding 1.57%, followed by Goldman Sachs that gained 1.25%. United Technologies led decliners with a 2.49% loss, followed by Walt Disney that shed 1.40%. The technical outlook remains positive for the benchmark, as the daily chart for the Dow shows that technical indicators keep advancing despite being in extreme overbought territory, whilst the 20 DMA further advanced below the current level. In the 4 hours chart, technical indicators have turned marginally higher after a period of consolidation within positive territory, whilst the price stands above a bullish 20 SMA, maintaining the risk towards the upside.
Support levels: 22,070 22,023 21,982
Resistance levels: 22,137 22,180 22,225
FTSE100
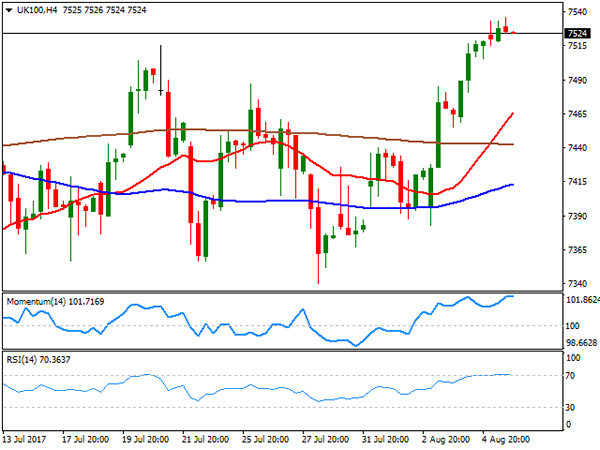
The FTSE 100 added 20 points or 0.27% this Monday to end at 7,531.94 a fresh 2-month high, underpinned by an advance in mining-related equities and a weak Pound. An advance in iron ore prices backed the mining sector, with Anglo American leading the way higher, up 3.11%, followed by Glencore that gained 2.59% and Rio Tinto that closed 2.57% higher. Paddy Power Betfair led decliners, closing 4.67% lower, followed by Pearson that shed 3.81%, with retailers under pressure after Visa said that household spending fell by 0.8% in July within the UK. The daily chart for the index shows that it advanced further above its 20 and 100 DMAs, while technical indicators hold well into positive territory, although losing their bullish strength. In the 4 hours chart, technical indicators have also lost upward strength, but within overbought territory, but the index settled well above a bullish 20 SMA that finally crossed above the 200 SMA, all of which suggesting the advance may continue this Tuesday.
Support levels: 7,487 7,440 7,392
Resistance levels: 7,540 7,572 7,600
DAX
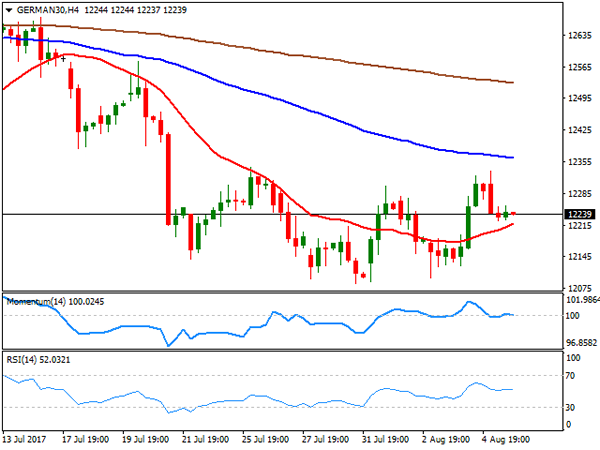
The German DAX closed the day 540 points lower at 12,257.17, as trading within European equities was choppy. Denting German shares were local soft macroeconomic industrial production figures, although gains in banking related equities maintained losses limited. Most members closed lower, with Fresenius being the worst performer, down 1.50%. Deutsche Telekom, on the other hand, led advancers adding 1.43%. Commerzbank added 0.66%, while Deutsche Bank shed 0.62%. From a technical point of view, the index remains biased lower, as an intraday advance met selling interest around a bearish 20 DMA that extended its slide below the 100 DMA, whilst technical indicator have lost their upward momentum within positive territory. In the shorter term, and according to the 4 hours chart, the index remains a few points above a modestly bullish 20 SMA, but below the 100 and 200 SMAs, whilst technical indicators turned flat around their mid-lines, failing to give clear directional clues.
Support levels: 12,210 12,174 12,128
Resistance levels: 12,275 12,323 12,381
USD/CHF Candlesticks and Ichimoku Analysis
Weekly
• Last Candlesticks pattern: Shooting star
• Time of formation: 7 Mar 2017
• Trend bias: Sideways
Daily
• Last Candlesticks pattern: Morning star
• Time of formation: 9 May 2017
• Trend bias: Near term up
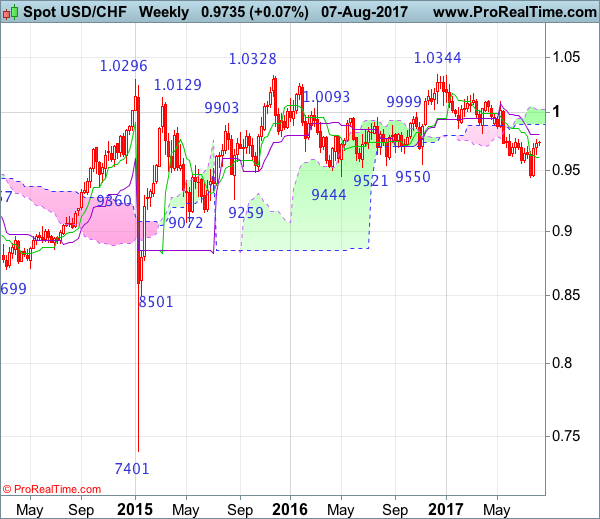
USD/CHF – 0.9731
As the greenback staged a strong rebound after finding good support at 0.9438, suggesting a temporary low has been formed there and consolidation with mild upside bias is seen for test of resistance at 0.9771, however, break of resistance at 0.9808 is needed to add credence to this view, bring retracement of recent decline to 0.9845-50 (61.8% Fibonacci retracement of 1.0100-0.9438), however, near term overbought condition should limit upside to 0.9900-10 and price should falter well below psychological resistance at 1.0000, bring retreat later.
On the downside, whilst initial pullback to 0.9670-75 and possibly the Tenkan-Sen (now at 0.9628) is likely, reckon the Kijun-Sen (now at 0.9602) would limit downside and the greenback shall stage another rebound from there later. Only a drop below support at 0.9490 would abort and signal the rebound from 0.9438 has ended instead, risk retest of this level, once this support is penetrated, this would indicate recent decline from 1.0344 (2016 high) has resumed and extend weakness to 0.9390-00, then towards 0.9330-40.
Recommendation: Buy at 0.9600 for 0.9800 with stop below 0.9500

On the weekly chart, the greenback has edged higher again after forming a long white candlestick, suggesting a temporary low is possibly formed at 0.9438 last month and consolidation with mild upside bias is seen for retracement of recent selloff, hence further gain to 0.9805-08 (current level of the Kijun-Sen and previous resistance) would be seen, above there would add credence to this view, bring correction of recent selloff to 0.9845-50 (61.8% Fibonacci retracement of 1.0100-0.9438) and possibly test of the lower Kumo (now at 0.9894) but price should falter below psychological resistance at 1.0000, bring another decline later.
On the downside, expect pullback to be limited to the Tenkan-Sen (now at 0.9605) and 0.9580 should hold, bring another rise later. Only a drop below support at 0.9490 would abort and suggest the rebound from 0.9438 has ended, bring retest of this level later. Once this recent low is penetrated, this would signal the decline from 1.0344 (2016 high) is still in progress and may extend weakness to 0.9350, then towards 0.9290-00, however, loss of near term downward momentum should prevent sharp fall below 0.9250 and reckon 0.9200-10 would hold from here, risk from there has increased for a rebound later.
Markets In Sleep Mode, VIX Drops Below 10
Despite the S&P 500 and Dow Jones Industrial Average hitting record highs on Monday, the news barely made headlines. I think this could be explained by the scale of the moves. The Dow has traded higher for ten consecutive days, but none of these ten days saw an increase of more than 0.5%. The last time the Dow moved more than 1%, was back in May 17 when the index dropped 1.78%. Similarly, the S&P 500 was moving in a daily range of less than 0.3% for the past 13 trading days, making it the quietest period in decades.
Traders seem to be betting that volatility in stocks will remain low, despite warnings of a potential spike in VIX during the month of August. The CBOE Volatility Index fell below 10 on Monday, as short positions hit a fresh record - leading to stubbornly quiet market conditions.
Foreign exchange markets were no exception, currency pairs such as EURUSD, USDJPY, and GBPUSD were stuck within a 50 pips trading range. Limited news flow is what can be blamed for the narrow trading ranges, but expect this to change as we get closer to Friday's U.S. CPI release.
Friday's jobs report inspired dollar bulls for a limited time only, as investors are still not confident that a third rate hike will occur in 2017. According to CME's FedWatch, markets still believe that a rate hike in December is not a done deal. St. Louis Fed, President James Bullard, seems to agree, as he is not confident that current unemployment rate will be enough to push inflation towards the Fed target of 2%, and believes that interest rates should remain where they are for now. For this perception to change, it requires inflation to accelerate, after declining for five straight months. New York Fed President William Dudley is set to speak on Thursday, and he may oppose his colleague's thoughts; knowing that he had been more on the hawkish side. However, dollar bulls still need hard data before jumping in.
EURUSD is likely to be the most interesting currency pair in the weeks to come. European officials might start getting worried after the most recent surge in the single currency. German exports declined 2.8% in June, the sharpest fall in almost two years. Imports fell even more sharply, by 4.5% - the biggest drop since 2009. These figures came from data released on Monday, showing German industrial output declined by 1.1% in June - its biggest drop so far in 2017. However, the Euro remained resilient and continued to trade above 1.18. One set of data is probably not enough to drag down the Euro, but if negative implications continue to reflect in economic data, the Euro is likely to be pulled below 1.17.
Forex Technical Analysis: EUR/USD, USD/JPY, GBP/USD
EUR/USD
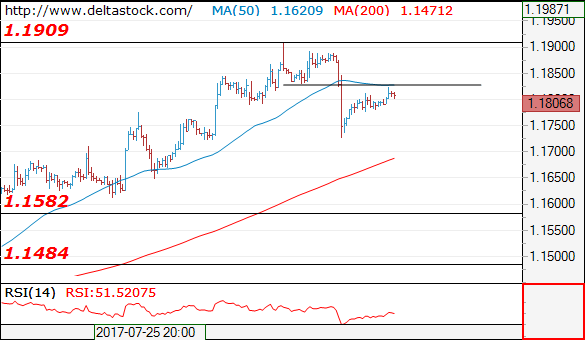
Current level - 1.1806
The rebound above 1.1730 is corrective and while 1.1825 resistance holds, the bias will remain bearish, for a dive towards 1.1580.
| Resistance | Support | ||
| intraday | intraweek | intraday | intraweek |
| 1.1825 | 1.2000 | 1.1650 | 1.1580 |
| 1.1909 | 1.2240 | 1.1580 | 1.1480 |
USD/JPY
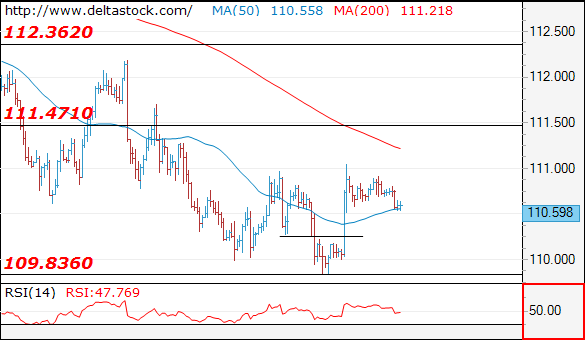
Current level - 110.59
My outlook remains positive above 110.30 area, for a rise towards 111.50 zone.
| Resistance | Support | ||
| intraday | intraweek | intraday | intraweek |
| 111.00 | 112.20 | 110.20 | 109.80 |
| 111.50 | 114.50 | 109.80 | 108.10 |
GBP/USD
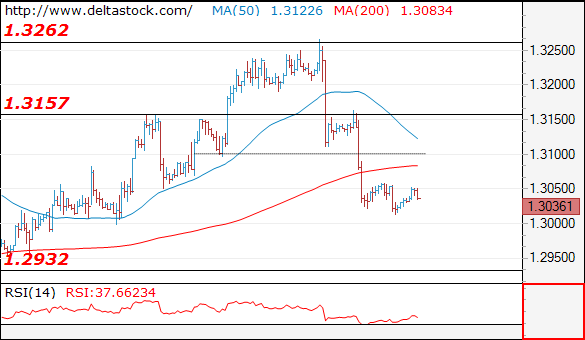
Current level - 1.3036
The downtrend is still intact and with the initial resistance at 1.3050 the outlook is bearish, for a slide towards 1.2930.
| Resistance | Support | ||
| intraday | intraweek | intraday | intraweek |
| 1.3050 | 1.3260 | 1.3000 | 1.2930 |
| 1.3100 | 1.3500 | 1.2930 | 1.2810 |
Trade Idea : USD/CHF – Buy at 0.9685
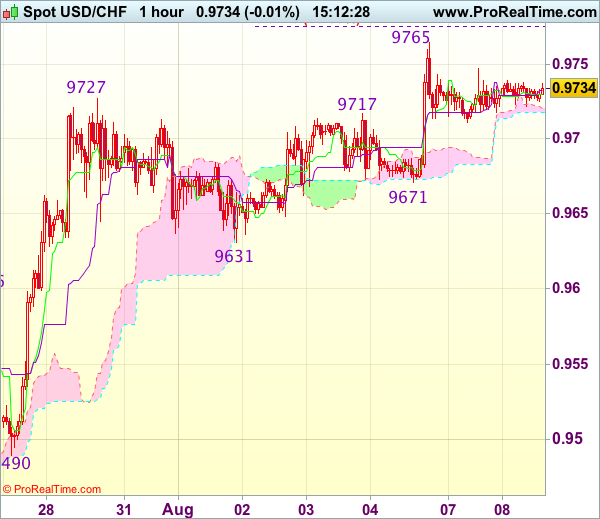
USD/CHF - 0.9729
Most recent candlesticks pattern : N/A
Trend : Near term up
Tenkan-Sen level : 0.9730
Kijun-Sen level : 0.9733
Ichimoku cloud top : 0.9721
Ichimoku cloud bottom : 0.9718
Original strategy :
Buy at 0.9685, Target: 0.9785, Stop: 0.9650
Position : -
Target : -
Stop : -
New strategy :
Buy at 0.9685, Target: 0.9785, Stop: 0.9650
Position : -
Target : -
Stop : -
The greenback has traded narrowly since yesterday, retaining our view that consolidation below Friday’s high at 0.9765 would be seen, however, reckon downside would be limited to support at 0.9671 and bring another rise later, above said resistance at 0.9765 would signal recent upmove is still in progress, then further gain to 0.9775 (50% projection of 0.9438-0.9727 measuring from 0.9631) and later 0.9800-10 (61.8% projection) would follow but 0.9830-40 would hold from here, bring another retreat later.
In view of this, would not chase this rise here and would be prudent to buy dollar on pullback as 0.9680-85 should limit downside. Below 0.9671 support would defer and suggest top is possibly formed, risk test of support at 0.9631 but break there is needed to add credence to this view, bring retracement of recent rise to 0.9596 (previous resistance turned support).
Dollar Weakens In Wake Of US Inflation, Euro Strengthens And Oil Pressured
Chinese economic data dominated today's Asian session as dollar traders await key consumer prices figures for July due on Friday. The dollar index gave up on some of the strong gains from Friday to last trade at 93.36. The euro was up against the greenback, trading above the 1.1800 handle.
Disappointing trade data out of China got some investors worried about a slowdown in the global economy. Annually, exports from the mainland grew 7.2% in July, slowing down from 11.3% in June and coming below 10.9% economists predicted. The pace of imports (at 11.0%) was stronger due to a pick-up in domestic demand, but also came in below expectations of 16.6% and prior months. This is the slowest gain in imports since January of this year. By contrast, figures pointing to strong forex reserves in China propelled the yuan to a 10-month high against the greenback (6.70 yuan per dollar). The country's foreign reserves grew twice the expected amount last month as a result of tighter regulation and a weaker dollar that curbed capital outflows.
Other key economic releases will come out of the US later in the session when the Labor Statistics releases the JOLTs report concerning the number of job openings in June. Economists are expecting the figure to rise to 5.78 million, up from 5.67 million in May. This report comes out ahead of the key producer price index due on Thursday and inflation due on Friday. Market participants are eager to understand the latest trend in consumer prices as a signal for future Federal Reserve interest rate hikes. Fed funds futures are at the moment giving the highest chance of another rate hike (around 50%) this year for the meeting in December.
The dollar index, which tracks the greenback's strength against a basket of six major rivals, weakened modestly to last trade at 93.36. Dollar/yen was down to last trade at 110.60, euro/dollar was up at 1.1803 while pound/dollar was flat at 1.3033 ahead of European trading.
The kiwi was among the few currencies to weaken against its US counterpart in today's forex market. Kiwi/dollar slipped to its lowest in three weeks ahead of the Reserve Bank of New Zealand meeting on Thursday. Many investors are predicting the central bank will become more dovish considering the soggy inflation numbers. Kiwi/dollar was last trading at 0.7355.
Out of Europe, Germany posted another set of disappointing figures, following yesterday's industrial output data. German monthly exports (down 2.8% versus the expectations of a 0.3% decline) and imports (down 4.5% against a 0.2% gain) fared much worse than estimated in June. The euro weakened slightly in the wake of this release, but still remained above the 1.1800 handle.
Oil prices have been pressured in the wake of OPEC and non-OPEC officials meeting in Abu Dhabi to lift compliance of participating members in a deal to cut oil supply. The downward trend in oil prices started last week when data showed OPEC exports hit a 2017 high in July. WTI was last trading at $49.31 a barrel, while Brent was at $52.27 ahead of European trading.
Gold, which is inversely related to the US dollar, has been rising today. The precious metal last traded just under the $1,260 level.
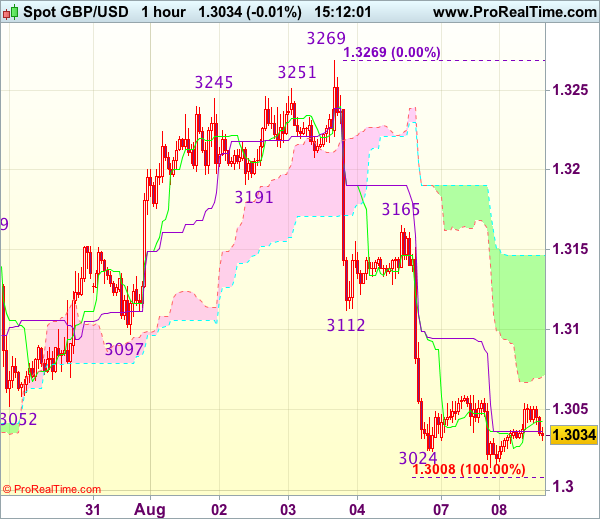
Trade Idea : GBP/USD – Sell at 1.3110
GBP/USD - 1.3045
Most recent candlesticks pattern : N/A
Trend : Near term down
Tenkan-Sen level : 1.3043
Kijun-Sen level : 1.3037
Ichimoku cloud top : 1.3147
Ichimoku cloud bottom : 1.3071
Original strategy :
Sell at 1.3110, Target: 1.3010, Stop: 1.3145
Position : -
Target : -
Stop : -
New strategy :
Sell at 1.3110, Target: 1.3010, Stop: 1.3145
Position : -
Target : -
Stop : -
As cable has recovered after marginal fall to 1.3014 yesterday, suggesting consolidation above this level would be seen and test of the lower Kumo (now at 1.3071) cannot be ruled out, however, reckon upside would be limited and previous support at 1.3112 should turn into resistance, renewed selling interest should emerge there and bring another decline later to 1.3005-10 (100% projection of 1.3269-1.3112 measuring from 1.3165) but a break below support at 1.2999 is needed to retain bearishness, then subsequent fall to 1.2986 (61.8% Fibonacci retracement of 1.2812-1.3269) and possibly 1.2955-60 would follow.
In view of this, we are looking to sell cable on recovery as previous support at 1.3112 should limit upside. Above the upper Kumo (now at 1.3147) would risk test of resistance at 1.3165 but only break above there would signal low is formed instead, bring a stronger rebound to 1.3200 but upside should be limited to 1.3240-50 and price should falter below said resistance at 1.3269.
Trade Idea : EUR/USD – Sell at 1.1840
EUR/USD - 1.1815
Most recent candlesticks pattern : N/A
Trend : Near term up
Tenkan-Sen level : 1.1808
Kijun-Sen level : 1.1801
Ichimoku cloud top : 1.1811
Ichimoku cloud bottom : 1.1797
Original strategy :
Sell at 1.1830, Target: 1.1730, Stop: 1.1865
Position : -
Target : -
Stop : -
New strategy :
Sell at 1.1840, Target: 1.1740, Stop: 1.1875
Position : -
Target : -
Stop : -
As the single currency edged higher after brief pullback, suggesting near term upside risk remains for the rebound from 1.1728 to extend gain to previous support at 1.1830, however, if our view that top has been formed at 1.1910 is correct, upside should be limited to 1.1850 and bring retreat later, below .1775-0 would suggest an intra-day top is formed, bring weakness to 1.1750, then retest of 1.1723-28 (previous support as well as 61.8% Fibonacci retracement of 1.1613-1.1910), break there would add credence to our view that top has been formed at 1.1910 last week, bring further fall to 1.1700 but reckon support at 1.1650 would remain intact.
In view of this, we are looking to sell euro again on further recovery as 1.1830 previous support should limit upside. Above 1.1855-60 would defer and risk a stronger rebound to 1.1875-80 but price should falter below said last week’s high at 1.1910, bring another decline later.