Sample Category Title
GBP/JPY Daily Outlook
Daily Pivots: (S1) 192.60; (P) 193.80; (R1) 194.66; More...
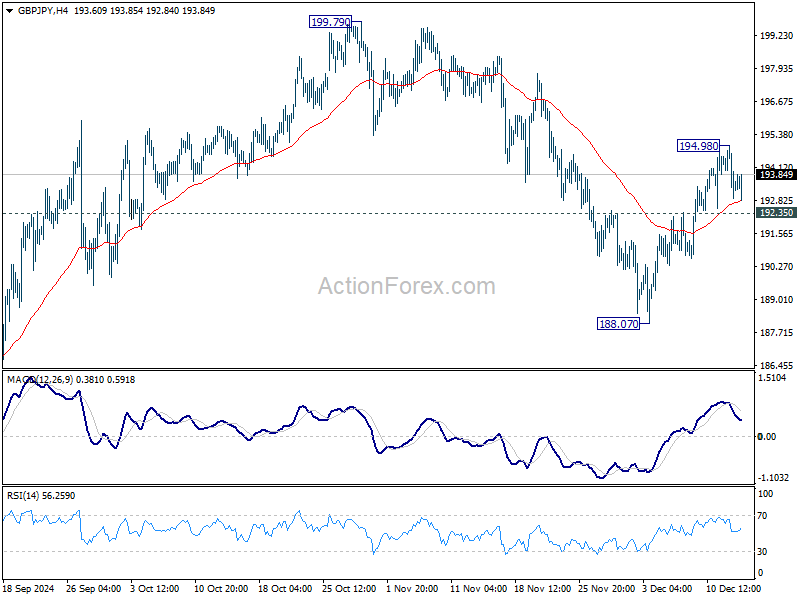
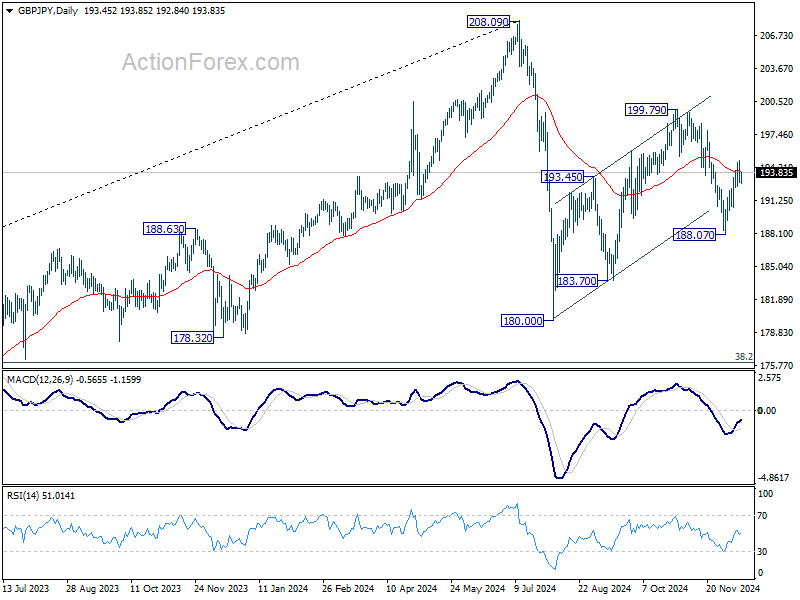
Intraday bias in GBP/JPY is turned neutral again with current retreat. On the downside, break of 192.35 minor support will bring deeper fall to 188.07. Firm break there will revive the bearish case that whole corrective rise from 180.00 has completed with three waves up to 199.79. On the upside, above 194.98 will resume the rebound towards 199.79 resistance.
In the bigger picture, price actions from 208.09 are seen as a correction to whole rally from 123.94 (2020 low). The range of consolidation should be set between 38.2% retracement of 123.94 to 208.09 at 175.94 and 208.09. However, decisive break of 175.94 will argue that deeper correction is underway.
EUR/JPY Daily Outlook
Daily Pivots: (S1) 159.08; (P) 159.81; (R1) 160.52; More...
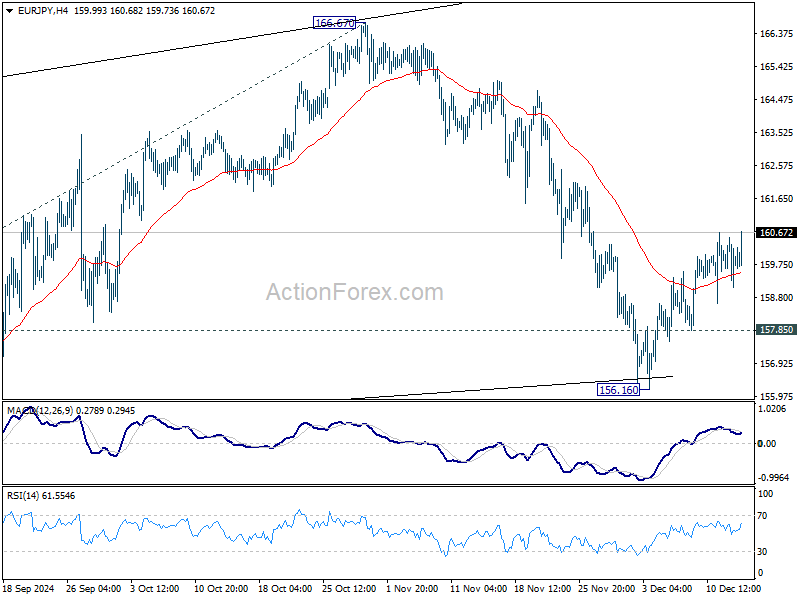
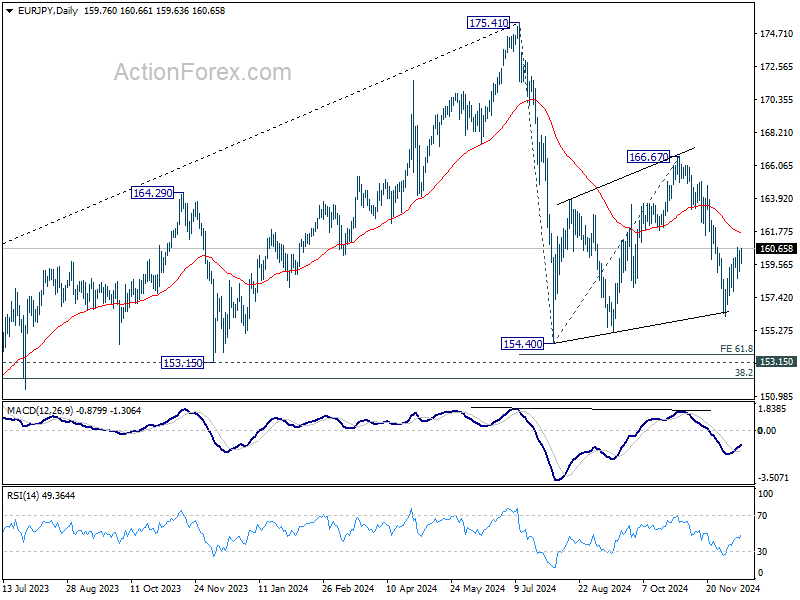
No change in EUR/JPY's outlook. While rebound from 156.16 might extend higher, it's still seen as a corrective rise. Further decline is expected as long as 55 D EMA (now at 161.65) holds. On the downside, below 157.85 minor support will bring retest of 156.16 first. Break there will target 154.40 low next.
In the bigger picture, price actions from 175.41 are seen as correction to rally from 114.42 (2020 low). The range of consolidation should have been set between 38.2% retracement of 114.42 to 175.41 at 152.11 and 175.41 high. However, decisive break of 152.11 would argue that deeper correction is underway.
EUR/GBP Daily Outlook
Daily Pivots: (S1) 0.8233; (P) 0.8253; (R1) 0.8279; More...
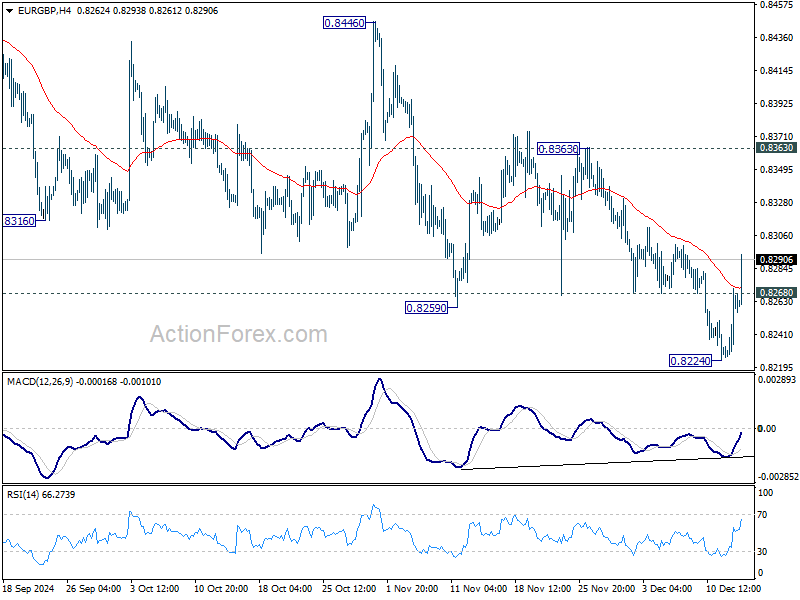
EUR/GBP rebounded strongly ahead of 0.8201 support. Considering the strong momentum, intraday bias is back on the upside for 0.8363 resistance. Decisive break there will be suggest near term bullish reversal and target 0.8446 resistance and above. In case of another decline through 0.8224, focus will be on bottoming sign as it approaches 0.8201 again.
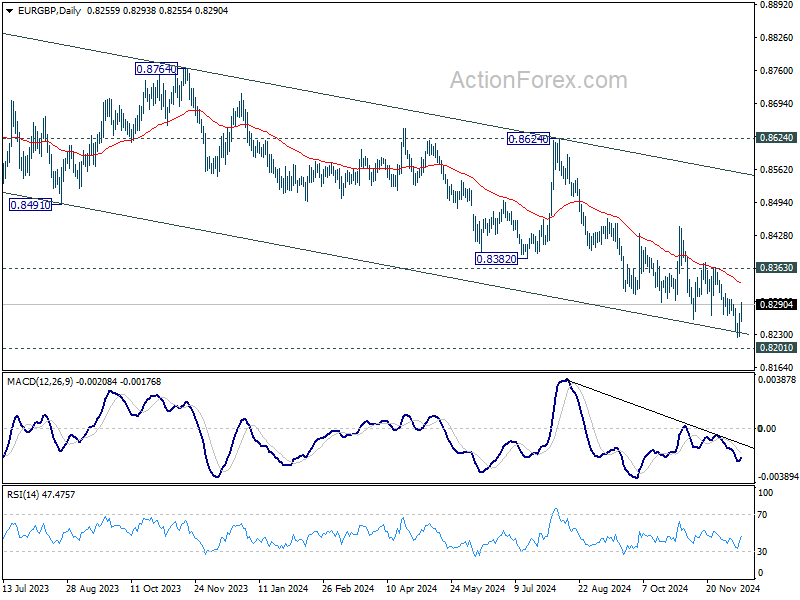
In the bigger picture, down trend from 0.9267 (2022 high) is in progress. Next target is 0.8201 (2022 low), but strong support should be seen there to bring rebound. However, outlook will remain bearish as long as 0.8624 resistance holds even in case of strong rebound. Decisive break of 0.8201 will indicate long term bearish reversal.
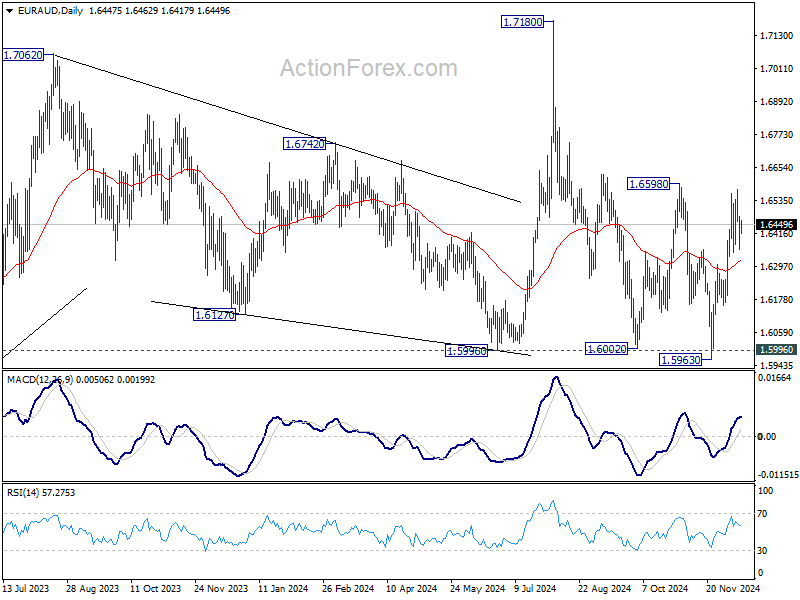
EUR/AUD Daily Outlook
Daily Pivots: (S1) 1.6368; (P) 1.6429; (R1) 1.6496; More...
Intraday bias in EUR/AUD stays neutral and more consolidations could be seen. But further rally remains in favor as long as 1.6349 support holds. On the upside, decisive break of 1.6598 resistance should confirm that whole fall from 1.7180 has complete with three waves down to 1.5963. Further rise should then be seen to retest 1.7180 next. Nevertheless, firm break of 1.6359 will indicate rejection by 16598, and turn bias back to the downside.
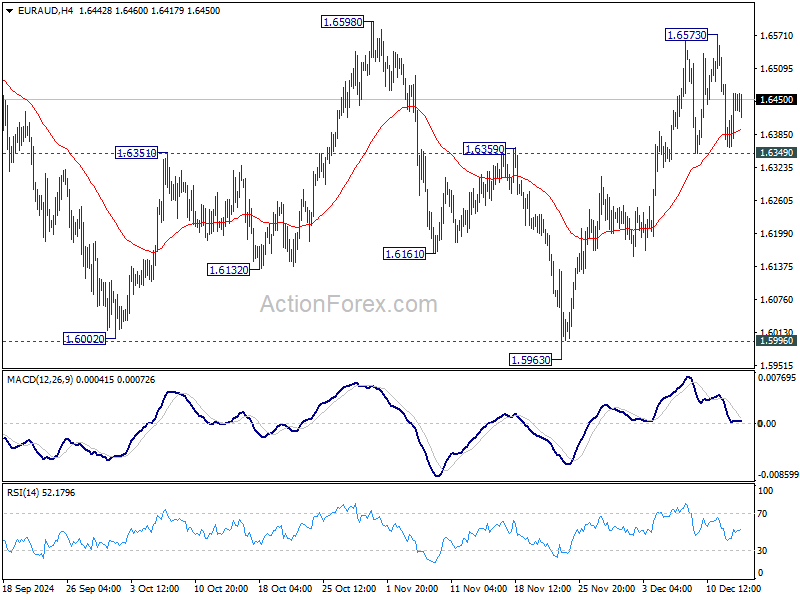
In the bigger picture, EUR/AUD is still holding on to 1.5996 key support despite brief breach. Larger up trend from 1.4281 (2022 low) is still in favor to resume through 1.7180 at a later stage. Nevertheless, sustained break of 1.5995 will indicate that such up trend has completed. Deeper decline would be seen to 61.8% retracement of 1.4281 to 1.7180 at 1.5388, even as a correction.
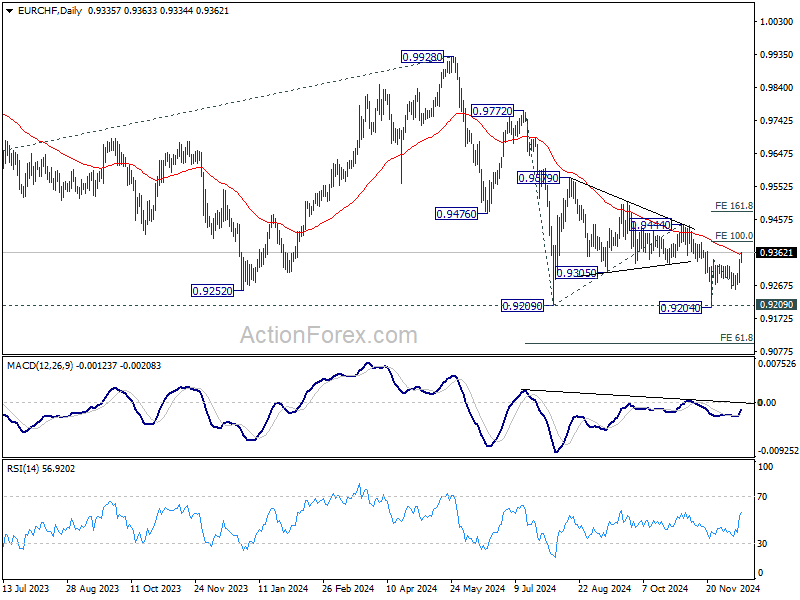
EUR/CHF Daily Outlook
Daily Pivots: (S1) 0.9293; (P) 0.9318; (R1) 0.9366; More....
EUR/CHF's break of 0.9343 resistance confirms resumption of rebound from 0.9204. Intraday bias stays on the upside for 100% projection of 0.9204 to 0.9343 from 0.9254 at 0.9393. Firm break there could prompt upside acceleration to 0.9444 resistance next. On the downside, below 0.9329 minor support will turn intraday bias neutral again first.
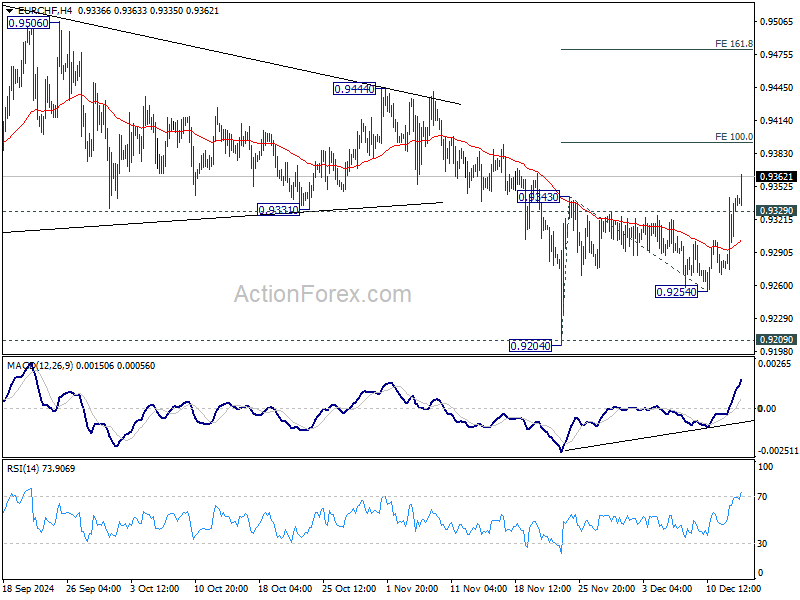
In the bigger picture, outlook will stay bearish as long as 0.9444 resistance holds. Decisive break of 0.9209 low will resume long term down trend to 61.8% projection of 0.9772 to 0.9209 from 0.9444 at 0.9096 next. Nevertheless, firm break of 0.9444 will be the first sign of bullish trend reversal.
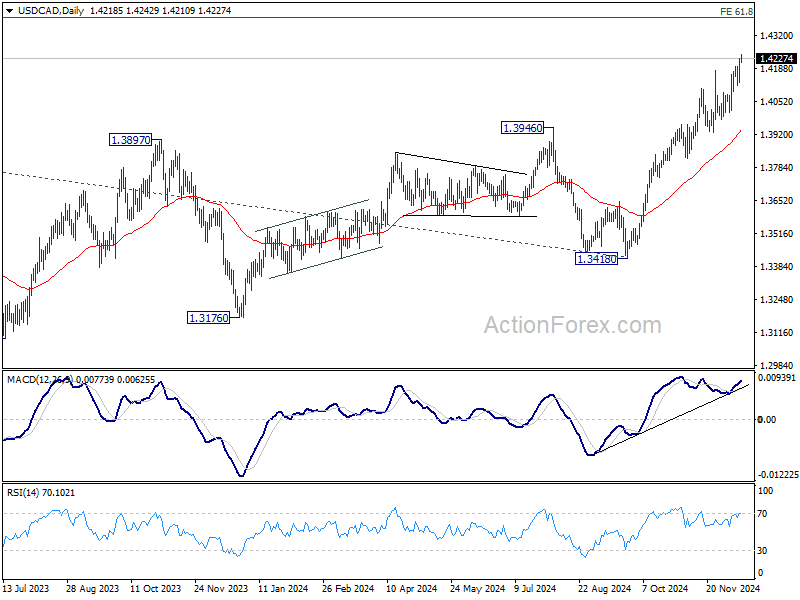
USD/CAD Daily Outlook
Daily Pivots: (S1) 1.4159; (P) 1.4194; (R1) 1.4256; More...
USD/CAD's rally resumed after brief consolidations and intraday bias is back on the upside. Current rise is part of the larger up trend and should target 1.4391 projection level. On the downside, below 1.4119 support will turn intraday bias neutral again and bring consolidations again, before staging another rally.
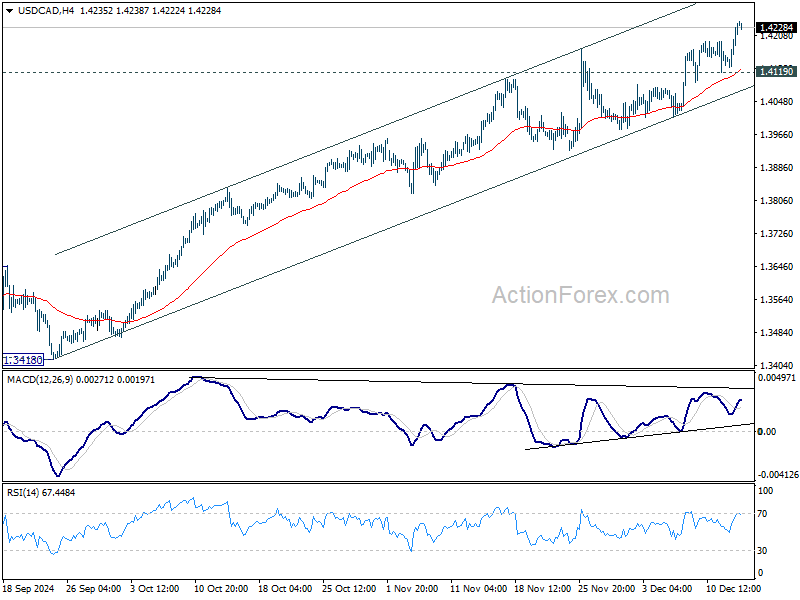
In the bigger picture, up trend from 1.2005 (2021) is in progress. Next target is 61.8% projection of 1.2401 to 1.3976 from 1.3418 at 1.4391. Now, medium term outlook will remain bullish as long as 1.3418 support holds, even in case of deep pullback.
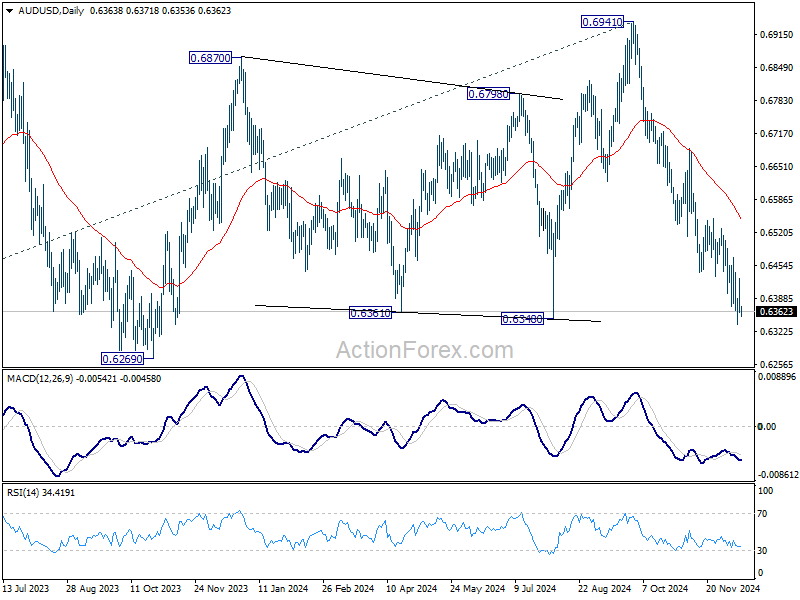
AUD/USD Daily Report
Daily Pivots: (S1) 0.6343; (P) 0.6386; (R1) 0.6411; More...
Intraday bias in AUD/USD remains neutral as consolidation continues above 0.6336 temporary low. While another recovery cannot be ruled out, outlook will stay bearish as long as 55 D EMA (now at 0.6546) holds. Break of 0.6336 will resume the fall from 0.6941 to 0.6269 support next.
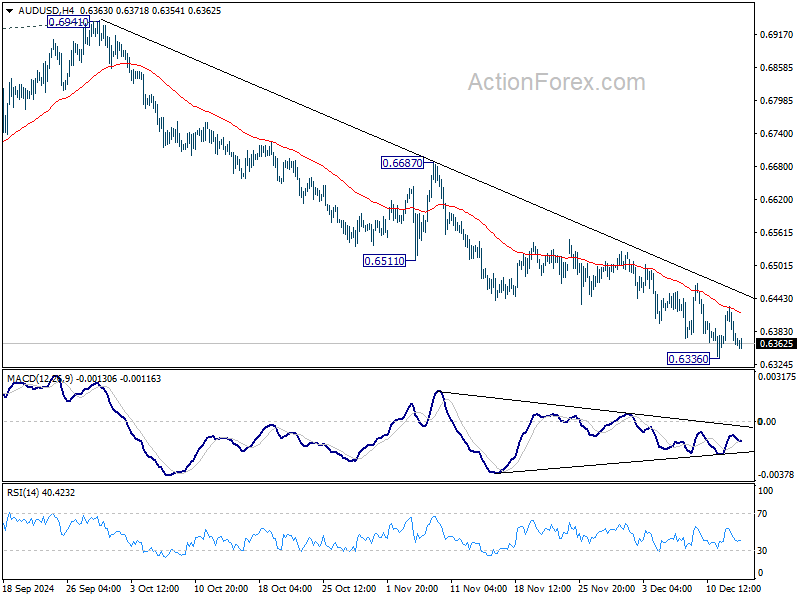
In the bigger picture, price actions from 0.6169 (2022 low) are seen as a medium term consolidation to the down trend from 0.8006. More sideway trading could be seen above 0.6169, but overall outlook will stay bearish as long as 0.6941 resistance holds. Firm break of 0.6169 will resume the down trend to 61.8% projection of 0.8006 to 0.6169 from 0.6941 at 0.5806 next.
USD/JPY Daily Outlook
Daily Pivots: (S1) 152.05; (P) 152.41; (R1) 153.03; More...
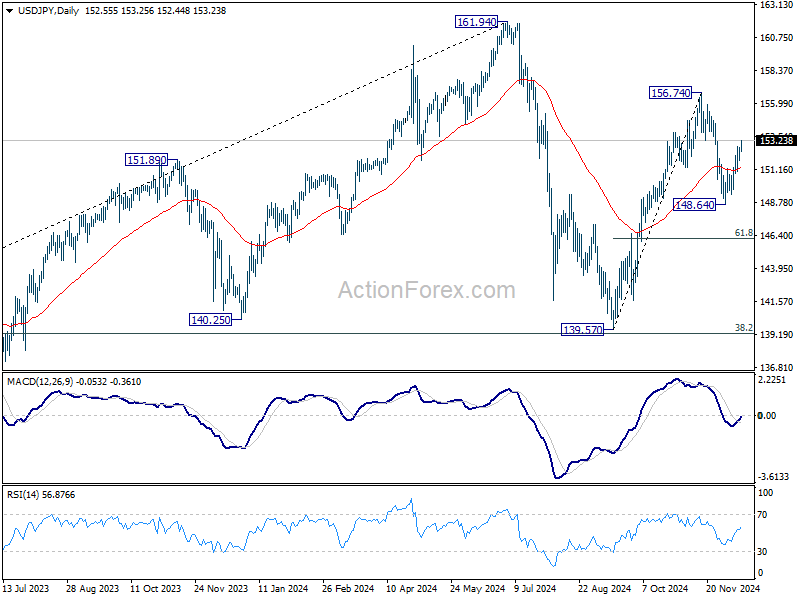
Intraday bias in USD/JPY remains on the upside for retesting 156.74 resistance. Current development suggests that rise from 139.57 might still be in progress and break of 156.74 will confirm resumption. On the downside, below 151.00 minor support will turn intraday bias neutral first. But risk will stay on the upside as long as 148.64 support holds, in case of retreat.
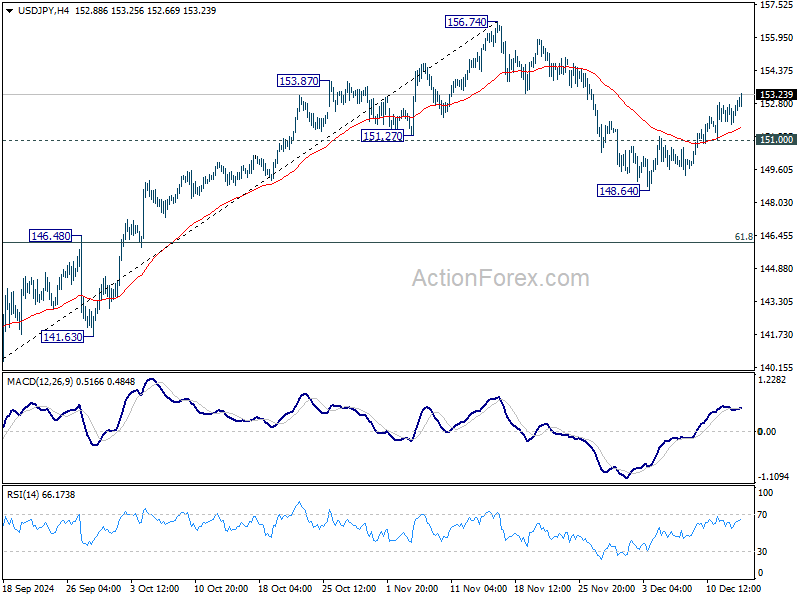
In the bigger picture, price actions from 161.94 are seen as a corrective pattern to rise from 102.58 (2021 low). The range of medium term consolidation should be set between 38.2% retracement of 102.58 to 161.94 at 139.26 and 161.94. Nevertheless, sustained break of 139.26 would open up deeper medium term decline to 61.8% retracement at 125.25.
USD/CHF Daily Outlook
Daily Pivots: (S1) 0.8851; (P) 0.8890; (R1) 0.8962; More…
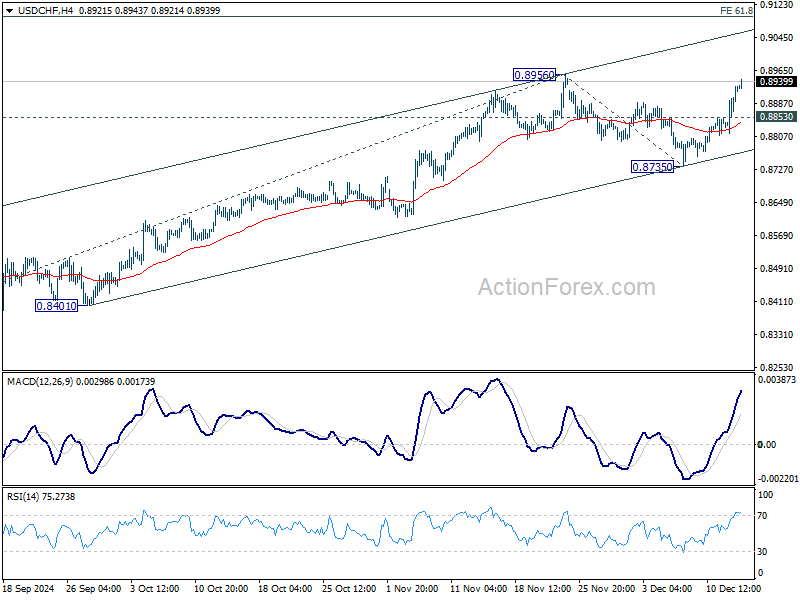
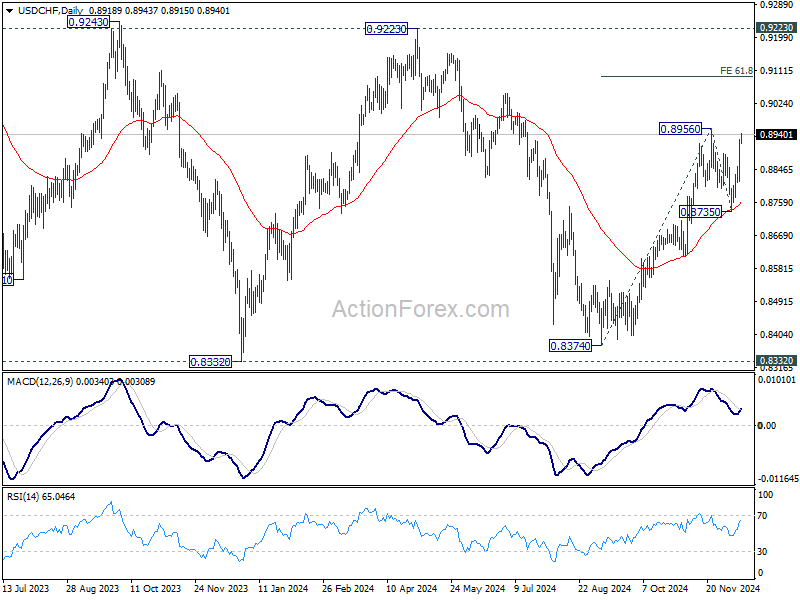
USD/CHF's rally is in progress and intraday bias stays on the upside. Firm break of 0.8965 resistance will resume the whole rally from 0.8374. Next target is 61.8% projection of 0.8374 to 0.8956 from 0.8735 at 0.9095. On the downside, below 0.8853 minor support will turn intraday bias neutral first. But risk will stay on the upside as long as 0.8735 support holds, in case of retreat.
In the bigger picture, price actions from 0.8332 (2023 low) are currently seen as a medium term corrective pattern, with rise from 0.8374 as the third leg. Overall outlook will continue to stay bearish as long as 0.9223 resistance holds. Break of 0.8332 low is in favor at a later stage when the consolidation completes.
EUR/USD Daily Outlook
Daily Pivots: (S1) 1.0443; (P) 1.0487; (R1) 1.0510; More...
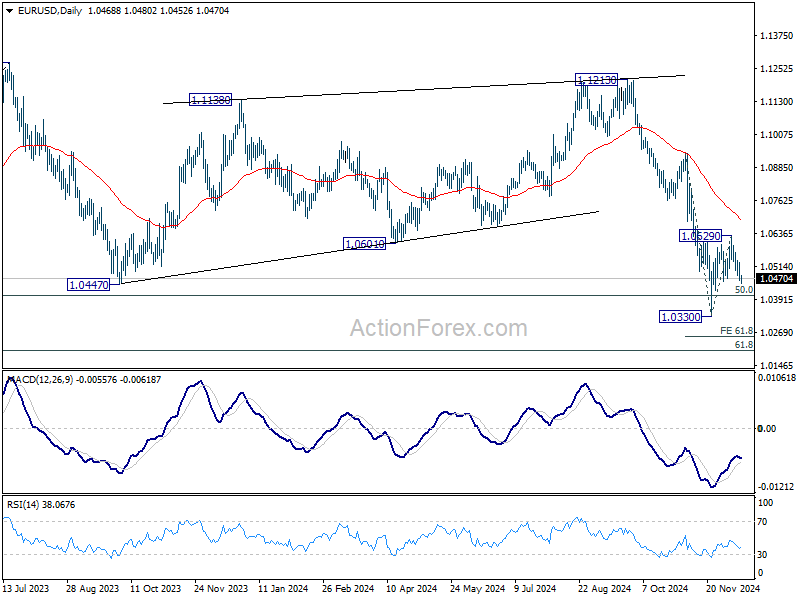
Break of 1.0471 support suggests that EUR/USD's corrective recovery from 1.0330 has completed at 1.0629 already. Intraday bias is back on the downside for retesting 1.0330 low first. Firm break there will resume the fall from 1.1213 to 61.8% projection of 1.0936 to 1.0330 from 1.0629 at 1.0254. Also, in this case, sustained trading below 1.0404 key fibonacci level will carry larger bearish implication. For now, risk will stay on the downside as long as 1.0629 resistance holds, in case of recovery.
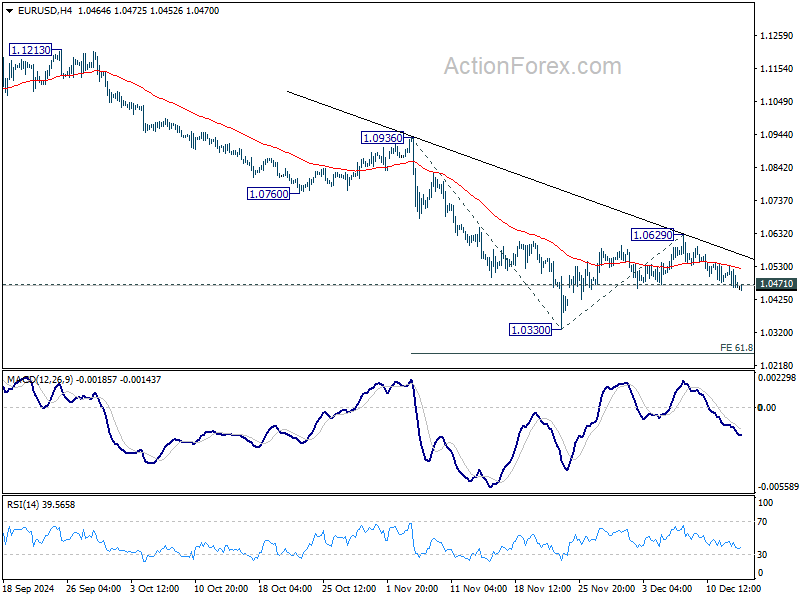
In the bigger picture, focus stays on 50% retracement of 0.9534 (2022 low) to 1.1274 at 1.0404. Strong rebound from this level will keep price actions from 1.1273 (2023 high) as a medium term consolidation pattern only. However, sustained break of 1.0404 will raise the chance that whole up trend from 0.9534 has reversed. That would pave the way to 61.8% retracement at 1.0199 first. Firm break there will target 0.9534 low again.