Sample Category Title
Fed Preview: Gauging for Neutral
- We expect the Fed to cut the policy rate target by 25bp in the December meeting. The Fed could also cut the ON RRP facility rate by an additional 5bp, but we do not expect this to have a significant impact on the policy stance (see p. 2).
- Markets have fully priced in next week's cut. Main focus will be on updated rate projections, and especially on the FOMC's latest view on the terminal rate level. 2024 and 2025 GDP and inflation forecasts will likely get revised slightly higher.
- We think the Fed is likely to continue cutting rates faster than markets expect also in 2025. If the 'dots' continue to signal several cuts for 2025, UST yields could shift lower and EUR/USD edge higher upon announcement.
Since the FOMC participants filed their latest economic projections in mid-September, market pricing for real terminal policy rate has shifted roughly 60bp higher. Real 1y forward OIS curve stabilizes around 1.7-1.8% level, which is 0.8-0.9% above the September median real long-term dot. While 25bp cut next week is mostly a done deal, the true focus is on how FOMC's terminal rate view has shifted alongside markets.
While part of the increase in market pricing can be attributed to term premium (NY Fed's ACM model estimate for 10y term premium is roughly 30bp higher than 3M ago), markets are discounting in expectations of more resilient economy and supportive fiscal policy.
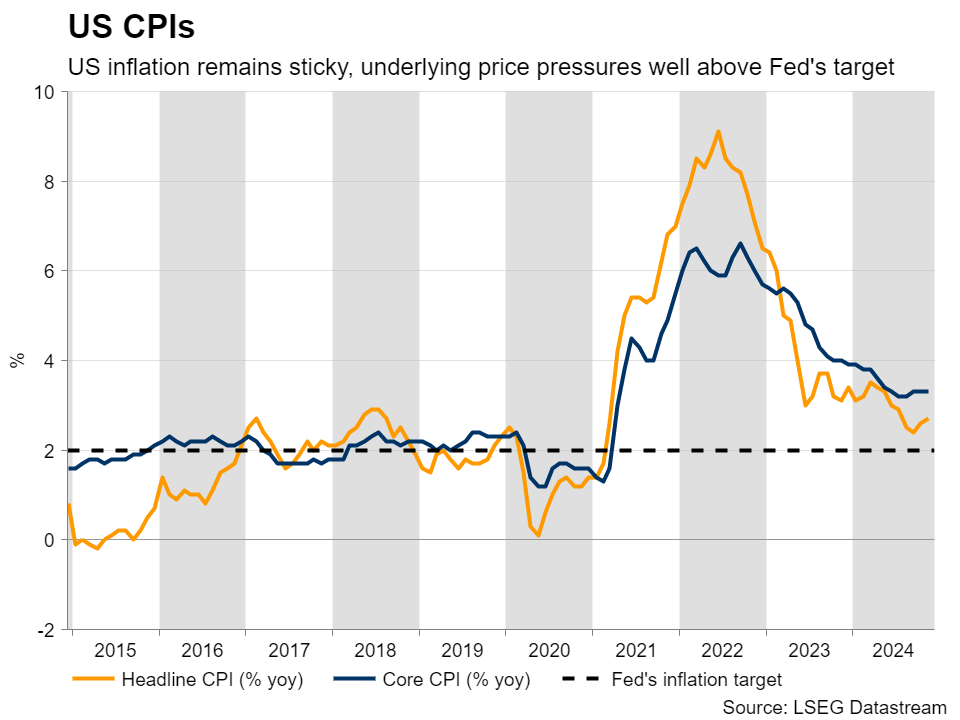
But while we wait for the details on the latter, we struggle to see why the Fed should suddenly be more concerned with the economy overheating again. This week's CPI data showed continuing cooling in both housing and non-housing services inflation, suggesting that the underlying disinflation trend remains on track. The ratio of job openings to unemployed has stabilized around 1.1, which suggests labour market balance is slightly cooler than before the pandemic. Both market and survey-based measures of inflation expectations remain well aligned with the 2% target.
Still low level of mortgage applications and weak commercial loan demand signals from the Fed's latest SLOOS data also suggest current policy stance remains restrictive. As such, we think the Fed can continue to reduce rates towards neutral not just next week, but also into 2025. And when it comes to estimating the neutral level, we do not think the magnitude of the shift in market pricing is quite yet justified. More modest upward-shift in longer-term dots could be a dovish surprise for the markets.
We expect minor positive revisions to GDP and inflation forecasts for 2024 & 2025 but think 2026 forecasts will remain stable. We think Powell will aim for a neutral tone in his remarks, but he is still likely to verbally open the door for slowing the pace of cuts, in line with what we have heard from other Fed commentators lately. Markets are currently pricing in only 6bp for the January meeting, and we do not expect a dramatic re-pricing after next week, as the decision ultimately hinges on data released later on. 10-12bp (or close to 50/50) would be a fair level at this stage in our view. Markets' most likely scenario includes 25bp rate cuts in every other meeting during H1 2025, but we still believe the Fed will end up cutting rates in every meeting until June.
ON RRP cut would not predict an imminent end to QT
The Fed could also deliver a 5bp additional technical reduction to the ON RRP rate as
discussed in the November minutes, which would align it with the lower bound of the Fed
Funds target range. We do not think it would have a significant impact on the overall policy
stance, but rather, such a move should be seen as a sign of the Fed wanting to err on the
side of caution amid the risk of repeating the repo market turmoil in September 2019.
All else equal, the reduction would make it less attractive for money market funds to park
cash into the facility, which could then provide a positive boost to markets’ liquidity
conditions. ON RRP usage peaked above USD2300bn around two years ago, but the level
has already declined to around USD150bn, meaning the impact would be modest either
way.
Market-based overnight repo rate (SOFR) has traded mostly in tandem with the Fed Funds
rate over past years, but as liquidity conditions have gradually tightened due to QT, SOFR
has seen occasional spikes around month and quarter turn dates. The very latest fixings
have been on the higher side again, which could increase the likelihood of the cut.
If the Fed does decide to cut the ON RRP rate, Powell would certainly face questions about
the future of QT, which is still draining liquidity at a rough pace of USD40bn/month.
However, the near-term liquidity outlook does not appear too concerning in our view. The
US debt ceiling suspension ends at the beginning of 2025, which means that the government
will start to utilize its cash balance to fund the ongoing deficits until the ceiling is lifted or
suspended again. This could theoretically boost liquidity by as much as USD775bn over
the course of H1 2025. If the remaining funds from the ON RRP facility would also get
drained back to the market, the level of bank reserves could even start rising again despite
the QT. As such, we do not expect the Fed to halt the QT before H2 2025 at earliest. Read
more from the STIR section of RtM USD – December cut in the horizon, 10 December).
Weekly Focus – The Season for Rate Cuts
As economic data continues to confirm that the inflation problem is more or less over, there is no longer a need for central banks to maintain restrictive levels of interest rates. Hence, this has been a week of rate cuts, and we expect next week to be the same - with some important nuances and exceptions.
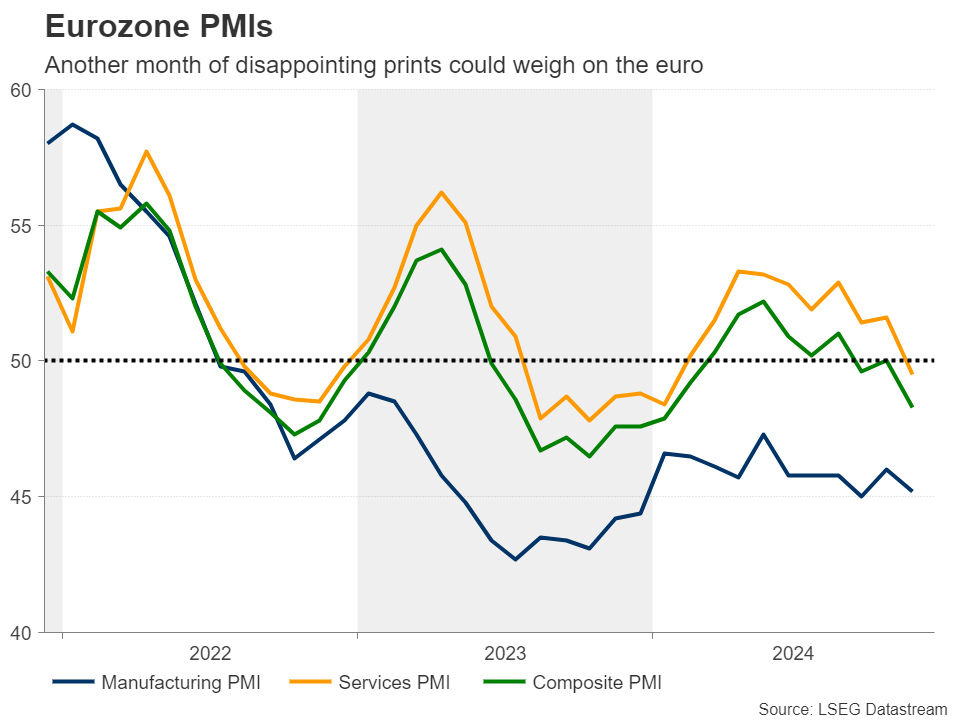
The European Central Bank delivered the expected 25bp cut, although in our view they could easily have gone for 50bp, given weak growth indicators and the fact that euro area interest rates remain well above estimates of what the neutral level is and hence are still serving to dampen the economy further. However, the bank did signal a clearer path ahead for more cuts, and the market is coming around to our expectation that the deposit rate will be cut from the current 3% to 1.5% during 2025. One reason for the gradually lower outlook over the last month and generally increasing pessimism on the European economy was the weak PMI growth indicators from the euro area in November, so it will be very interesting to see the December numbers in the coming week. If they do not show clear improvement (and we do not expect them to), we are likely looking at a GDP decline in Q4. Note, though, that we will also get the January PMI before the next ECB rate decision. Both the Swiss and the Canadian central banks did cut by 50bp this week, which in the case of the former was a bit more than expected.
In the US, both we and the consensus expect a 25bp rate cut to be announced on Wednesday. Interest will likely centre on communication about the rate outlook for 2025, where we will get an update to the so-called dot plot showing what members of the monetary policy committee expect. Since we last got this update in September, market pricing has moved sharply towards fewer rate cuts, as the economy looks strong and as the Republican election victory could mean loser fiscal policy. However, inflation is well on track to reach its 2% target which was again confirmed by November data this week, and data for loans and credit continue to suggest that current monetary policy is quite restrictive. We see a strong case for the central bank to maintain its signal of a string of rate cuts in 2025, at least until we have more clarity over the fiscal policy outlook.
We expect the Bank of England to keep the Bank Rate unchanged at 4.75% on Thursday 19 December, sticking to its gradual easing cycle. While we get the labour market report for October/November and November inflation just days before, we do not expect this to move the needle of the immediate decision but prove more important for the 2025 outlook. We expect Sweden and Norway to remain very different also this week, with Sweden cutting rates again and signalling more to come, while Norway will likely hold tight, see the market movers section.
One central bank looking to increase rates rather than cutting them is the Bank of Japan. We have previously seen the upcoming December meeting as a likely date for that, but as support for the yen no longer seems acute, we think the Bank of Japan will stay on hold on Friday, and we push our expectation for the next rate hike to January.
Yearly Technical Outlook 2025 – EURUSD, GBPUSD, USDJPY
EURUSD: No light at the end of the tunnel
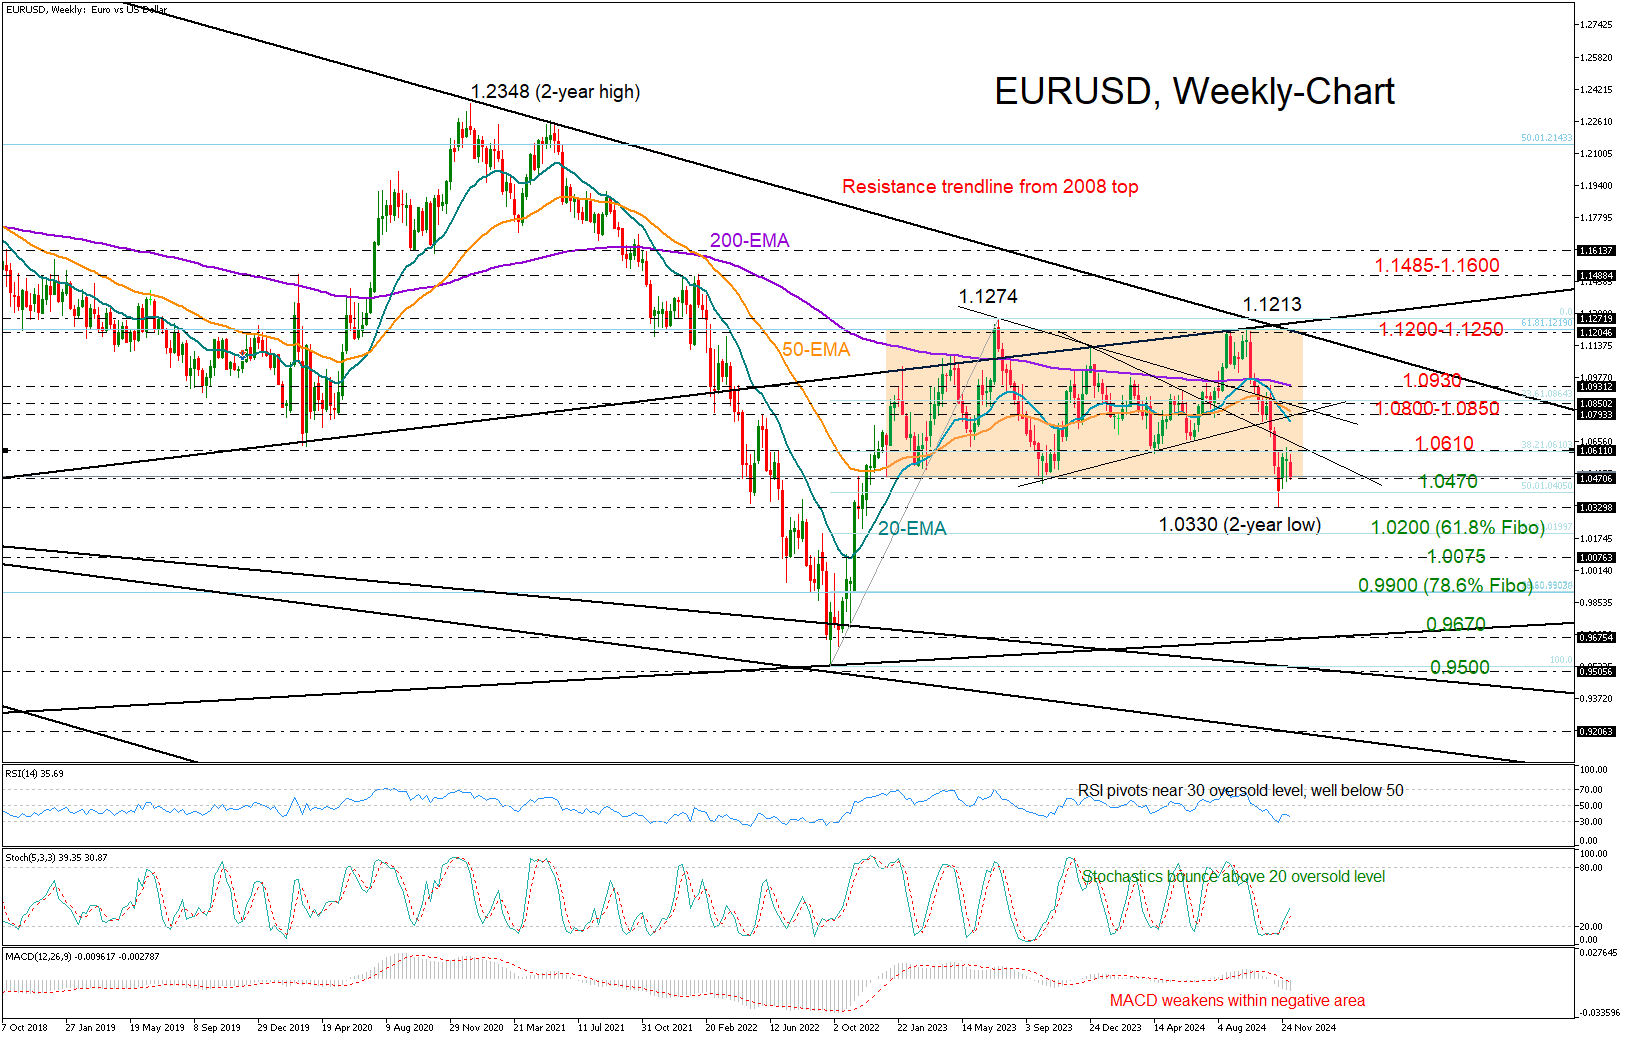
EURUSD is down by 4.78% year-to-date and has been stuck in a range since the ECB signaled the end of its rate hike cycle more than a year ago. Despite a boost from a dovish Fed, the euro has struggled due to the ECB’s rate cut policy, a stagnated economy, political instability, and geopolitical conflicts in Ukraine and the Middle East, pushing the pair to a two-year low of 1.0330.
Looking into 2025, volatility is likely to continue with ongoing divergences in monetary policy between the ECB and the Fed, political jitters, and potential tariff headwinds from Trump. The technical picture also displays a grim outlook.
Although the pair escaped a bearish break below a rectangle, with the technical indicators pointing to oversold conditions, there is no guarantee that the price could transition to a sustainable uptrend.
The bearish double top formation and the rejection from the 2008 resistance trendline near 1.1213 and around the 61.8% Fibonacci retracement of the 2000-2008 upleg sent a red warning in September. Then, the 20-weekly exponential moving average (EMA) crossed below the 50-weekly EMA after failing to move above the 200-weekly EMA, further strengthening the case of a bearish reversal.
If the pair sinks below 1.0470 and 1.0330, it may initially pause near the 1.0200 level before and then test parity within the 0.9900-1.0075 zone. Moving lower, the price could visit the tentative support line, which connects the 2000 and 2022 lows, at 0.9670.
For bulls, breaking above 1.1200-1.1250 is key, but resistance at 1.0610 and 1.0800-1.0850 followed by some challenging sessions around the 200-weekly SMA at 1.0930 could hold the pair back. A move past 1.1200-1.1250 could open the door to 1.1485-1.1600.
The mean estimate for the end of 2025 from 50 key global financial institutions reporting to Refinitiv is at 1.0500, with forecasts ranging between 1.1130 and 0.9900.
GBPUSD: May chase more gains
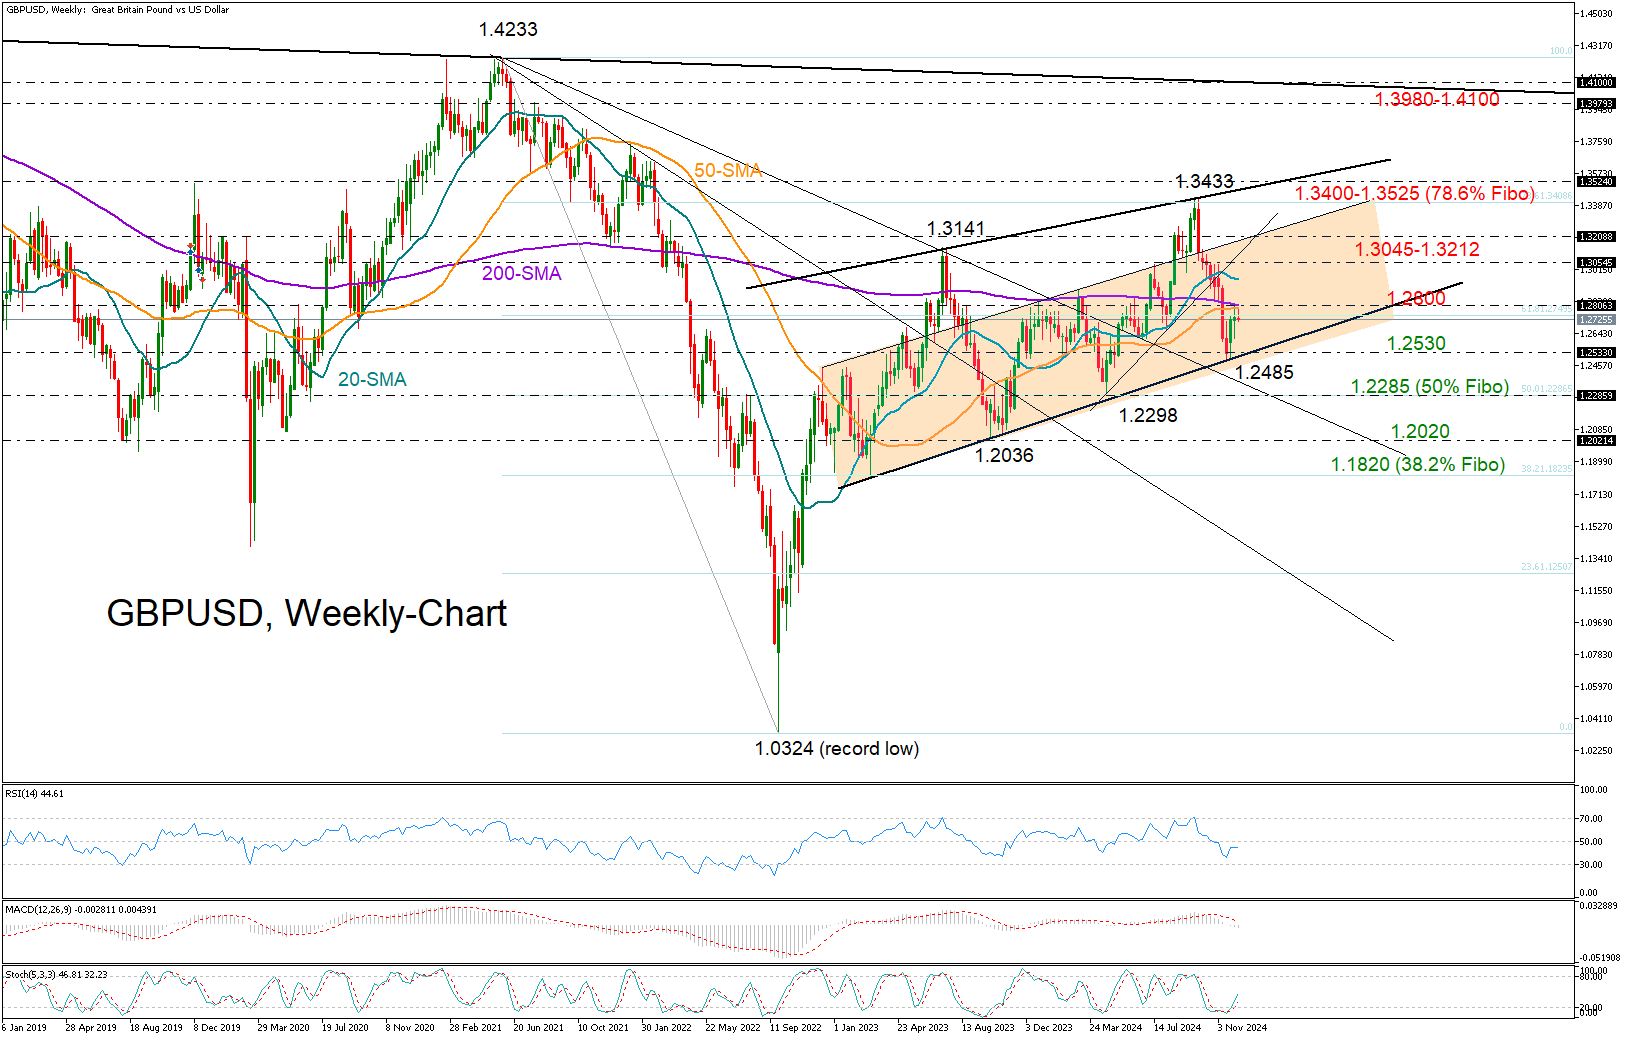
GBPUSD did not have an impressive performance either but a political shift to the left in July and a relatively more conservative rate cut policy from the Bank of England offset selling pressures, leaving the pair with a negligible gain of 0.36% year-to-date.
Inflation is back above the central bank’s 2.0% target and the impact from the new fiscal budget, which forces businesses to increase their social insurance contribution in April, is unknown. With futures markets suggesting a relatively gradual monetary easing, and the UK chancellor hoping for an ambitious economic partnership with the EU, GBPUSD could remain supported. However, a struggling economy and trade disputes could prevent a trend continuation toward the pre-pandemic levels above 1.4000.
Having rotated near a familiar ascending trendline, there is potential for a continuation higher as both the RSI and the stochastic oscillator have changed direction to the upside. A confirmation could come above 1.2800, while a completion of a golden cross between the 50- and 200-weekly simple moving averages (SMAs) could fuel more optimism, shifting the spotlight toward the next barrier at 1.3045-1.3212. A steeper increase could face a major battle within the 1.3400-1.3525 area.
Alternatively, a slide below 1.2530 could see a test of the 50% Fibonacci retracement of the 2021-2022 downtrend at 1.2285. If that floor cracks, the selloff could exacerbate toward the 1.2020 support area or even lower to the 38.2% Fibonacci of 1.1820. Additional declines from there would downgrade the long-term picture.
The mean estimate for December 2025 from 50 key global financial institutions reporting to Refinitiv is at 1.2800 versus 1.2672 predicted for December 2024. The highest forecast is at 1.3600 and the lowest is at 1.2000.
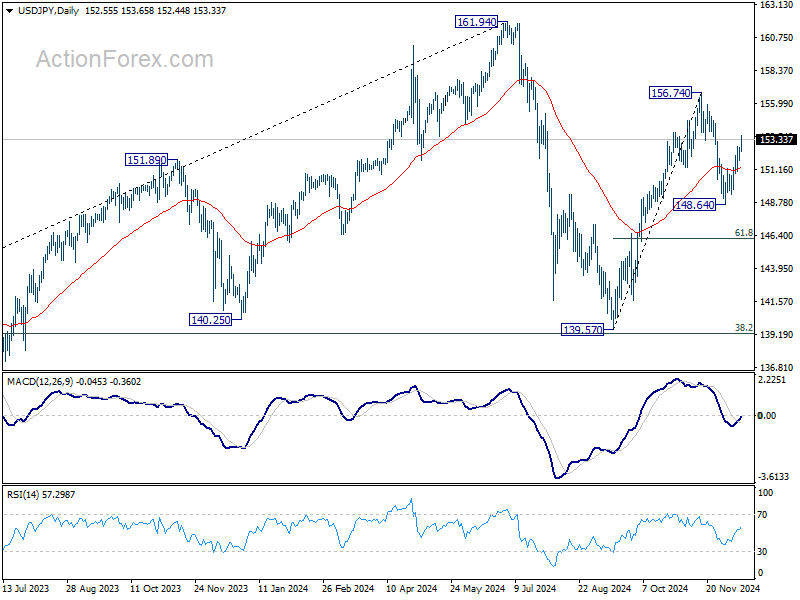
USDJPY: Could sail through the waves
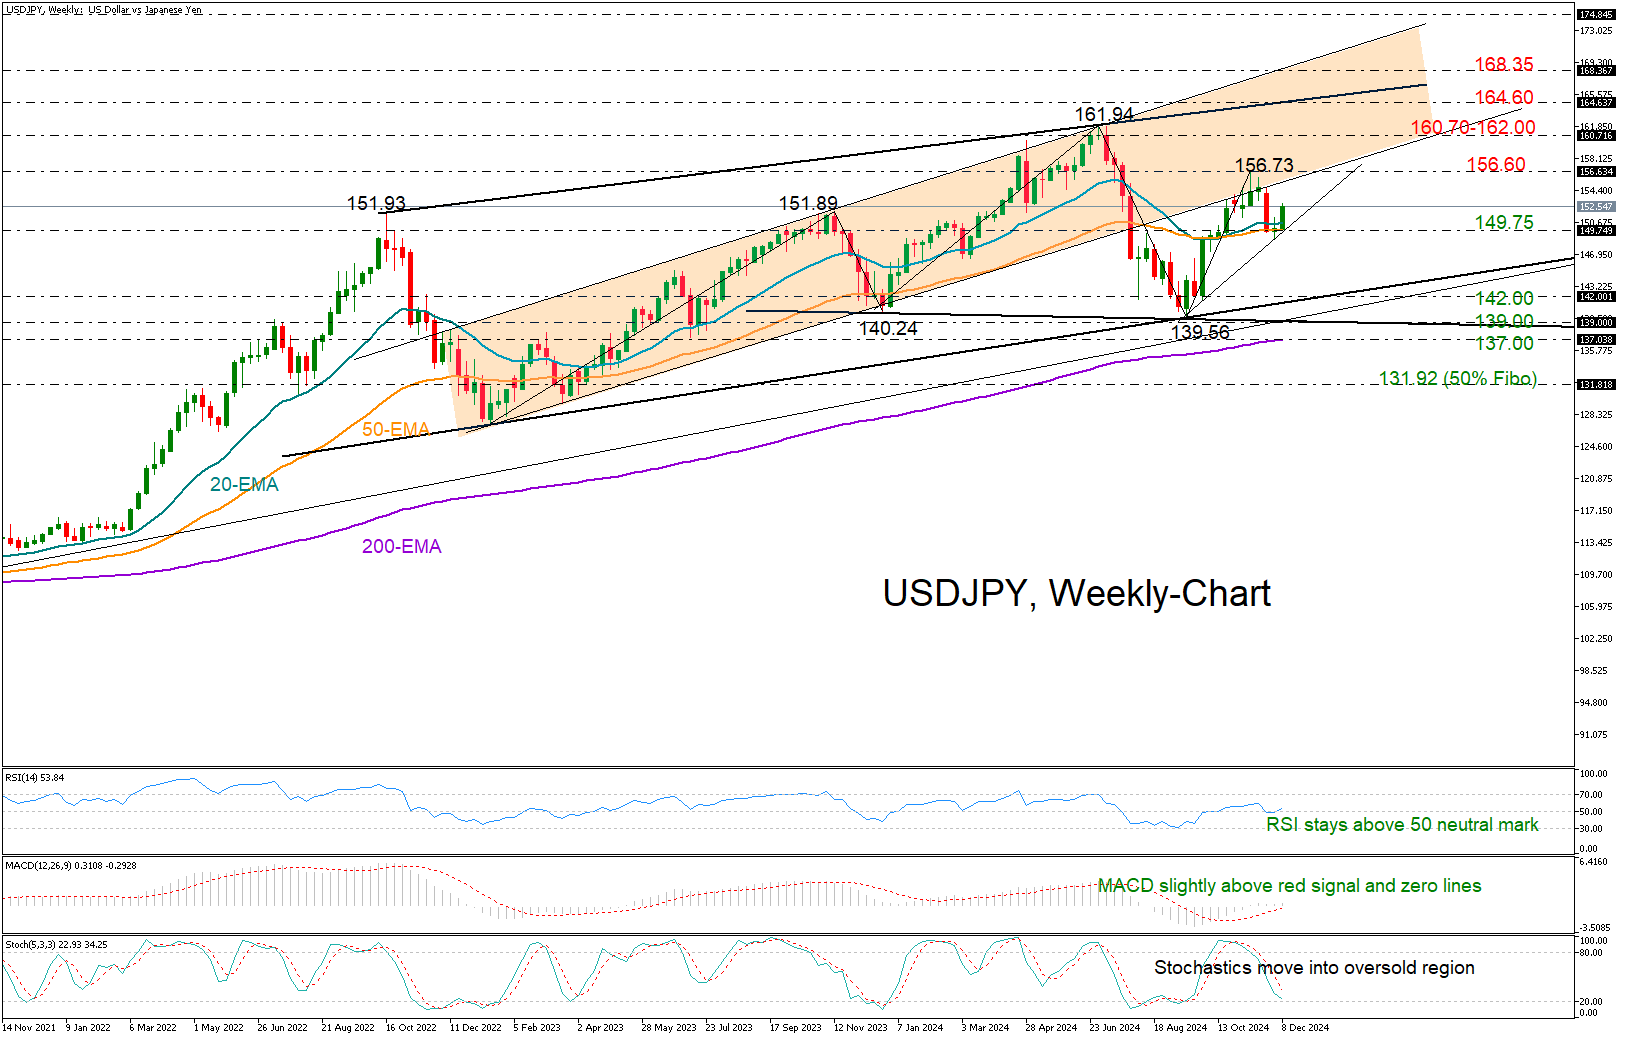
USDJPY is up 8.11% year-to-date, rebounding from a summer sell-off to remain above 150.00 as the Fed leaned towards gradual rate cuts.
With President Trump lifting his threat to fire Jay Powell before his term ends in 2026, monetary guidance could produce continuity. The greenback has been benefiting from resilient economic conditions. Hence, the health of the US economy and particularly inflation and employment expectations could be key catalysts for the greenback as investors are uncertain about the impact of Trump’s potential deep tax cuts and import tariffs. On the other hand, potential rate hikes delivered by the BoJ could weigh on the pair.
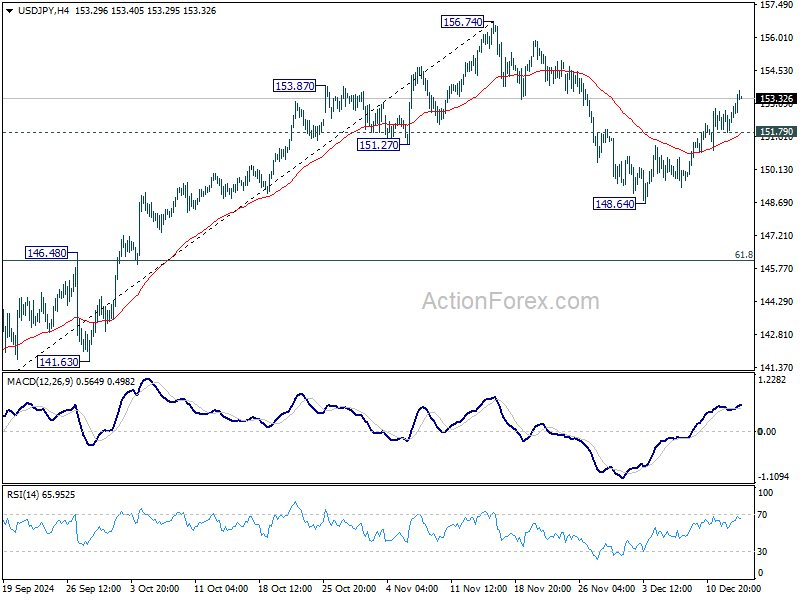
Technically, USDJPY seems to be trading within a bullish channel, recently setting a foothold near its 20- and 50-weekly SMAs at 149.75. If that floor holds and the bulls pierce through the 156.60 wall, the recovery phase could extend toward July’s multi-year top of 161.94 or mark a new higher high near the channel’s upper band currently seen near 164.60. Then, the spotlight could fall on the steep ascending line at 168.35, a break of which could see an acceleration toward 174.85.
Still, the technical outlook is not completely out of risks. A bearish head and shoulders pattern could take shape if the price confirms a lower high at 156.73 and subsequently corrects below the 139.00 area. If the 200-weekly exponential moving average (EMA) currently at 137.00 proves fragile too, the pair could suffer a painful decline toward 131.92.
The mean estimate for December 2025 from 50 key global financial institutions reporting to Refinitv is at 147.00 versus 151.75 predicted for December 2024. The highest forecast is at 160.00 and the lowest at 125.00.
Week Ahead – Fed, BoJ and BoE Conclude End-Year Policy Decisions
- Fed seen cutting in December, pausing in January
- BoJ leans towards keeping rates steady
- BoE seen ending 2025 on the sidelines as well
- Flash PMIs, UK and Canada CPIs, and core PCE also on tap
Fed seen taking the sidelines in January
Following the RBA, the BoC, the SNB and the ECB, the central bank bonanza continues next week, with the Fed on Wednesday, and the BoJ and the BoE on Thursday.
Although Wednesday’s data suggested that US inflation was a little bit hotter than in October, market participants became more convinced that the Fed will press the rate-cut button next week, almost fully penciling in a quarter-point reduction. Having said that though, the probability for policymakers taking the sidelines in January has soared to around 80%.
It seems that market participants took the words of several policymakers seriously, who appeared willing to vote in favor of a rate cut at the upcoming meeting, but they also stuck to their guns that a slower rate-reduction path moving forward is necessary.
That belief may be the result of president-elect Trump’s pledge to impose hefty tariffs on imports from around the globe, especially China, as well as his promise for massive corporate tax cuts. These policies are seen as fueling inflation, which has been proving sticky even before Trump’s plans are enacted.
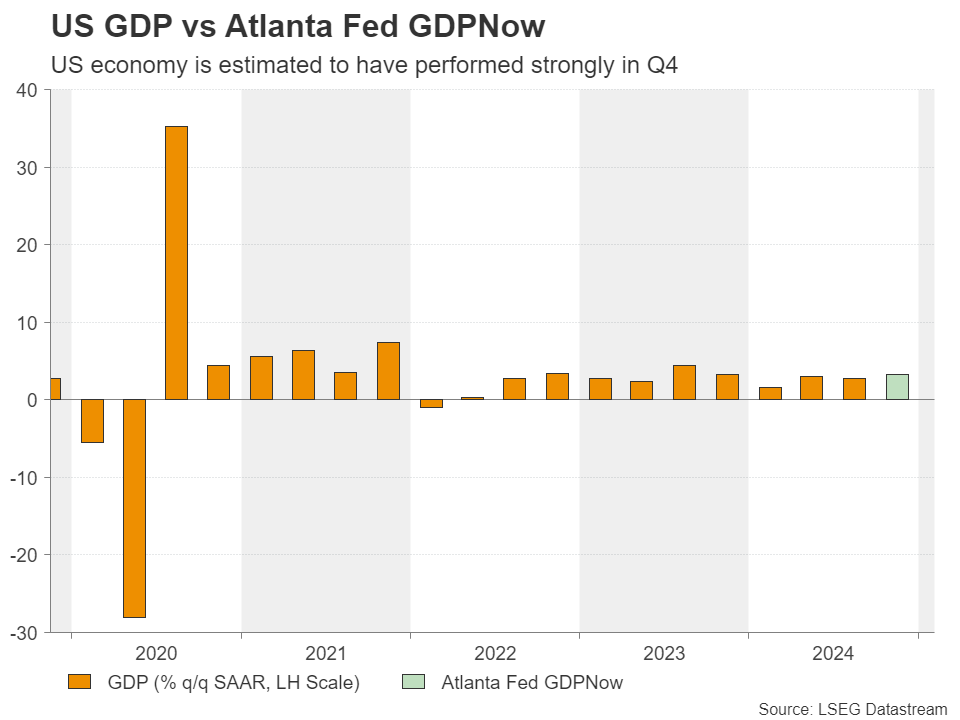
The stellar performance of the US economy corroborates the notion that Fed officials do not need to rush into lowering interest rates, something also noted by Fed Chair Powell himself. The Atlanta Fed GDP now model is pointing to a strong 3.3% QoQ SAAR growth in Q4, while the latest employment report confirmed that the labor market remains robust and that October’s dismal print was just an outlier, a one-off occasion due to strikes and adverse weather conditions.
Mind the dots
With all that in mind, a 25bps cut itself is unlikely to shake the markets much. Investors may focus more on hints and clues on how likely a January pause is, as well as on how many rate cuts policymakers are contemplating throughout 2025.
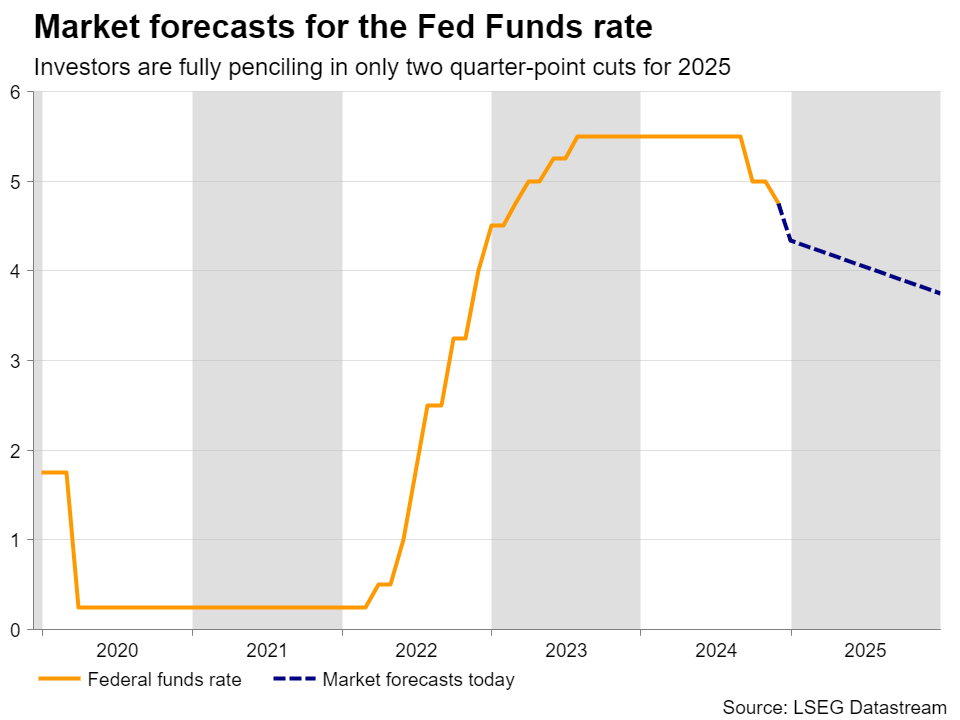
Taking next week’s reduction out of the equation, Fed fund futures are pointing to another 50bps worth of reductions by next December. Combined with an already strong chance for a pause at the first gathering of the year, this poses some downside risks for the US dollar.
Even if Fed Chair Powell corroborates the notion of a January pause, a median dot for 2025 pointing to more than 50bps worth of rate cuts could disappoint market expectations and thereby weigh on the greenback. At the same time, bets of lower-than-currently expected borrowing costs combined with Trump’s tax cuts, may be celebrated on Wall Street, with equity indices continuing to explore uncharted territories.
Bank of Japan - to hike or not to hike?
Passing the ball to the BoJ, up until very recently, investors were expecting 15bps worth of a rate increase at this gathering, or a 60% chance for a quarter-point hike. However, that probability dropped to around 25% after board member Nakamura said that, although he is not opposed to rate hikes, the decision should be data dependent.
His remarks disappointed those expecting the BoJ to finish the year with a hike, but yet, traders are nearly fully pricing in a quarter-point increase by March as Governor Ueda and his colleagues maintained their readiness to hike again due to an expanding economy, rising wages, and above-target inflation.
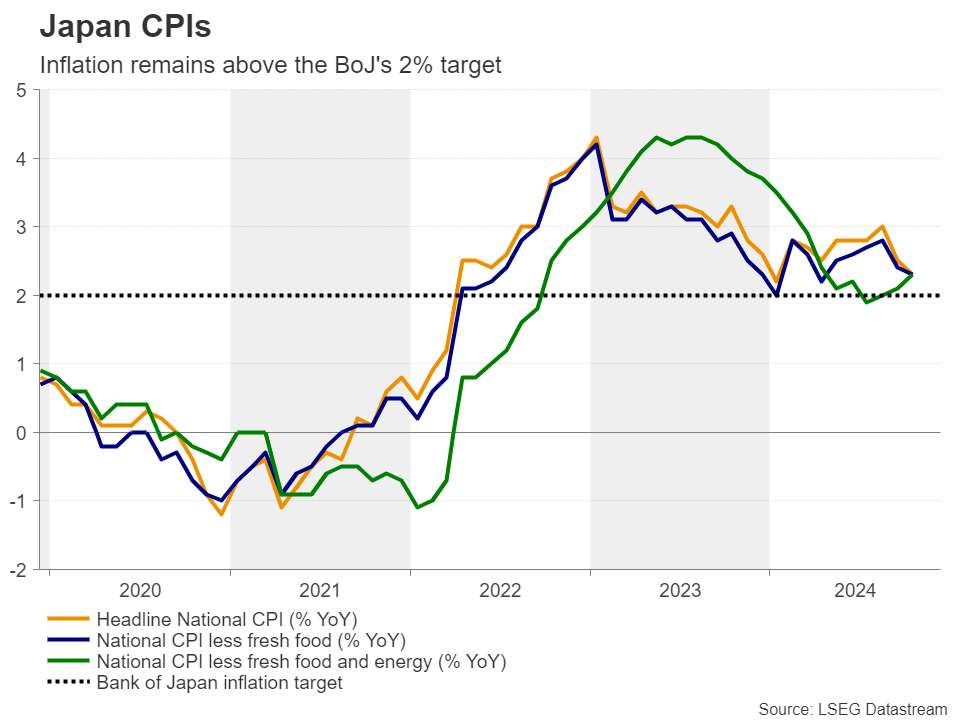
This means that there are upside risks for the yen. A rate hike by the BoJ next week could offer strong support, but even if officials decide to stand pat, strong hints that an increase at the turn of the year is warranted could still prove beneficial.
BoE appears in no rush to cut rates
A few hours later, the central bank torch will be passed to the BoE. Contrary to the Fed, investors are seeing only a 10% chance of a 25bps cut at this gathering. They are not even fully pricing in one before March.
Last month, policymakers lowered the Bank rate from 5.0% to 4.75% but raised their inflation forecasts as finance minister Reeves announced massive government spending in her first budget.
Combined with recent remarks from Governor Bailey that there is still “a distance to travel”, this prompted investors to anticipate no action before the turn of the year and around 75bps worth of reductions by the end of 2025.
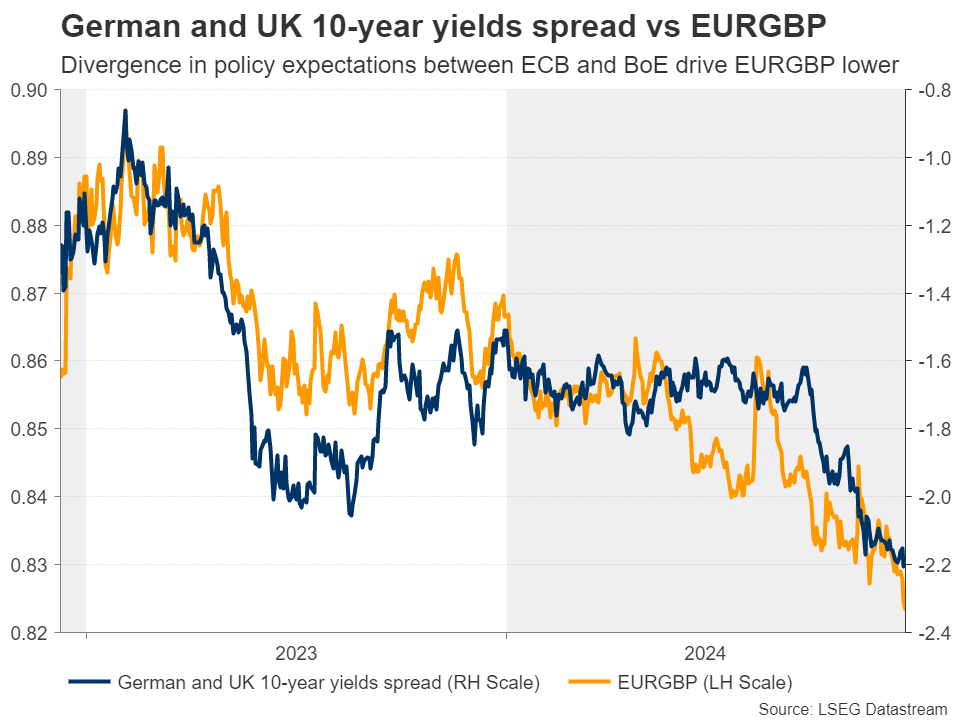
The relatively hawkish BoE bets helped the pound to be the only major currency that has not lost ground against the greenback in 2024, and to strongly outperform the neighboring euro as the ECB is expected to cut interest rates by another 115bps in 2025. Trump’s tariff threats pose another risk for the Eurozone and the common currency.
Ergo, should the BoE maintain a hawkish stance, the pound is likely to remain supported. It could even finish the year higher against the US dollar if the Fed disappoints current market expectations.
Flash PMIs, CPIs and more
What could add extra pressure on the euro next week may be another round of disappointing PMIs on Monday. The preliminary numbers from France and Germany are coming out ahead of the Eurozone’s prints and signs of more economic struggles in these two nations, which are also face political uncertainty, could intensify headaches for euro traders.
The UK and US preliminary S&P Global PMIs are also out on the same day, but they may attract less attention than the Euro area prints as pound and dollar traders may have their attention fixed on the BoE and Fed central bank decisions.
That said, pound traders may be tempted to incorporate the UK jobs data for October and the UK CPI numbers for November, due out on Tuesday and Wednesday, into their expectations heading into Thursday’s decision. So, the pound could experience some early volatility before Bailey and co. announce their decision. The UK retail sales are due out on Friday.
On Friday, the agenda also includes the US core PCE index for October, which is the Fed’s preferred inflation gauge and is accompanied by the personal income and spending data for the same month.
Speaking about inflation, following the BoC’s decision to cut interest rates by 50bps this week, loonie traders may turn their attention to Canada’s CPI data on Wednesday.
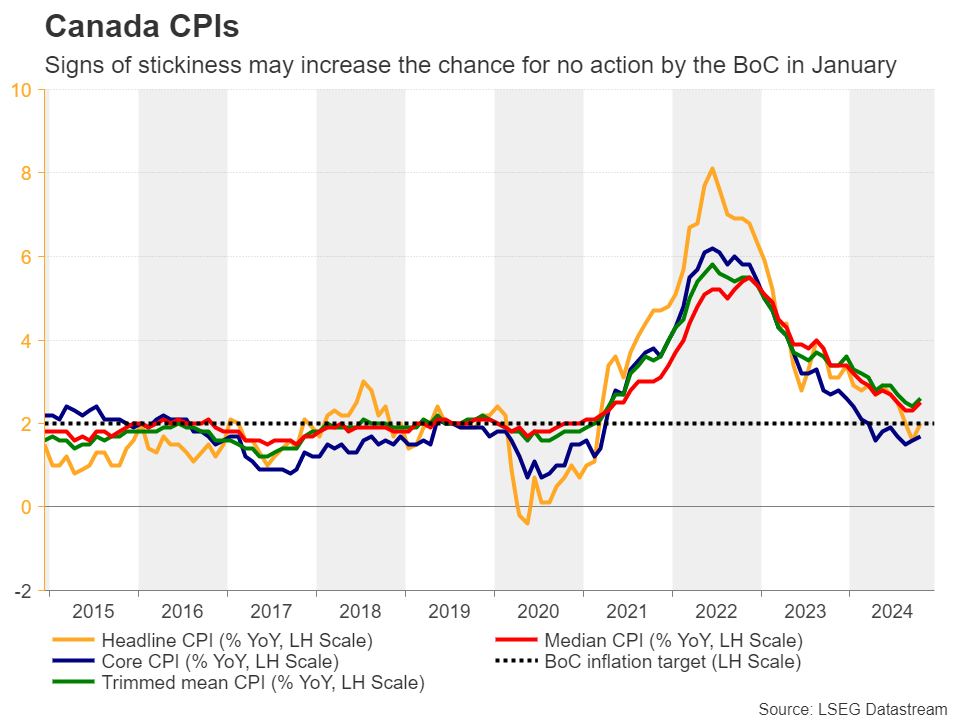
Although policymakers opted for the bigger move, Governor Macklem said that further reductions would be more gradual. Now, investors are seeing a 40% probability for the Bank to stand pat at the January meeting and signs of inflation stickiness may increase that chance, thereby adding some support to the Canadian dollar.
Bitcoin BTCUSD Forecasting the Rally After 3 Waves Pull Back
Hello fellow traders. In this technical article we’re going to take a quick look at the Elliott Wave charts of Bitcoing BTCUSD , published in members area of the website. As many of our members are aware, the crypto has given us good buying opportunities recently. BTCUSD is showing impulsive bullish sequences in the cycle from the 52598 low , that are calling for a further strength. In the further text we are going to explain the Elliott Wave Forecast.
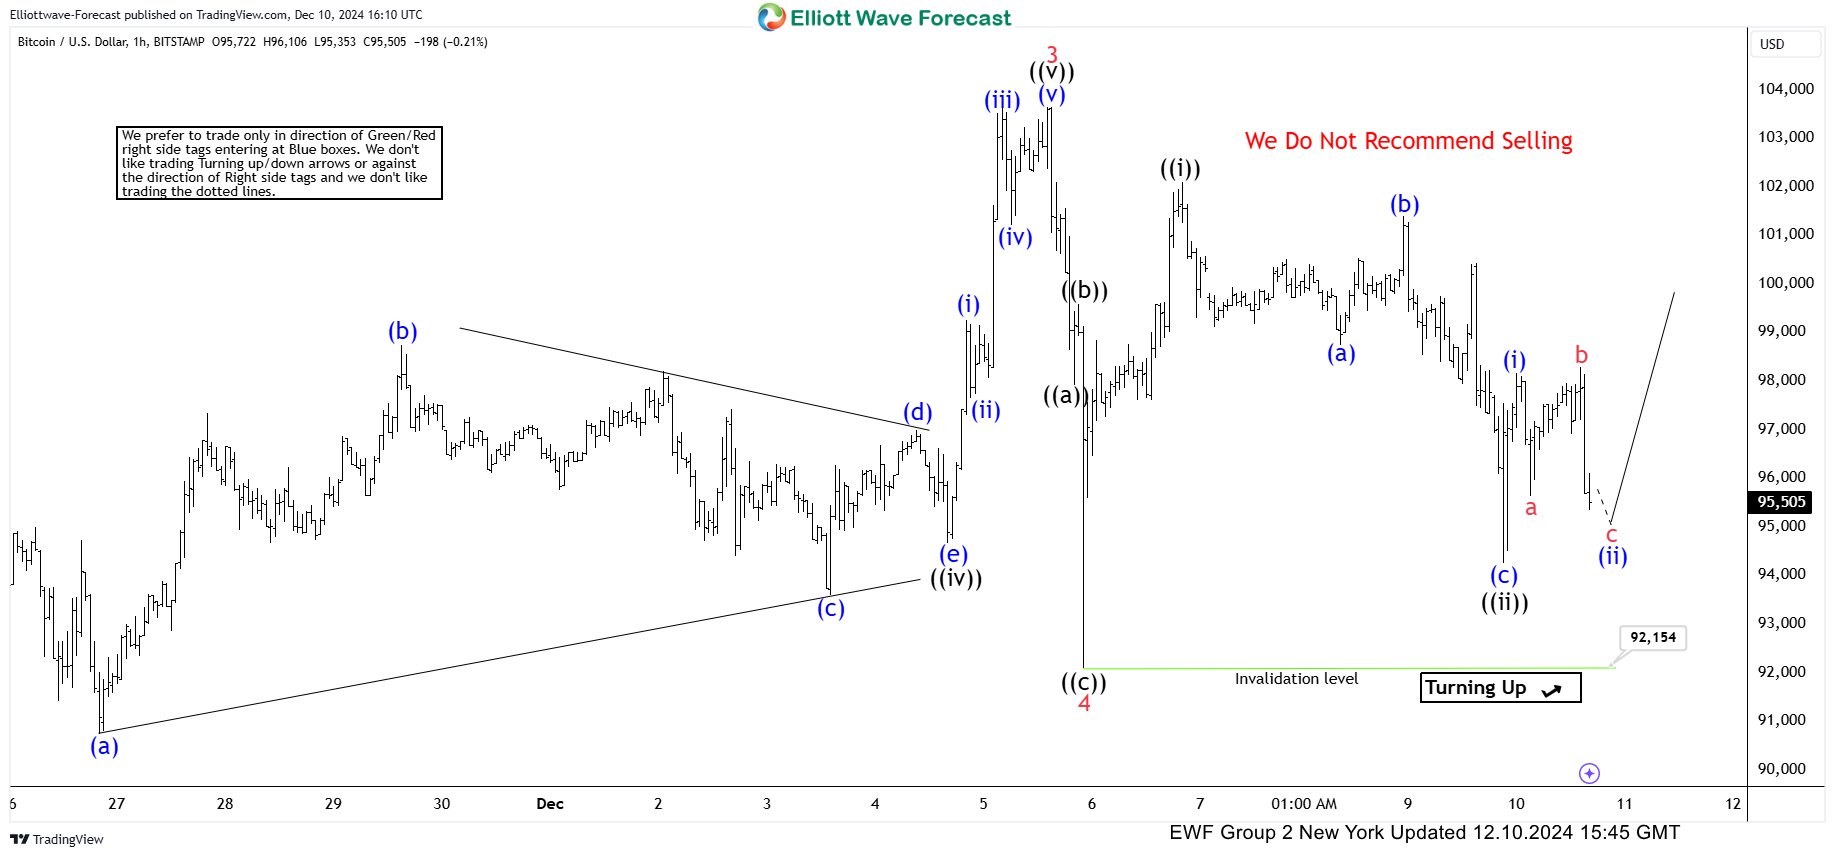
BTCUSD Elliott Wave 1 Hour Chart 12.10.2024
BTCUSD completed wave 4 (red) at the 92154 low and wave ((ii)) (black) at the 94275 low. Both corrections formed Elliott Wave Zig Zag patterns. Currently, we are near completing the intraday pullback (ii) (blue). As long as the price stays above the 94275 low, and more importantly above the 92154 low, we expect further strength in the crypto. This could ideally lead to new highs. We advised against selling
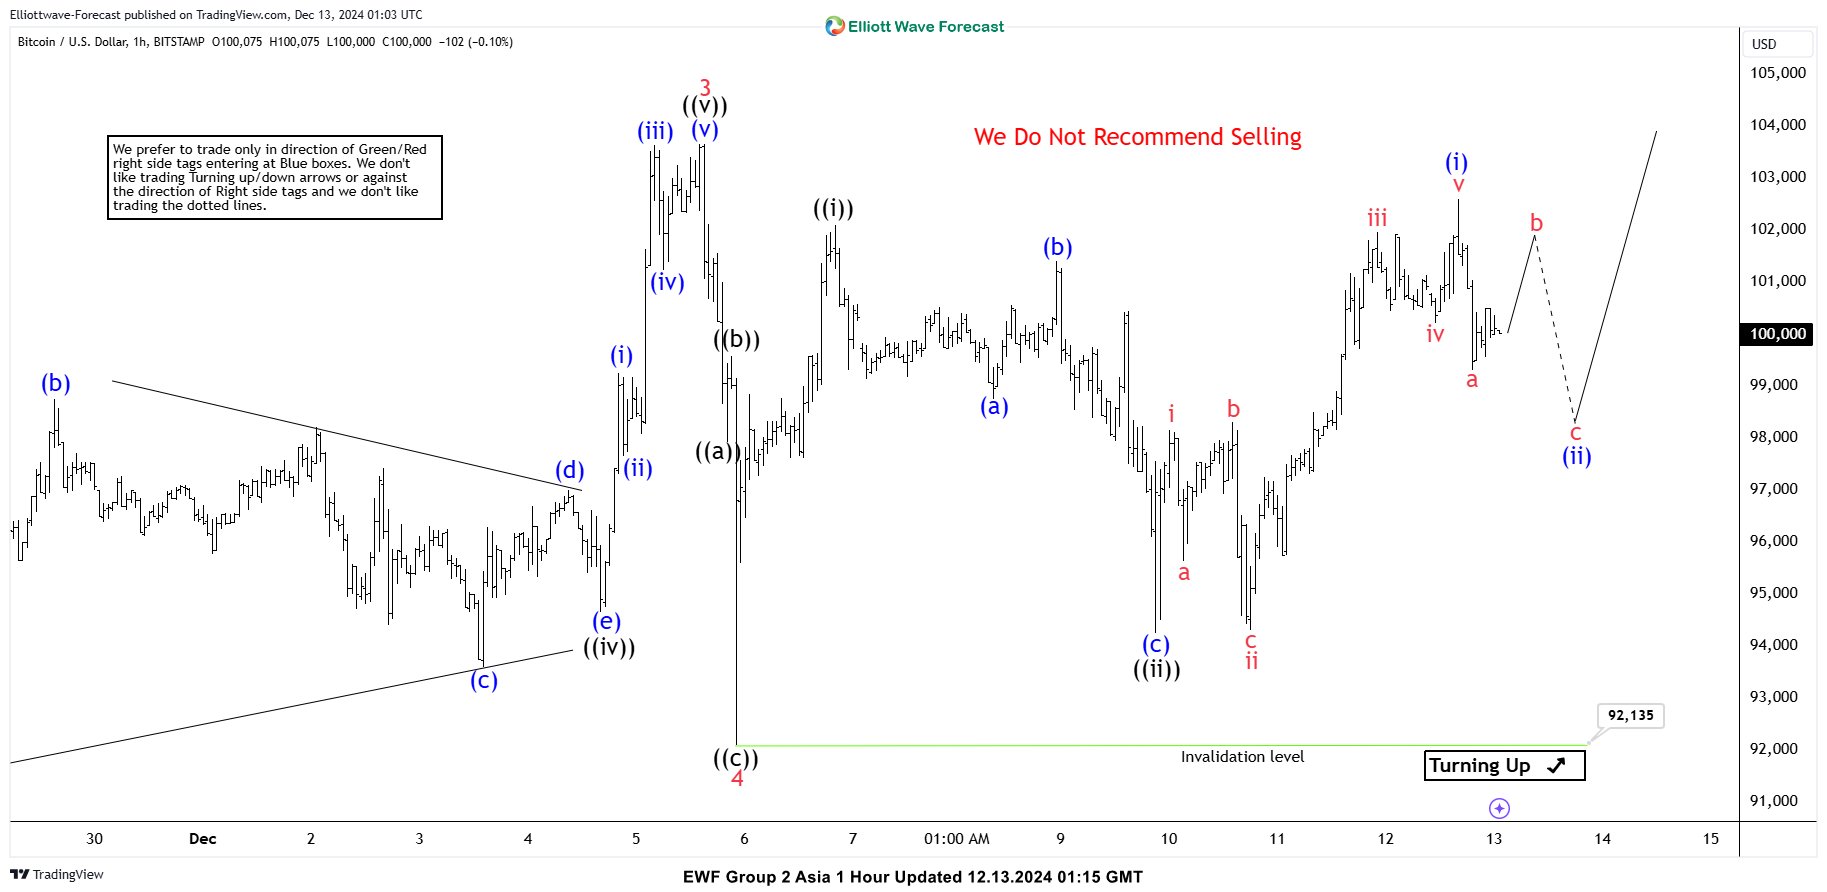
BTCUSD Elliott Wave 1 Hour Chart 12.13.2024
Bitcoin held above the 94275 low and rallied further, as expected. The current view suggests that we completed a 5-wave rally from the 94275 low, labeled as (i) blue. We may see a 3-wave pullback toward the 50-61.8% Fibonacci zone, around 98392-97406, before more upside. The next target area to the upside is between 106326 and 110716.
Ethereum (ETHUSD) Forecast: Anticipating the Rally After a 3-Wave Pullback
Hello fellow traders. In this technical article we’re going to take a quick look at the Elliott Wave charts of Ethereum (ETHUSD) , published in members area of the website. As many of our members are aware, the crypto is showing impulsive bullish sequences in the cycle from the August 2024low , that are calling for a further strength. In the further text we are going to explain the Elliott Wave Analysis.
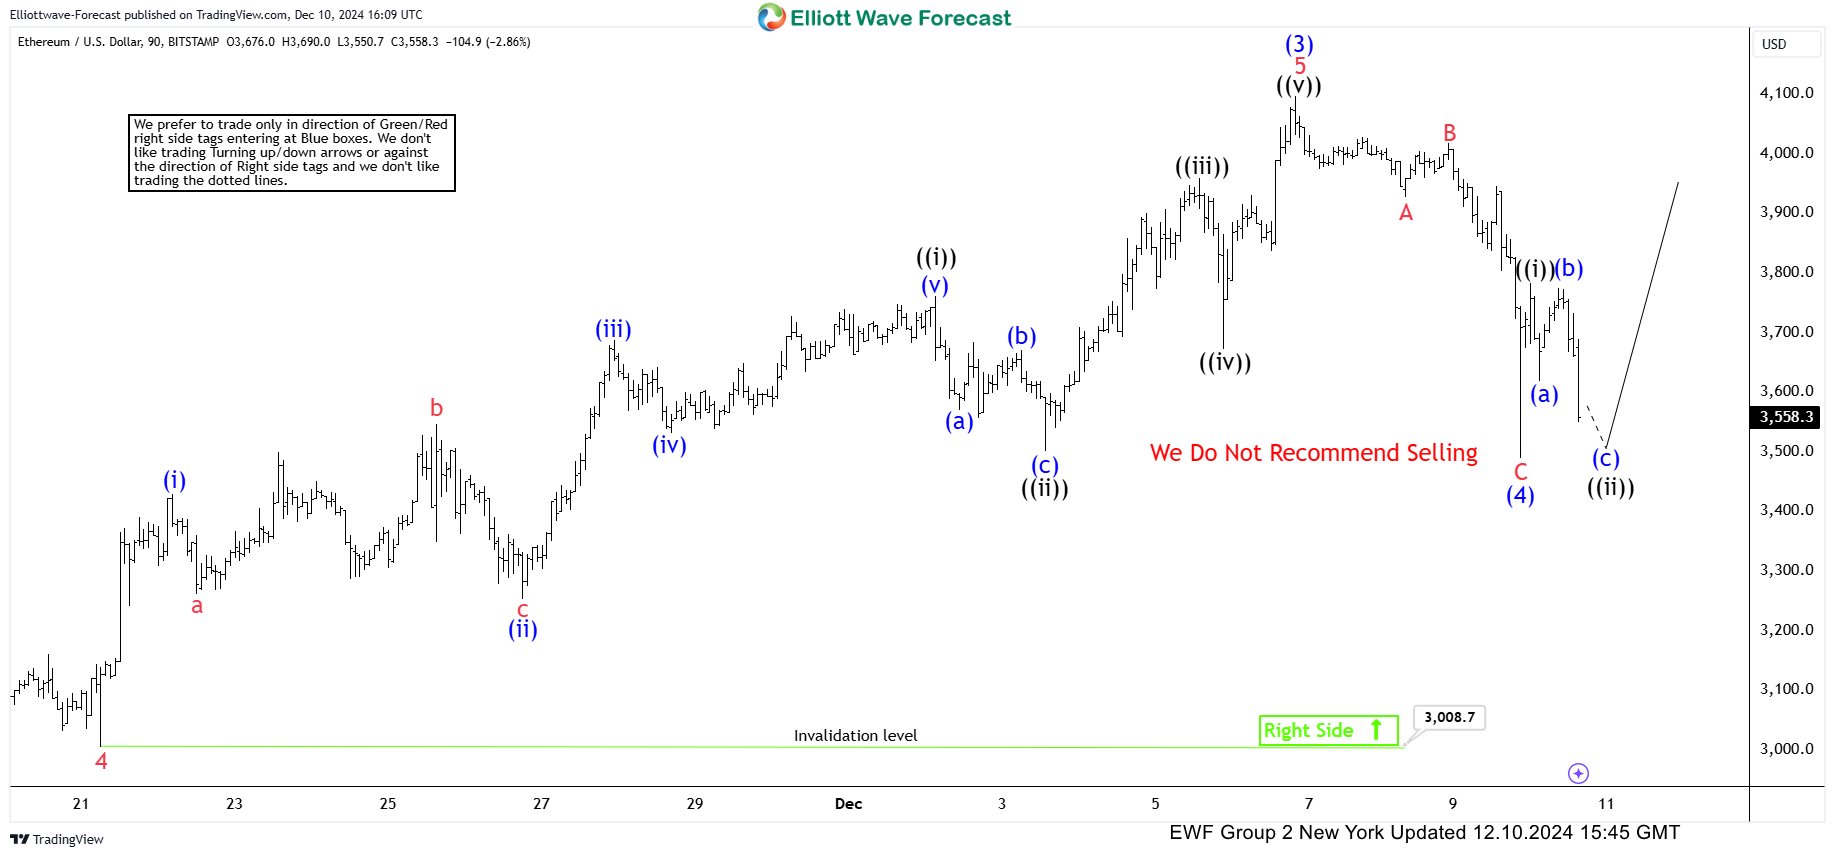
ETHUSD Elliott Wave 1 Hour Chart 12.10.2024
ETHUSD completed wave 4 (blue) at the 3490 low, forming Elliott Wave Zig Zag pattern. Currently, we are close to completing the intraday pullback ((ii)) (black). As long as the price stays above the 3490 low, we expect further strength in the crypto. This could potentially lead to new highs. We advise against selling and prefer the long side.
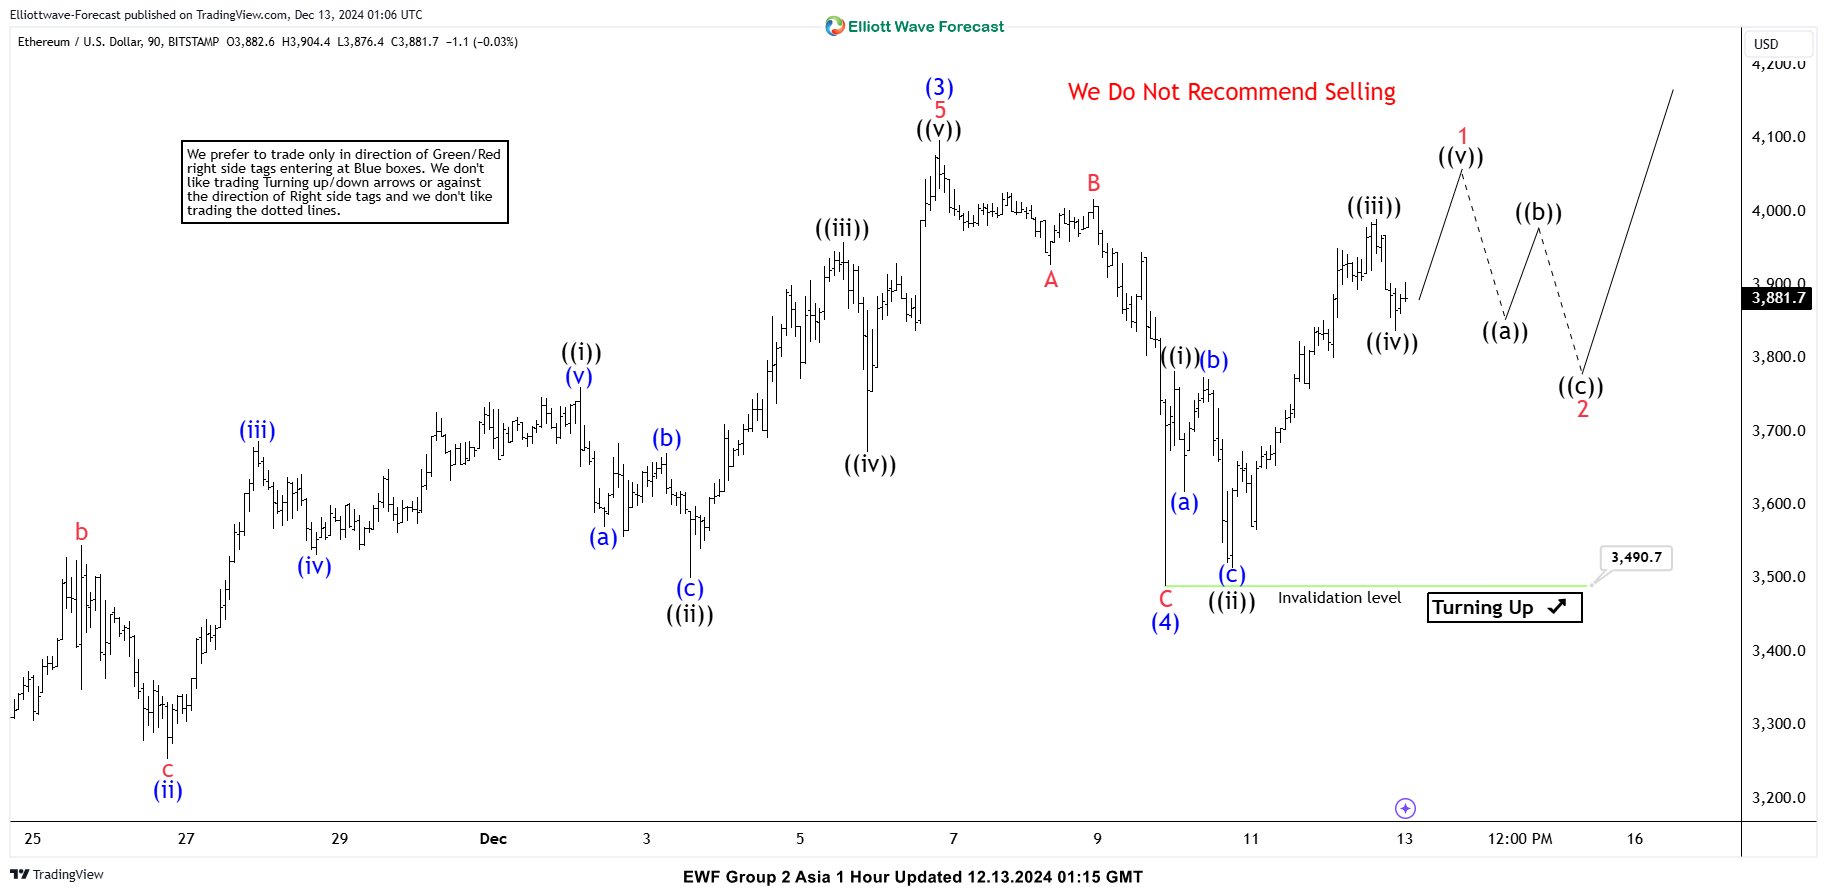
ETHUSD Elliott Wave 1 Hour Chart 12.13.2024
Ethereum held above the 3490 low and rallied further, as expected. The current view suggests that we’ve completed 3 waves up so far. Another high would be ideal to complete the 5-wave cycle from the 3490 low. A break above the (3) blue peak (the December 6th high) would confirm that the next leg up is in progress. After this break, we can look to buy intraday dips again in the 3, 7, and 11 swings.
Cable Dips Further After Weak UK Data, Consolidation May Precede Fresh Push Lower
GBPUSD fell further on Friday, holding in red for the third consecutive day, driven by stronger dollar and additionally pressured by unexpectedly weak UK Oct GDP numbers.
Fresh weakness tested support at 1.2618 (last week’s low / 100WMA) and pressure nearby Fibo support at 1.2610 (61.8% retracement of 1.2487/1.2811 upleg), where bears faced headwinds.
Near term action may pause for consolidation, before renewed attack at 1.2618/10 pivots, loss of which to open way towards next targets at 1.2563/40 (Fibo 76.4% / lower 20-d Bollinger band) and expose key short-term supports at 1.2500 / 1.2487 (psychological / Nov 22 low).
Initial resistance lays at 1.2673 (20DMA) guarding 1.2700/11 (psychological / falling 10DMA) which should cap upticks and keep near-term bears in play.
Daily studies are predominantly negative (MA’s in bearish setup / south-heading 14-d momentum is approaching the centreline) with additional negative signals from weekly chart (reversal pattern is forming / converging 10/200WMA about to form death-cross).
Res: 1.2673; 1.2711; 1.2735; 1.2750
Sup: 1.2619; 1.2563; 1.2500; 1.2487
Sunset Market Commentary
Markets
European yields and the euro today gained minor further ground after succeeding an intraday reversal yesterday after the ECB 25 bps cut (to 3.0%). First post-meeting comments from ECB policy makers confirmed that more easing will follow. Internal debate on the pace (Kazaks still keeps the door open for a bigger step) and the end-point continues (Villeroy sees bets on 100 bps + easing as reasonable). Still, gradualism apparently is seen guiding ECB policy for now (Centeno, amongst others). Comments didn’t change the recent tentative bottoming in EMU yields. German yields today add between 1.0 bps (2.0-y) and 2.5 bps (10-y). US yields show a broadly similar pattern (2-y + 1.5 bps; 30-y +2.5 bps) as markets are counting down to next week’s FOMC meeting. French president Macron naming François Bayrou as new Prime minister (cf infra) had only limited impact on markets. The euro initially also tried a (corrective?) rebound. EUR/USD intraday filled offers in the 1.052 area, but the move ran into resistance as US traders joined (currently 1.05). The 1.0335 support survives going into the weekend. The yen underperformed. The BOJ Tankan report published this morning was ok, but it wasn’t able to counterbalance market rumours that the BOJ considers to wait with a rate hike at next weeks policy meeting. UD/JPY extends its recent rebound (153.4). Equities in EMU (Eurostoxx 50 and S&P 500 +0.3%) show modest gains. Oil also gains marginally ($ 73.6 p/b).
Sterling of late outperformed the euro as it was considered avoiding/being less sensitive to a long range of negative developments that haunted the single currency. However, a set of mixed UK data grabbed the market focus today. According to UK GFK confidence, UK consumers turned a bit more optimistic on their personal financial situation, but still have low confidence on the overall UK economy, currently and in the year ahead. UK monthly production (October) was unexpectedly weak (-0.6% M/M after already a 0.5% monthly decline in September). Services and construction output also disappointed resulting in a -0.1% monthly GDP estimate. Mid-morning, the BOE/Ipsos inflation attitudes survey showed that consumers assessed current inflation to have declined (4.8% from 5.2% in August), but expectations on future inflation rose again for all time horizons (3.0% from 2.7% 12 months ahead, 2.8% from 2.6% in the following year and 3.4% to 3.2% long term). Weak activity and high inflation expectations for sure isn’t something for the BoE to feel comfortable about. UK yields currently trade marginally higher (1 bp across the curve), but doesn’t help sterling. EUR/GBP earlier this week looked like preparing a real test of the key 0.8203 2022 low. Today’s data apparently provided the perfect mix for investors to scale back some EUR/GBP shorts. The pair jumped from 0.826 to currently test the 0.83 big figure, admittedly with some minor support from the euro, too.
News & Views
Fresh Bundesbank forecasts suggest the German economy will barely grow next year after having contracted this year. 2024 forecasts were lowered form a 0.3% growth prediction in June to -0.2% while output next year would expand by just 0.2% (vs 1.1% earlier). The Bundesbank does not exclude another year of negative growth if president-elect Trump makes good on his tariffs threats. If he would slap a 10% levy on European imports and 60% on Chinese goods, Buba estimates this could knock between 0.2-0.6 ppts of GDP next year. “The German economy is not only struggling with persistent economic headwinds, but also with structural problems,” Bundesbank President Joachim Nagel said, adding that the labour market is now also showing signs of finally succumbing. Growth for 2026-2027 is seen at 0.8% and 0.9%. Inflation would ease from 2.5% this year to 2.4-2.1-1.9% in the following years.
French president Macron announced François Bayrou as France’s new prime minister. His predecessor Michel Barnier, presiding over a minority government, was ousted last week in a no-confidence vote after pushing through a budget bill that angered the opposition from (far) left and right. Bayrou is a centrist politician with a market-oriented view of the economy but equally supports social measures such as taxing the wealthy. His appointment, however, immediately drew oppositional backlash from all sides of the political spectrum. It suggests his task of addressing France’s derailed public finances won’t be much easier than Barnier’s. Assuming unrelenting opposition from the political extremes, Bayrou will need support of the Socialists and perhaps the Greens without alienating the right-wing flank to pass a budget. France budget deficit is expected at 6% of GDP this year, double the 3% EU limit.
USD/JPY Mid-Day Outlook
Daily Pivots: (S1) 152.05; (P) 152.41; (R1) 153.03; More...
USD/JPY's rally from 148.64 is still in progress, and intraday bias stays on the upside for retesting 156.75. Firm break there will confirm resumption of whole rally from 139.57. On the downside, below 151.79 minor support will turn intraday bias neutral first. But risk will stay on the upside as long as 148.64 support holds, in case of retreat.
In the bigger picture, price actions from 161.94 are seen as a corrective pattern to rise from 102.58 (2021 low). The range of medium term consolidation should be set between 38.2% retracement of 102.58 to 161.94 at 139.26 and 161.94. Nevertheless, sustained break of 139.26 would open up deeper medium term decline to 61.8% retracement at 125.25.
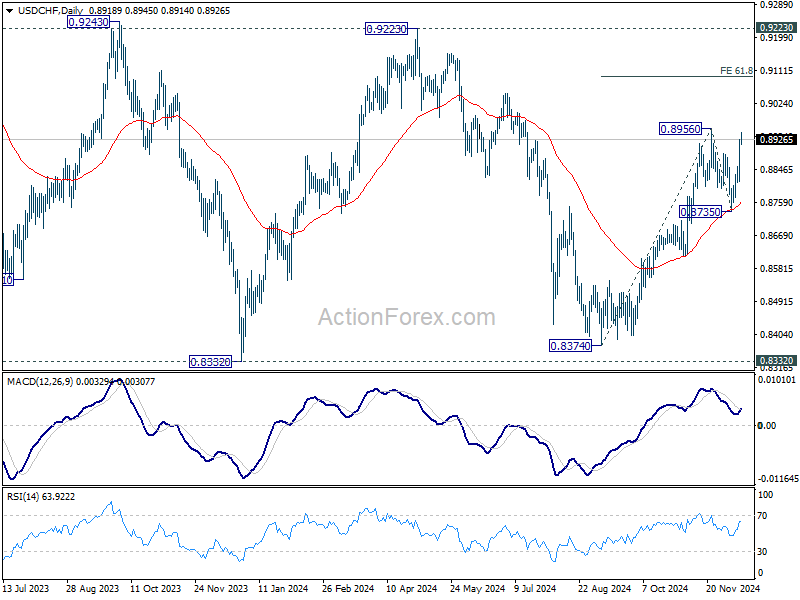
USD/CHF Mid-Day Outlook
Daily Pivots: (S1) 0.8851; (P) 0.8890; (R1) 0.8962; More…
Intraday bias in USD/CHF remains on the upside for the moment. Firm break of 0.8965 resistance will resume the whole rally from 0.8374. Next target is 61.8% projection of 0.8374 to 0.8956 from 0.8735 at 0.9095. On the downside, below 0.8866 minor support will turn intraday bias neutral first. But risk will stay on the upside as long as 0.8735 support holds, in case of retreat.
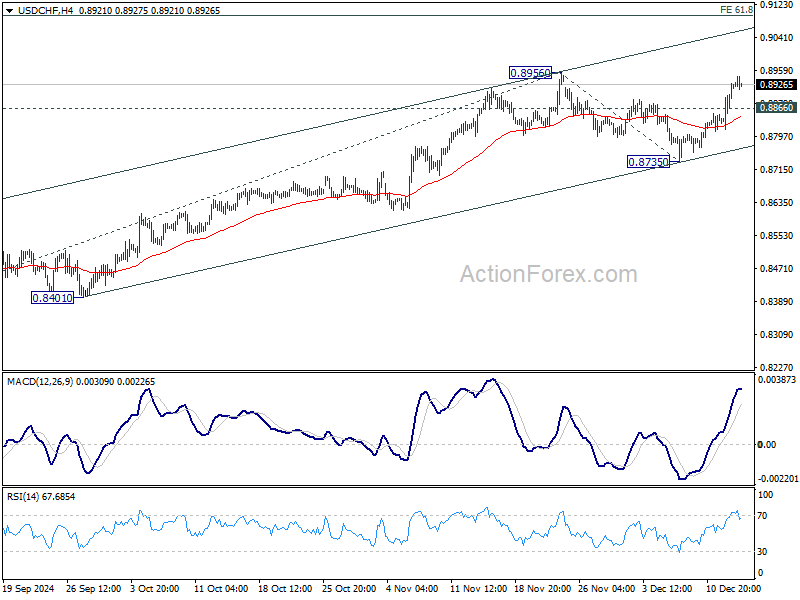
In the bigger picture, price actions from 0.8332 (2023 low) are currently seen as a medium term corrective pattern, with rise from 0.8374 as the third leg. Overall outlook will continue to stay bearish as long as 0.9223 resistance holds. Break of 0.8332 low is in favor at a later stage when the consolidation completes.