Sample Category Title
Dollar Recovers With Eyes on Trump’s Plan, North Korea Tension Escalates
Dollar strengthens broadly today as markets are eagerly awaiting US President Donald Trump's tax reform plan. Dollar index is back above 99 after dipping to as low as 98.69 earlier this week. Meanwhile, stocks are also looking for fresh stimulus as DJIA and S&P 500 are looking at making new records highs. On the other hand, Euro and other European majors are paring some gains as the boost from French election fades. Euro traders are also getting cautious ahead of tomorrow's ECB rate announcement and press conference. The Japanese Yen stays soft, except versus Aussie and Kiwi, as tensions in North Korea escalates. Canadian Dollar, on the other hand, is recovering mildly despite weak retail sales.
Trump administration to deliver tax reform
All eyes are on what US President Donald Trump would deliver regarding his tax reforms today. There are talks that Trump would push to lower public companies' income tax rate to 15%, down from 35%. Besides, there would be cut on top tax rate on "pass through" businesses, from 39.6% to 15%. And there would also be tax rate cut on offshore earnings which are repatriated, down from 35% to 10%. Meanwhile, there won't be a so called "border-adjustment" tax on imports. Treasury Secretary Steven Mnuchin and National Economic Director Gary Cohn are scheduled to have a joint pressure conference around 1:30pm ET today, from the White House Briefing Room.
North Korea tensions escalate
It's reported that the US military has started installing the THAAD system in South Korea, to protect against threats from North Korea, ahead of the election day of the former on May 9. Hundreds of residents protested against such installation around 250km south of Seoul. In Seongju, there were protestors carrying signs reading "No THAAD, No War" and "Hey, US! Are you friends of occupying troops". And they are worried that such installation would indeed increase the risks of the area they live being targeted by North Korea.
In China, the foreign ministry spokesman Geng Shuang said "China strongly urges the United States and South Korea to stop actions that worsen regional tensions and harm China's strategic security interests and cancel the deployment of the THAAD system and withdraw the equipment." Geng warned that "China will resolutely take necessary steps to defend its interests."
In Japan, the Cabinet Secretariat Civil Protection Portal Site warned that "Japan is facing urgent new threats to peace and security and diverse situations, including the proliferation of weapons of mass destruction and ballistic missiles." Visit to the site surged to 5.7m this month as the Japanese are getting more concerned with the geopolical risks. Meanwhile, civilians will be warned in case of a nuclear attack. And they will have 10-minute to hide underground in case.
BoJ watched in upcoming Asian session
BoJ monetary policy announcement will be the main focus in the upcoming Asian session. The central bank is widely expected to keep policies unchanged. Meanwhile, it's expected that BoJ would lower inflation forecast in the quarterly Outlook for Economic Activity and Prices report, to be released after the policy announcement. But the central bank may upgrade growth forecast. In January forecast, BoJ projected core CPI to hit 1.5% yoy in this fiscal year. But core CPI is currently standing at 0.2% yoy in February with weak momentum in price growth. On the other hand, IMF raised Japan's growth forecast to 1.2% in 2017, up from January estimate of 0.8%. BoJ could share similar view.
Euro lose momentum ahead of ECB
ECB meeting will be another focus tomorrow. The first round result of French presidential election, and centrist Emmanuel Macron's high chance of winning the run-off should give ECB much relief. Nonetheless, the central bank is still not ready to hint on any stimulus exit yet. ECB President Mario Draghi has stressed enough that there are much downside risks to the economy, and underlying inflation stayed low. Risks are still tiled much to the downside in spite of the French election results. Meanwhile, various ECB officials have clearly expressed that the course of monetary policies are set for 2017. The central bank will continue with its EUR 60b per month asset purchase till the end of the year. And it's unlikely that policy makers will opt for a rate hike before the asset purchase ends. We'd expect the speculation and debate on exit to start heating up again in June. For now, tomorrow's announcement and press conference will likely be status quo.
Australian CPI back in RBA's target range
Australia CPI rose 0.5% qoq and 2.1% yoy in Q1, up from prior quarter's 0.5% qoq, 1.5% yoy. But missed expectation of 0.6% qoq, 2.2% yoy. That's the first time inflation is back in RBA's target range since 2014. RBA said earlier this month that it expected headline inflation to pick up over the course of 2017. However, it also expected that recovery in underlying inflation to be "a bit more gradual" due to subdued wage growth. Trimmed mean CPI rose to 1.9% yoy, up from 1.6% yoy and beat expectation of 1.8% yoy. Weighted median CPI rose to 1.7% yoy, up from 1.5% yoy, but missed expectation of 1.8% yoy.
Elsewhere...
Canada retail sales dropped -0.6% mom in February versus expectation of 0.2% mom. Ex-auto sales dropped -0.1% mom versus expectation of -0.3% mom. Swiss UBS consumption indicator was unchanged at 1.5 in March. Japan all industry activity index rose 0.7% mom in February.
USD/CHF Mid-Day Outlook
Daily Pivots: (S1) 0.9911; (P) 0.9940; (R1) 0.9962; More.....
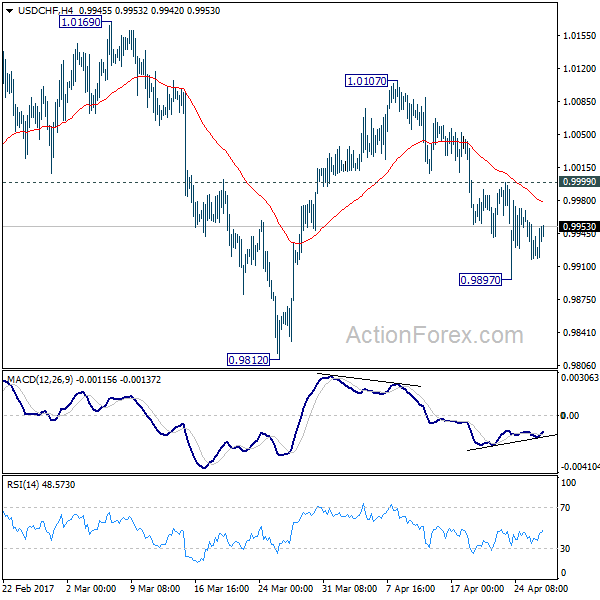
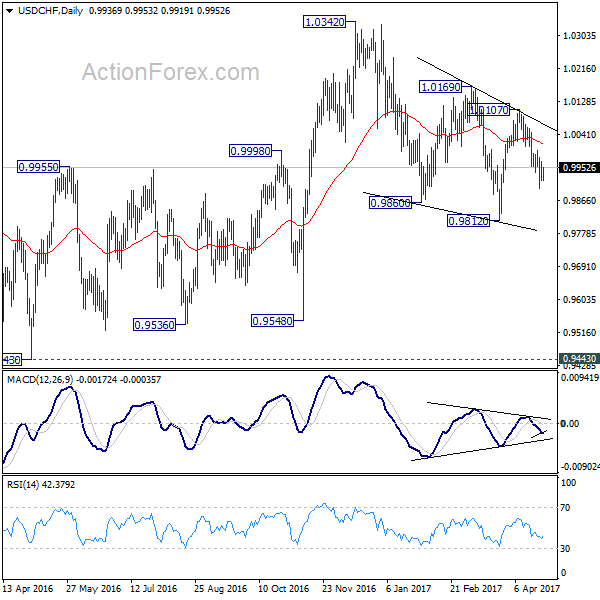
Intraday bias in USD/CHF is neutral for the moment with 4 hour MACD trending up. At this point, with 0.9999 minor resistance intact, deeper fall is still in favor. Below 0.9897 temporary low will turn bias to the downside for 0.9812 and possibly below. Nonetheless, whole decline from 1.0342 is seen as a correction. Hence, we'll look for bottoming signal below 0.9812. Meanwhile, on the upside, above 0.9999 minor resistance will turn bias back to the upside for 1.0107 resistance.
In the bigger picture, we're still maintaining that firm break of 1.0342 key resistance is needed to confirm underlying bullish momentum in the cross. However, the corrective nature of the fall from 1.0342 is starting to give the medium term outlook a bullish favor. Hence, in stead of looking for topping signal around 1.0342, we'd now pay closer attention to upside acceleration as USD/CHF approaches this level again.
Economic Indicators Update
| GMT | Ccy | Events | Actual | Forecast | Previous | Revised |
|---|---|---|---|---|---|---|
| 01:30 | AUD | CPI Q/Q Q1 | 0.50% | 0.60% | 0.50% | |
| 01:30 | AUD | CPI Y/Y Q1 | 2.10% | 2.20% | 1.50% | |
| 01:30 | AUD | CPI RBA Trimmed Mean Q/Q Q1 | 0.50% | 0.50% | 0.40% | |
| 01:30 | AUD | CPI RBA Trimmed Mean Y/Y Q1 | 1.90% | 1.80% | 1.60% | |
| 01:30 | AUD | CPI RBA Weighted Median Q/Q Q1 | 0.40% | 0.50% | 0.40% | |
| 01:30 | AUD | CPI RBA Weighted Median Y/Y Q1 | 1.70% | 1.80% | 1.50% | |
| 04:30 | JPY | All Industry Activity Index M/M Feb | 0.70% | 0.60% | 0.10% | -0.40% |
| 06:00 | CHF | UBS Consumption Indicator Mar | 1.5 | 1.5 | 1.45 | |
| 12:30 | CAD | Retail Sales M/M Feb | -0.60% | 0.20% | 2.20% | 2.30% |
| 12:30 | CAD | Retail Sales Less Autos M/M Feb | -0.10% | -0.30% | 1.70% | 2.30% |
| 14:30 | USD | Crude Oil Inventories | -1.0M |
S & P 500 Bulls Test Major Resistance Ahead of Trump’s Tax Reform
Last week the US President Trump stated on twitter that he will "unveil his major tax reform plan on Wednesday April 26".
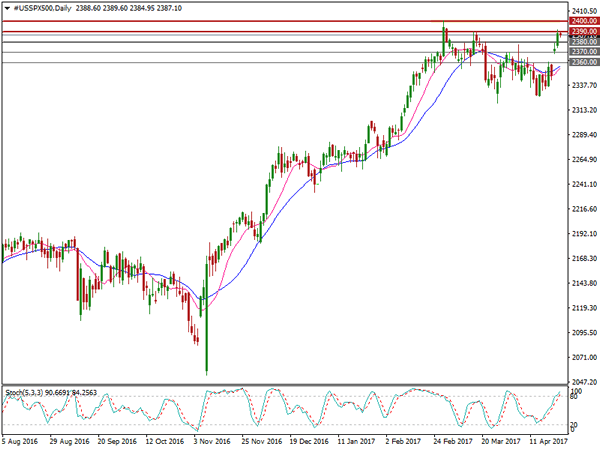
The recent reported US Q1 corporate earnings have been outperformed, pushing US stocks up. Tuesday evening, the Dow Jones index hit a 6-week high of 21022, and the S & P 500 index hit a 8-week high of 2392.15. The S & P 500 index has rallied around 1.7% over the past two days.
The value of US stock markets has reached the highest level since 2004, some investors worry US stocks are overvalued.
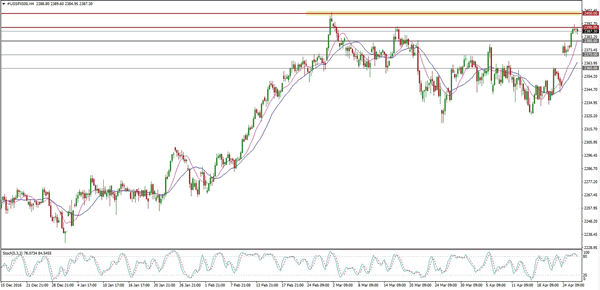
The current trend of the S & P 500 index remains bullish, trading above the 10-day and the 20-day SMAs.
The price is currently nearing the short-term major resistance level at 2400, where there is heavier pressure, we will likely see a consolidation at this area prior to the next move.
The 4-hourly Stochastic Oscillator reading is around 80, suggesting a correction.
The resistance level is at 2390, followed by 2400 and 2410.
The support line is at 2380, followed by 2370 and 2360.
A further 190 S&P 500 listed companies will report earnings this week including some major components such as: Microsoft, Amazon, Intel, and Alphabet. The mega-caps Apple and Facebook will report earnings next week.
Whether the bulls will break the major resistance depends on the performance of the upcoming corporate earnings, Trump's tax reform speech, and whether Trump's tax reform bill could be passed.
Keep a close eye on Trump's announcement, scheduled this afternoon, it will likely cause volatility for USD and US stock markets.
If the resistance level at 2400 is broken, we will likely see the bulls further test the resistance level at 2450.
CAC Steady as Markets Await ECB Rate Decision
The CAC is showing little movement in the Wednesday session. Currently, the index is trading at 5,277. It's another quiet day on the release front, as there are no German or Eurozone indicators on the schedule.
Overshadowed by the French election, the ECB holds a policy meeting on Thursday. No surprises are expected from the cautious central bank. The benchmark rate will likely remain at a flat 0.0%,where it has been pegged since March 2016. With the eurozone showing stronger inflation and growth numbers in the first quarter, there had been speculation that the ECB might taper its asset-purchase program or wind up the program earlier than December. However, the ECB appears in no rush to make any monetary moves, particularly with the current French election and the German election in September.
European stock markets jumped on the weekend, reacting with a thumbs-up to the outcome of the French presidential election. The CEC has also jumped on the bandwagon and remains close to 8-year highs. French voters will have a crystal-clear choice between the two final candidates, who want to take France in very different directions. Emmanuel Macron served as a minister under President Francois Hollande. He favors deregulation and is a staunch supporter of the European Union. Marie Le Pen, who heads the National Front, has campaigned on a 'France first' platform, vowing to curb immigration and take France out of the eurozone. Hollande and Francois Fillon, who ran in the first round, have thrown their support behind Macron and asked voters to reject 'extremism'. Macron is a heavy favorite to win the second round and become president, with polls giving him a comfortable lead of above 60%. Since opinion polls were accurate ahead of the first round of voting, the markets appear to relying on the current polls as well, meaning that the markets have priced in a Macron victory. Unless this sentiment drastically changes during the week, the election will be a non-event for the market. At the same time, nothing is a sure thing in politics, as underscored by the Brexit vote and the election of Donald Trump, two events which stunned the markets and triggered strong market movement.
Will the lights stay on in Washington this weekend? President Trump will have to punch in some overtime this week to avoid a shutdown of the federal government on Saturday. Congress must pass a spending bill which will fund the government until October, but the bill requires the backing of 60 senators. This means that the Republicans (who control 52 seats) will need the support of 8 Democrats. This has led to intensive bipartisan negotiations, and it's reasonable to expect that these talks could go down to the wire, as both sides try to stick to their positions and try not to blink first. The last shutdown was in 2013, lasting 17 days. Another shutdown would be embarrassing for Trump, as it would start on his 100th day in office and would cast doubts on his ability to push his budget and tax plan through Congress.
AUDUSD – Weakens On Bear Pressure
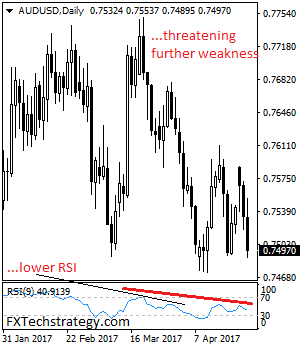
AUDUSD - The pair turned lower on Tuesday and followed through lower on Wednesday. On the downside, support resides at the 0.7450 level where a breach will aim at the 0.7400 level. Below that level will set the stage for a run at the 0.7350 level with a cut through here targeting further downside pressure towards the 0.7300 level. On the upside, resistance lies at the 0.7550 level. A cut through here will turn attention to the 0.7600 level and then the 0.7650 level where a violation will set the stage for a retarget of the 0.7700 level. On the whole, AUDUSD remains biased to the downside.
Trade Idea: GBP/USD – Buy at 1.2710
GBP/USD – 1.2822
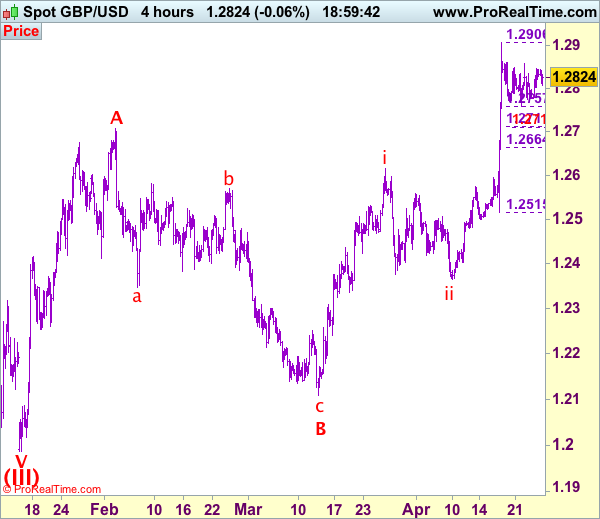
Recent wave: Wave V of larger degree wave (III) has ended at 1.1986 and major correction has commenced from there for gain to 1.3000 and 1.3140-50
Trend: Near term up
Original strategy :
Buy at 1.2710, Target: 1.2910, Stop: 1.2650
Position: -
Target: -
Stop: -
New strategy :
Buy at 1.2710, Target: 1.2910, Stop: 1.2650
Position: -
Target: -
Stop:-
Although cable found support at 1.2772 earlier this week and recovered, a break above indicated resistance at 1.2859 is needed to signal the pullback from 1.2906 has ended instead, bring further gain to 1.2870, then retest of 1.2906. If said resistance continues to hold, then further consolidation would take place and risk of another corrective fall to 1.2757 (38.2% Fibonacci retracement of 1.2515-1.2906) remains, however, reckon 1.2710 (50% Fibonacci retracement as well as 100% projection of a leg from1.2906) would limit downside and bring another rise later. We are keeping our view that the wave c as well as larger degree wave B has ended at 1.2109, hence impulsive wave C has commenced from there with wave i of C ended at 1.2616, follow by a correction to 1.2365 (end of wave ii) and wave iii rally is unfolding, hence further gain to 1.2940-50 and possibly psychological resistance at 1.3000 would be seen, however, near term overbought condition should limit upside to 1.3050-60.
Our preferred count on the daily chart is that cable's rebound from 1.3500 (wave (A) trough) is unfolding as a wave (B) with A ended at 1.7043, followed by triangle wave B and wave C as well as wave (B) has ended at 1.7192, the subsequent selloff is the larger degree wave (C) which is still unfolding with minor wave (III) of larger degree wave 3 ended at 1.1986, hence wave (IV) correction is in progress which could either be a triangle wave (IV) of a complex formation but upside should be limited to 1.3500 and price should falter well below 1.4000, bring another decline in wave (V) of 3 for weakness to 1.1500, then 1.1200.
On the downside, whilst initial pullback to 1.2750-55 is likely, reckon downside would be limited and 1.2700-10 (50% Fibonacci retracement of 1.2515-1.2906) should contain weakness and bring another rally later. Below 1.2690-00 would defer and risk correction to 1.2660-65 but another previous resistance at 1.2616 (wave i top) should remain intact.
Trade Idea: GBP/JPY – Buy at 141.70
GBP/JPY - 142.55
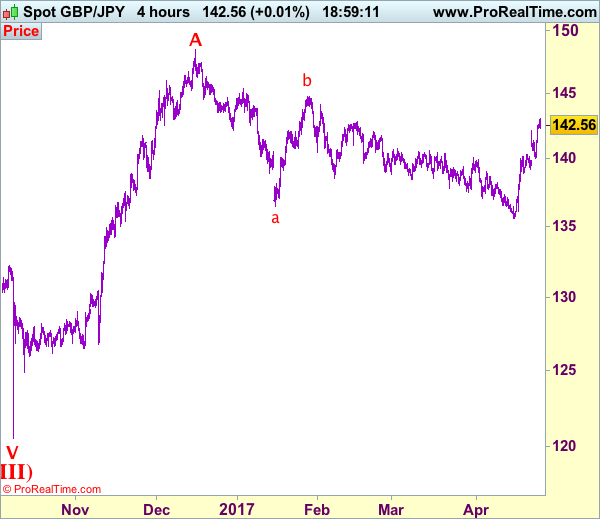
Recent wave: Medium term low formed at 120.50 and (A)-(B)-(C) major correction has commenced with (A) leg ended at 148.45, hence wave (B) is unfolding for retreat to 131.00-10.
Trend: Near term up
New strategy :
Buy at 141.70, Target: 143.70, Stop: 141.00
Position: -
Target: -
Stop:-
Sterling found renewed buying interest at 140.10 and has rallied, the breach of previous resistance at 142.10 confirms recent upmove from 135.60 has resumed and upside bias remains for this move to extend further gain to 143.40-50, then towards 144.00-10, however, near term overbought condition should prevent sharp move beyond latter level and reckon previous chart resistance at 144.75 would remain intact, bring retreat later.
In view of this, would not chase this rise here and would be prudent to buy sterling on pullback as 141.60-70 should limit downside. Below 141.10-20 would defer and suggest top is possibly formed, risk correction to 140.55-60 but only break of said support at 140.10 would provide confirmation, bring retracement of recent rise instead.
Our preferred count is that larger degree wave V with circle is unfolding from 251.12 with wave (I) 219.34, (II): 241.38 and wave (III) is subdivided into 1: 192.60, 2: 215.89 (23 Jul 2008) and wave 3 ended at 118.87 earlier in 2009. The correction from there to 162.60 is wave 4 which itself is a double three and is labeled as first a-b-c ended at 151.53, followed by wave x at 139.03, 2nd a ended at 162.60, 2nd b at 146.75 and 2nd c leg of wave 4 ended at 163.00. Therefore, the decline from 163.00 to 116.85 is now treated as wave 5 which also marked the end of larger degree wave (III), hence wave (IV) major correction has commenced for retracement of the wave (III) from 241.38 and upside target at 183.95-00 (50% Fibonacci retracement of the wave (II) from 241.38) had been met, a drop below 160.00 would suggest wave (IV) has ended at 195.85, bring decline in wave (V) for initial weakness to 130 (already met) and 120.
Trump’s Tax Trade And Spend Defines Dollar Direction
Global equity indexes have continued their rally that started the week on renewed confidence in Eurozone stability and strong earnings data expectations. This newfound confidence has global yields backing up and the 'big' dollar in demand for a third consecutive day.
President Trump is expected to unveil his tax plan tomorrow that would cut the upper corporate rate to +15%. If he is short on detail and lacks substance, this market will quickly reverse course.
Other risks remain as investors await central bank meetings tomorrow from the BoJ and ECB. Tensions around North Korea continue to simmer, while in China, concerns of a crackdown from regulators have left the world's second-largest equity market trading atop its 2017 low.
1. Asian stocks near two-year high on U.S optimism, Europe mixed
Asian stocks extended their gains for a fifth consecutive day overnight, as renewed optimism about the U.S economy has brightened the outlook for risky assets.
In Japan, the Nikkei share average closed at a one-month high, lifted by a weaker yen (¥111.17) and a record high for the Nasdaq Composite. The index is up +3.6% for the week, and climbed +2% last month. The broader Topix index rose +1.2%, climbing for a fifth straight session for the longest winning streak this year.
Australia's S&P/ASX 200 Index added +0.7% and New Zealand's S&P/NZX 50 Index increased +1.6%, the most in six-months, as both markets reopened after ANZAC day.
In China, the Shanghai Composite Index added +0.2% after climbing a similar amount yesterday.
In Europe, equity indices are trading mixed as market participants await President Trump's tax reform plans. Banking stocks are generally lower across the board adding to losses on the Eurostoxx, while commodity and mining stocks are trading mixed in the FTSE 100.
U.S stocks are set to open small down (-0.1%).
Indices: Stoxx50 -0.2% at 3,577, FTSE flat at 7,277, DAX flat at 12,465, CAC-40 +0.1% at 5,280, IBEX-35 -0.2% at 10,758, FTSE MIB -0.6% at 20,687, SMI +0.2% at 8,793, S&P 500 Futures -0.1%.
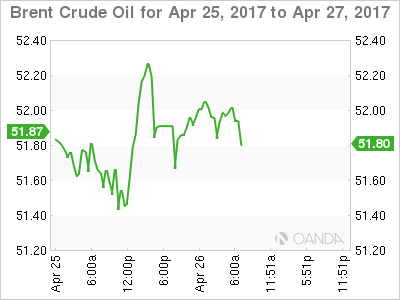
2. Oil price slips on bulging U.S stocks, ample global supplies
Oil prices have weakened further overnight as yesterday's U.S inventory data showed a rise in crude stocks. Coupled with record supplies in the rest of the world is casting further doubt over OPEC's ability to control output and tighten the market.
Brent crude futures have eased -3c to +$52.07 per barrel, down around -8.5% below this months peak. U.S West Texas Intermediate (WTI) is trading down -4c at +$49.52 per barrel, after gaining +0.7% in yesterday's session. The WTI price has fallen for seven of the past eight sessions.
API inventory data, issued late Tuesday, is weighing on prices. Not only did the report show crude oil stocks rising +897k barrels in the week to April 21 (vs. an expected drawdown of -1.71m barrels), but it also showed a large build in gasoline stocks, unusual for this time of the year.
Should these figures be mirrored by today's EIA report (10:30 am EST), expect the weaker bulls to offload some of their long contract positions.
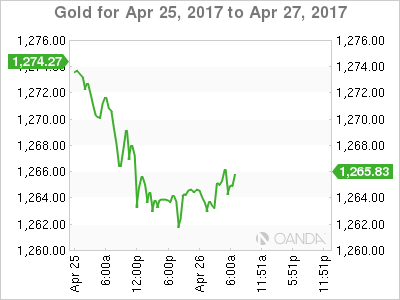
Ahead of the U.S open, gold prices have dipped to a new two-week low (-0.2% to +$1,261.36 per ounce) as increased investor appetite for 'risk' has dulled the demand for safe-haven assets. The current rally in 'real' interest rates should see the yellow metal come under further short-term pressure.
3. Global yields back up on Trump expectations
Across the curve, gains in U.S interest rates are expected if the Trump's tax plan includes reductions on repatriated earnings. Investors can expect the short end to harden the quickest, more in anticipation of corporate treasuries' divestment of short product ahead of any repatriation.
Yesterday's U.S Treasury bill auction results: +$60B four-week bill auction draw was +0.735%, bid-to-cover was 3.32; +$20B 52-week bills draw was 1.060%, BTC 3.23 – four-week +21.8% allotted at the high – 52-week +7.2% allotted at the high.
The yield on U.S 10's is little changed at +2.33%, after climbing for five straight sessions.
Elsewhere, Aussie 10-year debt saw yields back up +3 bps to +2.63%, French 10-year yields have fallen -1 bps to +0.90%, after advancing +7 bps yesterday.
Note: The bearish sentiment in 10-year German Bunds is not expected to subside until yields rise above +0.4%. Fears of reduced ECB accommodation are still at play. Bund yields have surged from a low of +0.156% before the French vote last week to +0.385%.
4. Dollar partially in vogue
The USD is a tad firmer heading into the U.S open. The markets focus now turns to the details on the Trump administration's tax reform plan.
The demand for dollars got a boost late yesterday as reports indicated that Trump would provide an incentive to repatriate accumulated foreign profits for U.S companies.
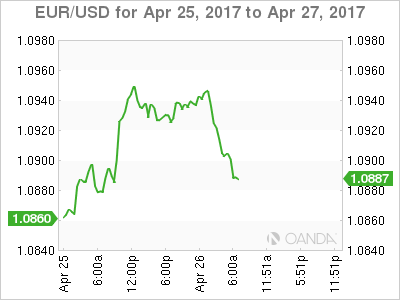
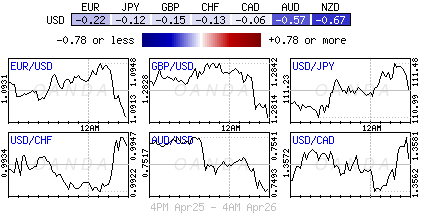
The EUR (€1.0900) outright did manage to print a fresh six-month high overnight at €1.0950, mostly aided by receding concerns about the risks posed by the French presidential election. The ECB sets its monetary policy tomorrow. With officials indicating little chance of a policy change, the focus will be on any signals from President Mario Draghi that the ECB is starting to discuss an exit from its extraordinary stimulus.
USD/JPY has continued its winning streak, as the yen has slipped -0.3% to ¥111.45, after dropping -1.2% yesterday. The currency is down -2.7% from a five-month high reached last week. The BoJ is expected to keep the settings on its monetary easing program unchanged at the end of a two-day policy meeting tonight.
5. Australia CPI returns to RBA target range
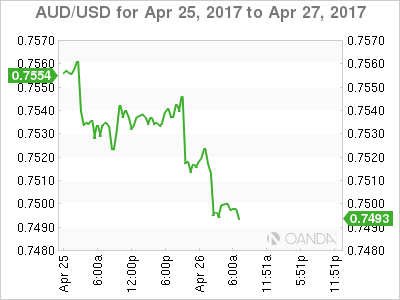
The AUD (A$0.7497) was volatile in the overnight session following the mixed Q1 CPI data. The headline year-on-year moved back into the RBA's +2-3% target range for the first time in two-years, however, it missed expectations.
Q1 CPI – Q/Q: +0.5% vs. +0.6%e; Y/Y: +2.1% (highest since Q2 of 2014) vs. +2.2%e.
Analysts noted that much of the price increase was in auto fuel and housing, which may suggest that living costs are outpacing wage gains. Consensus does not expect an RBA rate cuts after the data, but believe that when CPI is consistently above +2% Aussie policy makers would signal a policy shift.
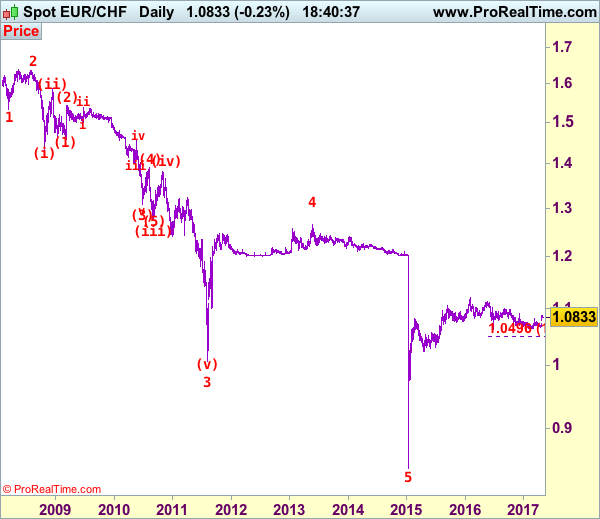
EUR/CHF Elliott Wave Analysis
EUR/CHF : 1.0686
EUR/CHF: Major wave 5 trough ended at 0.8426 and correction has commenced from there for subsequent gain towards 1.1400-1.1500.
Although the single currency fell to as low as 1.0656 early last week, euro found decent demand there and has rallied, the pair opened higher this week and surged to as high as 1.0870, suggesting low has been formed at 1.0631 (Feb low) and consolidation with upside bias is seen for further gain to previous resistance at 1.0898, break there would provide confirmation and encourage for headway to 1.0950, then test of previous resistance at 1.0977 which is likely to hold on first testing.
To recap our preferred count, the decline from 1.6828 (end wave (B)) is labeled as the beginning of wave (C) which should unfold as an impulsive move with 1: 1.5326, 2: 1.6377 and wave 3 is sub-divided into (i): 1.4300, (ii): 1.5880 and wave (iii) is still unfolding with (1): 1.4577, (2): 1.5448 and wave (3) is an extended 3rd with i: 1.5006, ii: 1.5383, wave iii: 1.3073, then wave iv ended at 1.3925 and wave v at 1.3073, wave (4) ended at 1.3925 and wave (5) has ended at 1.2765 which also marked the low of wave (iii) and wave (iv) has ended at 1.3835 and wave (v) as well as larger degree wave 3 has ended at 1.0075. The selloff from 1.2650 signals wave 4 has ended there and we are taking a view that the wave 5 could also have ended 0.8426, hence consolidation is seen with mild upside bias for rebound to 1.1000 first, then towards 1.1400.
On the downside, whilst pullback to 1.0800 cannot be ruled out, reckon 1.0760-70 would limit downside and bring another rise later. Only below previous minor resistance at 1.0720 would abort and suggest top is formed instead, risk weakness towards said support at 1.063. Looking ahead, a drop below previous support at 1.0622 is needed to confirm early erratic decline from 1.1201 (2016 high) has resumed, bring subsequent selloff to 1.0550 and possibly towards 1.0500.
Recommendation: Buy euro at 1.0770 for 1.0970 with stop below 1.0670.
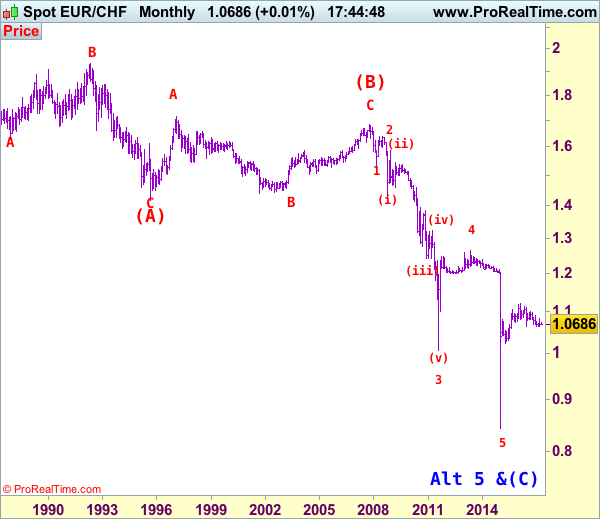
The long-term downtrend started from 1.9626 (Apr 1985) to 1.4166 (Sep 1995) is treated as wave (A) with A:1.6285 (Dec 1987), B: 1.9342 (May 1992) and C: 1.4166, then wave (B) ended at 1.6828 with A: 1.7147 (Feb 1997), B: 1.4398 (Sep 2001), C: 1.6828 (Nov 2007), therefore, wave (C) is now in progress with the breakdown indicated as above. This wave (C) already met indicated downside target at 1.1455/60 and 1.1300, it could have ended at 0.8426, consolidation with mild upside bias is seen for gain to 1.1000 and later towards 1.2000.
Sterling, Trump And Gold In Focus
FXTM Research Analyst Lukman Otunuga comments on Sterling ahead of the UK general election and Trump's anticipated “phenomenal” tax reforms and the Dollar.
The Brexit-related jitters may return with a vengeance in the coming weeks if complications arise from the European Union government toughening their negotiation positions. Official Brexit talks have yet to commence, but the EU has already dished out fresh demands, focusing on residency rights and even limits on financial services. While Theresa May continues to suggest that a Conservative victory in the UK general elections in June may bolster her negotiating powers, the repeated demands from the European Union indicates otherwise with the bloc looking to play hardball. May is scheduled for a preliminary Brexit showdown with the President of the European Commission, Jean-Claude Juncker, and the EU's Chief Brexit Negotiator, Michel Barnier, this evening which could be an early test. With the topic of the £50 billion Brexit bill likely to be key in the meeting, this Downing Street dinner could be one to remember.
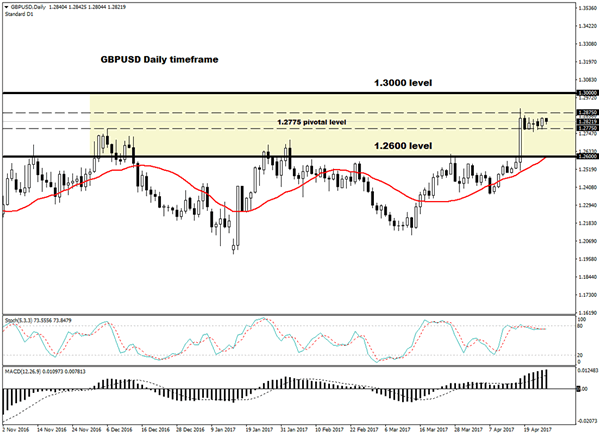
Sterling/Dollar remains trapped in a range on the daily charts, but repeated weakness back below 1.2775 could open a path lower towards 1.2600. In an alternative scenario, a daily close above 1.2875 may open a path towards 1.3000.
Trump tax announcement in focus
A feeling of anticipation has gripped financial markets today as investors prepare for Trump's big announcement clarifying how and when his “phenomenal” tax reforms will play out. The proposed tax cuts in the States have attributed to the impressive stock market rally with Trump expected to trim corporate income tax rate from 35% to 15%. Although there is the possibility of the Dollar stabilizing in the short term if Trump delivers, concerns still linger over the plan being light on details. Even if Trump offers markets the eagerly anticipated insight on tax reforms, recent reports from the US Congress Joint Committee on Taxation suggest that tax reform may reduce government revenues by $2 trillion over the next 10 years, which may weigh on sentiment. The possibility of corporations actually paying more from the tax cuts may encourage participants to carefully re-evaluate Trump's tax reforms.
Commodity spotlight – Gold
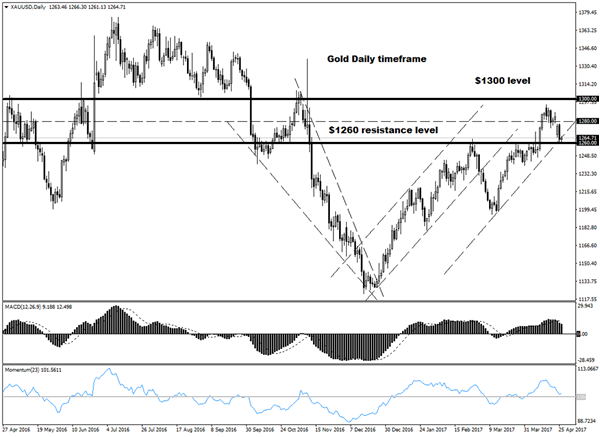
The renewed appetite for risk has left safe-haven investments in the dust with Gold losing some of its safe-haven glimmers this week. Sellers have exploited the risk-on trading environment to install heavy rounds of selling on the yellow metal with prices hovering around $1260 as of writing. Although geopolitical tensions and overall uncertainty may support the yellow metal in the longer term, short term bears could reclaim control below $1260. If the Macron-inspired risk-on rally persists this week, then Gold may be exposed to further losses. From a technical standpoint, the yellow metal is coming under increasing selling pressure on the daily charts. A breakdown and daily close below $1260 should encourage a further decline towards $1240. In an alternative scenario, bulls need to keep above $1260 for a further incline back towards $1280.
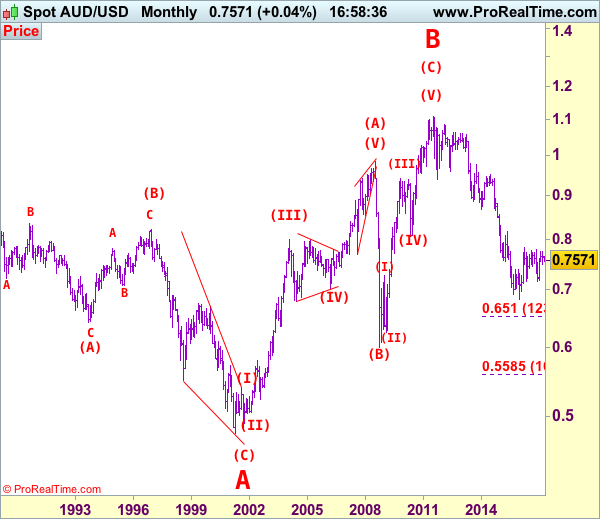
AUD/USD Elliott Wave Analysis
AUD/USD – 0.7493
AUD/USD – Wave 5 of C and (B) has possibly ended at 1.1081
Although aussie staged another rebound, renewed selling interest emerged at 0.7592 on Monday and price has retreated again, retaining our bearishness for a retest of 0.7473, break there would extend the fall from 0.7750 top for at least a strong correction of the rise from 0.7158 (Dec 2016 low), initial downside target is seen at 0.7450-55 (50% Fibonacci retracement of 0.7158-0.7750), then towards 0.7380-85 (61.8% Fibonacci retracement), however, near term oversold condition should prevent sharp fall below 0.7300-10 and reckon 0.7280-85 would hold from here, bring rebound later.
We are keeping our count that top has been formed at 1.1081 (wave 5 of V) and major correction (A-B-C-X-A-B-C) has commenced, indicated downside targets at 0.7945 (61.8% Fibonacci retracement of entire rise from 0.6007-1.1081) and 0.7750 had been met and downside bias is seen for further weakness to 0.6800, then 0.6700 but reckon 0.6500 would hold from here.
Our preferred count is that the rally from 0.6007 to 0.7270 (7 Jan 2009) is marked as wave A, the retreat to 0.6248 (2 Feb 2009) is wave B and the subsequent upmove is labeled as wave C with wave (iii) and wave (iv) ended at 0.8265 and 0.7700 respectively and wave (v) as well as 3 ended at 0.9407, then wave 4 ended at 0.8066 (instead of 0.8578). The wave 5 has met our indicated projection target of 1.1060 and could ended at 1.1081, this level is now treated as the peak of wave (C) as well as larger degree wave B, hence major fall in wave C has commenced, our initial downside target at psychological support at 0.7000 has just been met and further weakness to 0.6500 would be seen later.
On the upside, expect recovery to be limited to 0.7540-50 and bring another decline. Only above this week’s high at 0.7592 would risk test of previous resistance at 0.7611, once this level is penetrated, this would suggest low is formed, risk a stronger rebound to 0.7640-45 but break of resistance at 0.7680 is needed to confirm and suggest the fall from 0.7750 has ended instead,
Recommendation: Hold short entered at 0.7570 for 0.7390 with stop lowered to break-even
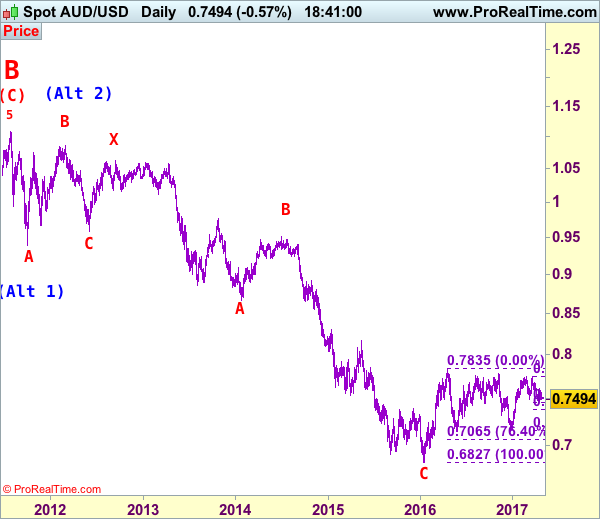
Our alternate count on the daily chart treated the top formed in 2008 at 0.9851 could be a larger degree wave I and was followed by a deep and sharp correction in wave II to 0.6007 and wave III is unfolding from there.
The long-term uptrend started from 0.4775 (2 Apr 2001) with an impulsive structure. Wave I is labeled as 0.4775 to 0.9851 (15 Jul 2008), wave II has ended at 0.6007 (Oct 2008) and wave III is still in progress which may extend further gain to 1.1265.