Sample Category Title
EUR/USD Demand Is Increasing, GBP/USD Consolidating Above Former Resistance At 1.2775, USD/JPY Targeting Resistance At 112.20.
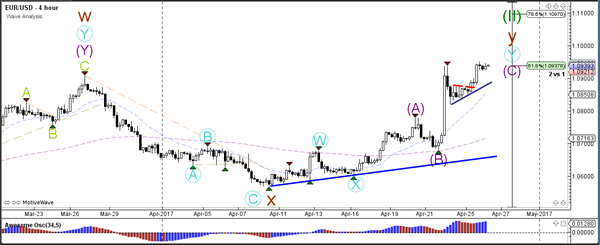
EUR/USD Demand is increasing.
EUR/USD is pushing higher. Hourly support can be found at 1.0682 (21/04/2017 base) then 1.0576 (11.04.2017 low). Stronger support can be found at 1.0494 (22/02/2017 low). Resistance given at 1.0937 (24/03/2017 high) has been broken,
In the longer term, the death cross late October indicated a further bearish bias. The pair has broken key support given at 1.0458 (16/03/2015 low). Key resistance holds at 1.1714 (24/08/2015 high). Expected to head towards parity.
GBP/USD Consolidating above former resistance at 1.2775.
GBP/USD is consolidating lower after sharp bullish rally. Resistance stands at 1.2905 (18/04/2017 low). The pair is standing in a shortterm bearish momentum monitoring hourly support at 1.2757 (21/04/2017 low). A break of this support would confirm a weakening shortterm bullish momentum. Hourly resistance is located at 1.2905 (18/04/2017 reaction high).
The long-term technical pattern is even more negative since the Brexit vote has paved the way for further decline. Long-term support given at 1.0520 (01/03/85) represents a decent target. Long-term resistance is given at 1.5018 (24/06/2015) and would indicate a long-term reversal in the negative trend. Yet, it is very unlikely at the moment.
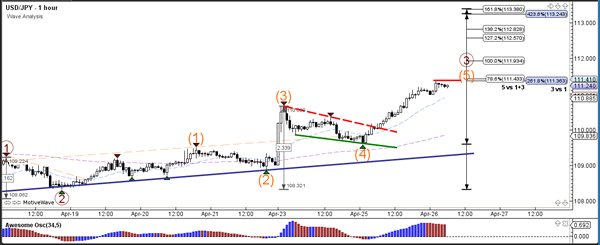
USD/JPY Targeting resistance at 112.20.
USD/JPY is drifting higher. Hourly resistance given at 110.64 (23/04/2017 high) has been broken. Stronger resistance can be found at 112.20 (31/03/2017 high). Closest support can be located at 108.13 (17/04/2017 low). Other key supports lie at a distant 106.04 (11/11/2016 low). Expected to show continued bullish pressures.
We favor a long-term bearish bias. Support is now given at 96.57 (10/08/2013 low). A gradual rise towards the major resistance at 135.15 (01/02/2002 high) seems absolutely unlikely. Expected to decline further support at 93.79 (13/06/2013 low).
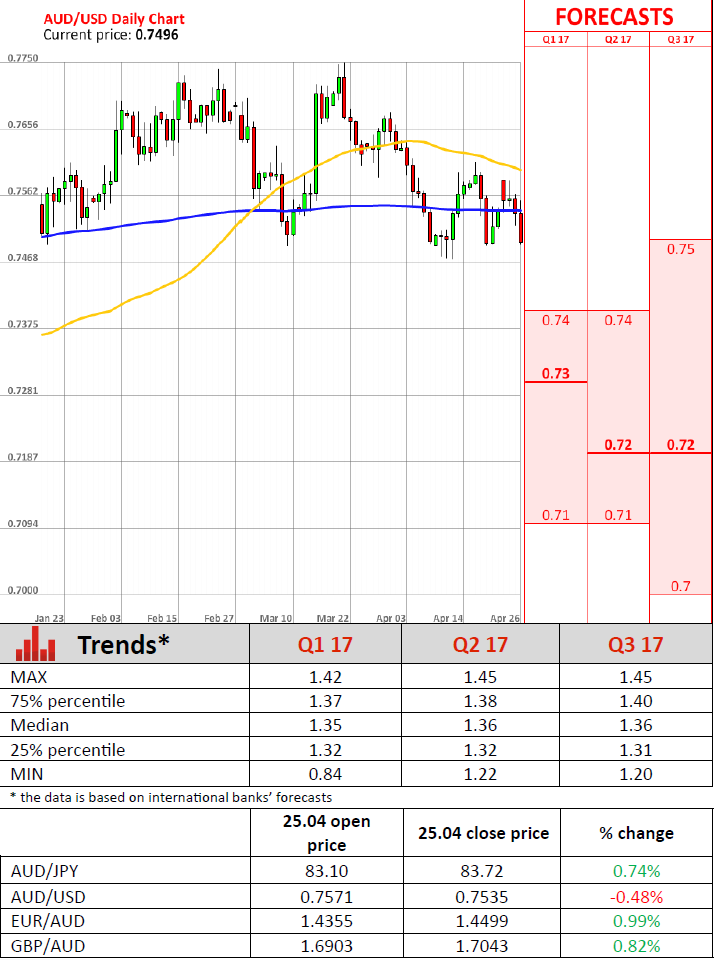
AUD/USD Candlesticks and Ichimoku Analysis
Weekly
• Last Candlesticks pattern: Shooting doji
• Time of formation: 20 Feb 2017
• Trend bias: Sideways
Daily
• Last Candlesticks pattern: Bearish engulfing pattern
• Time of formation: 21 Mar 2017
• Trend bias: Near term down
Although aussie opened higher earlier this week and rose to as high as 0.7592, as the pair met resistance at 0.7592 and has retreated, retaining our view that further consolidation would be seen with mild downside bias for another fall to 0.7491 (last week’s low), however, break there is needed to signal the fall from 0.7750 top has resumed, bring retest of 0.7474, break there would extend this move for at least a strong retracement of the rise from 0.7158, hence further decline to 0.7450-55 (50% Fibonacci retracement of 0.7158-0.7750), then towards 0.7380-85 (61.8% Fibonacci retracement) would be seen but reckon downside would be limited to 0.7300-10.
On the upside, expect recovery to be limited to the Tenkan-Sen (now at 0.7551) and price should falter below resistance at 0.7592, bring another decline later. Only break of the Kijun-Sen (now at 0.7612, also just above resistance at 0.7611) would abort and signal first leg of decline from 0.7750 has ended, bring a stronger rebound to 0,7640-50 but resistance at 0.7680 should cap upside, price should falter below 0.7700-10, bring another decline later.
Recommendation: Hold short entered at 0.7570 for 0.7390 with stop above 0.7595.
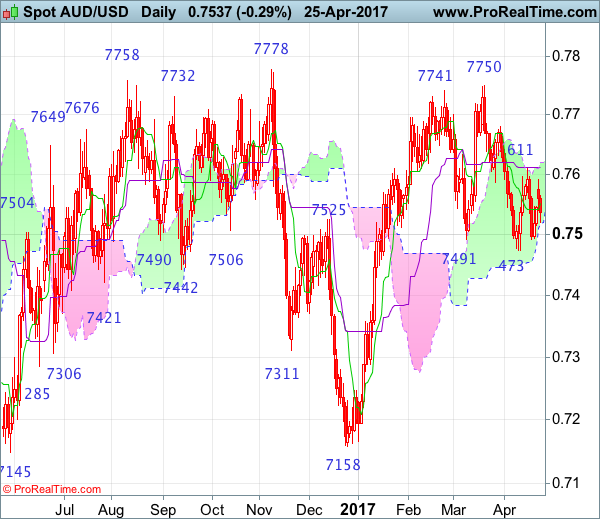
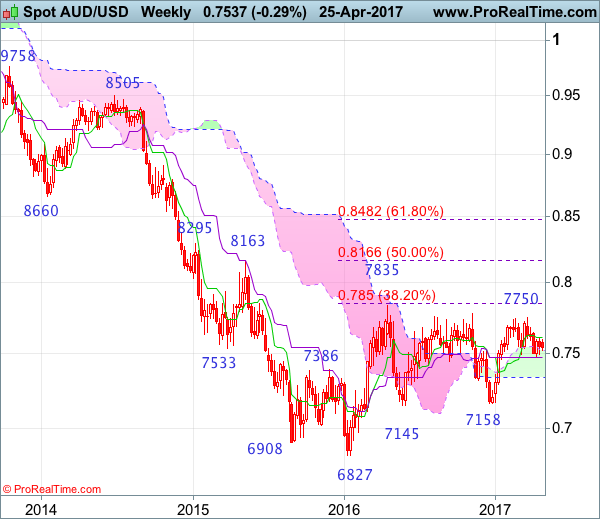
On the weekly chart, aussie has remained confined inside near term range and further consolidation is in store, however, reckon upside would be limited to 0.7592 resistance (this week’s high), bring another decline later to 0.7468-73 (current level of the Kijun-Sen and previous support), break there would add credence to our view that the rebound from 0.7158 has ended at 0.7750, then further fall towards 0.7380-85 (61.8% Fibonacci retracement of 0.7158-0.7750) would be seen, however, reckon downside would be limited to 0.7290-00, bring recovery later.
On the upside, although further sideways trading would take place, price should falter below this week’s high at 0.7592, bring another decline. Only break of 0.7612 would risk test of resistance at 0.7680 but a sustained breach above this level is needed to signal the retreat from 0.7750 has ended instead, bring another bounce towards this level. Looking ahead, a break of 0.7778 resistance would suggest a possible upside break of early established broad range, bring further rise to 2016 high at 0.7835, above there would confirm and encourage for headway to 0.7900 and later towards psychological level at 0.8000.
Trade Idea : USD/CHF – Stand aside
USD/CHF - 0.9943
Most recent candlesticks pattern : N/A
Trend : Near term down
Tenkan-Sen level : 0.9936
Kijun-Sen level : 0.9938
Ichimoku cloud top : 0.9954
Ichimoku cloud bottom : 0.9947
New strategy :
Stand aside
Position : -
Target : -
Stop : -
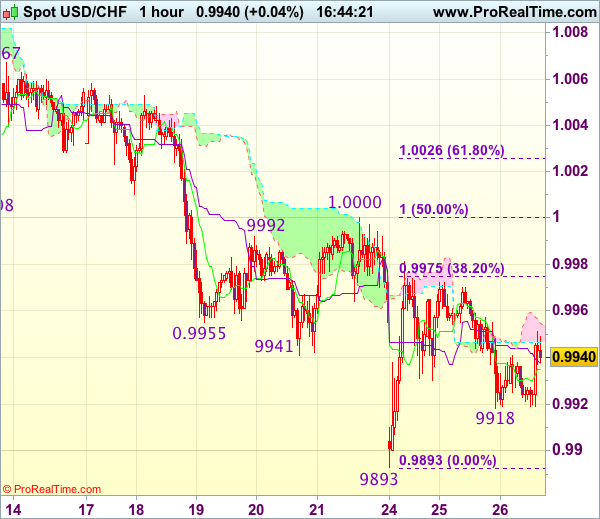
Although dollar retreated yesterday to as low as 0.9918, as the greenback has rebounded today, retaining our view that further sideways trading above this week’s low at 0.9893 would take place and another bounce to 0.9981 cannot be ruled out, however, break of 1.0000-08 resistance is needed to signal low is formed instead, bring rebound to 1.0025-30 (61.8% Fibonacci retracement of 1.0108-0.9893), however, price should falter below resistance at 1.0067.
As near term outlook is still mixed, would be prudent to stand aside in the meantime. Below said support at 0.9918 would bring retest of 0.9893 but break there is needed to confirm recent decline from 1.0108 has resumed and extend weakness to 0.9865-70 (2 times extension of 1.0108-1.0008 measuring from 1.0067), however, reckon support at 0.9831 would hold from here, bring rebound later.
AUD In Free Fall, ECB Poised To Gradually Hint At Tapering
AUD tumbled amid disappointing inflation data
The Australian dollar tumbled another 0.50% this morning amid disappointing first quarter inflation data. This report was the straw that broke the camel's back as investors have been betting heavily on a pick-up in inflation that would have forced the RBA to revise its dovish stance. The headline inflation gauge rose 2.1%y/y in the March quarter, compared to 2.2% expected and 1.5% in the December quarter of 2016. This sharp increase has been mostly fuelled by the recovery in commodity prices. The core measure - that excludes the most volatile components - increased to 1.5%y/y from 1.3%, well below the central bank target range of 2%-3%.
This disappointing report suggests that the RBA's next move will likely be a cut rather than a hike. AUD/USD lost more than 1.30% since Monday and is about to test the key support that lies at 0.7474 (low from April 12th). If broken, the door is wide open toward 0.7145 (low from May 2016). The risk is heavily skewed to the downside as investors will likely start to unwind their long AUD speculative positions - speculative net long positioning in the future market reached 37% of total open interest last week, according to data reported by the CFTC. In addition we likely see the resurgence of short US bonds positions as Trump's reflation trade is making a comeback against the backdrop of investors who are desperately willing to believe in an upcoming growth boost in the US. We believe that the USD debasement is coming to an end and the Aussie is the first in line for the sell-off.
Turkish rate decision expected as lira has room to head higher
While the French Presidential elections are still taking the major attention from markets, central banks are also coming back. The Turkish Central Bank will likely announce early this afternoon that it will maintain its stance on the rates.
The Benchmark Repurchase Rate should be maintained at 8% to mitigate inflation risk. According to the national Turkish institution, the inflation rate climbed to 11.29 y/y from 10.13%. In addition, the Central Bank Governor Murat Cetinkaya is expected to have a current account deficit of 4% for 2017, which would mean that a recovery is actually happening. Currency-wise, the Turkish lira remains at an elevated level, although not weaker than the level of 3.87 liras at the end of January.
In our view, the geopolitical and political uncertainties are one of the greatest driver of the currency at the moment. President Erdogan won the constitutional referendum and this increases his power and he main remain in office until 2029. Diplomatic relations with the EU though are at a low point. We believe that USDTRY has some room to head even higher in the medium-term.
Big risk in FX markets, hint of tapering
We are heading towards a structural shift that will profoundly change drivers in the FX market. However, we remain six months away from that reflection point. In the autumn, due to momentum in inflation data, we anticipate the ECB and BoJ will acknowledge the need for tapering of emergence measures and then head towards monetary policy nominalizations. In our view, getting the timing right of this point will be critical for success in the FX markets. But for now, traders should watch the ECB and BoJ to avoid any communication suggesting tapering.
For the ECB, we suspect it is way too early for tapering hints despite growing pressure from the German membership of the governing council. We expected the result of the BoJ two-day meeting to maintain its current monetary policy strategy. The pace of JGB purchased will remain at ¥80trn per year. With Japanese inflation a long way from the 2% target, there is not a current pressure to discuss policy adjustments, especially considering any hint of tapering will have a strong effect on USDJPY, which has only recently regained a bullish trend from an April correction.
With US short end yields heading higher on the back of President Trump's tax reform (is the Trump trade back in play?) and solid signals from the US economy (including yesterday's impressive New Home sales data) markets will begin repricing Fed rate hikes, which now sits at two. In the short term, we are cautiously bullish on USD especially against G10 currencies. Elsewhere, Canadian retail sales are expected to disappoint (0.0% from 2.25% m/m) putting additional pressure on the CAD.
Daily Technical Analysis: USD/JPY Bullish Breakout Above Bull Flag Pattern At 110
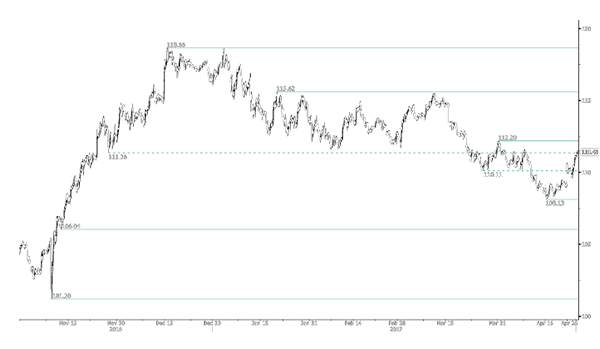
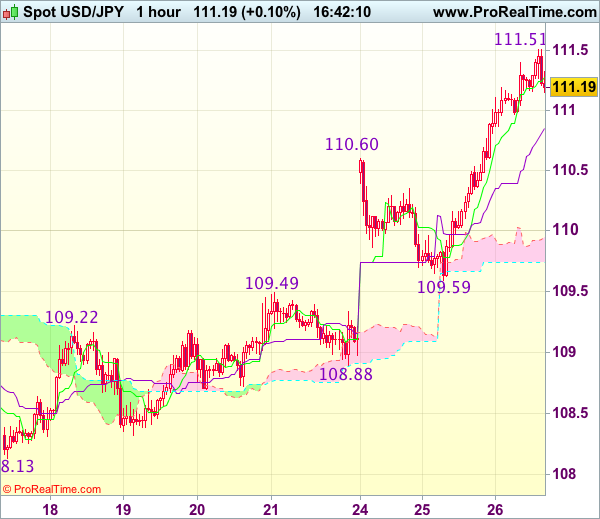
Currency pair USD/JPY
Yesterday the USD/JPY broke as expected above the 110 resistance (dotted red) of the bull flag chart pattern. Price has continued with its bullish extension in wave 3 (brown) and has now arrived at the 261.8% Fibonacci target which could create a potential retracement.
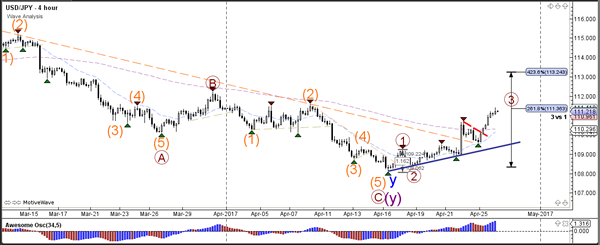
Yesterday the USD/JPY broke as expected above the 110 resistance (dotted red) of the bull flag chart pattern. Price has continued with its bullish extension in wave 3 (brown) and has now arrived at the 261.8% Fibonacci target which could create a potential retracement.
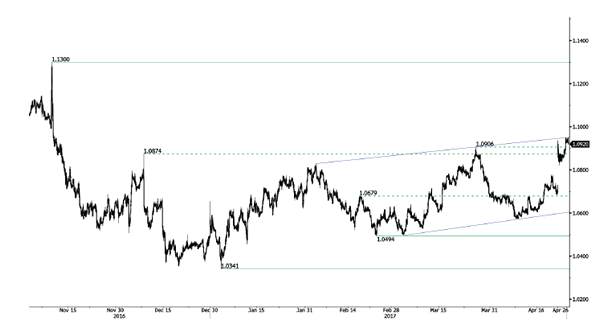
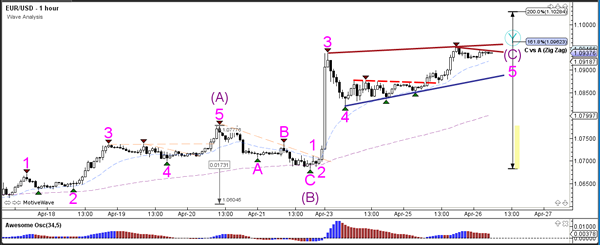
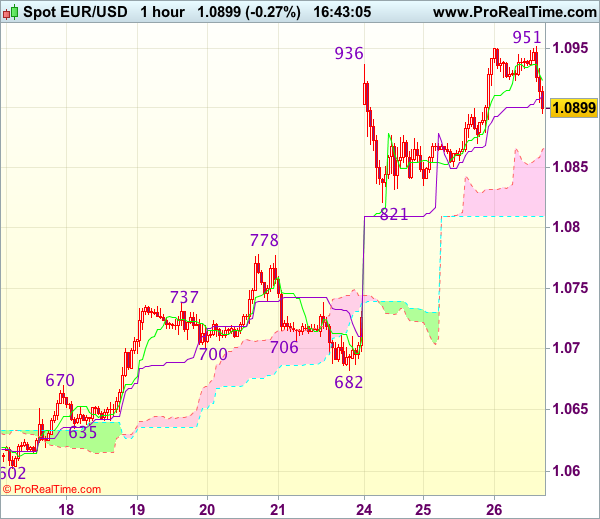
Currency pair EUR/USD
The EUR/USD broke above the resistance trend line (dotted red) and has hit the first target at 1.0950. The second target is the psychological round level of 1.10. A break above that could see the EUR/USD extend towards the 78.6% Fibonacci level of wave 2 (green).
The EUR/USD bullish breakout confirmed that the expected wave 4 and 5 (pink) were correct. Price is now stopping at 1.0950 but a new breakout above the trend lines (dark red) could see price challenge 1.10, which is a new resistance level and a bounce or break spot. Bears could probably better wait for price to break below the support trend line (blue).
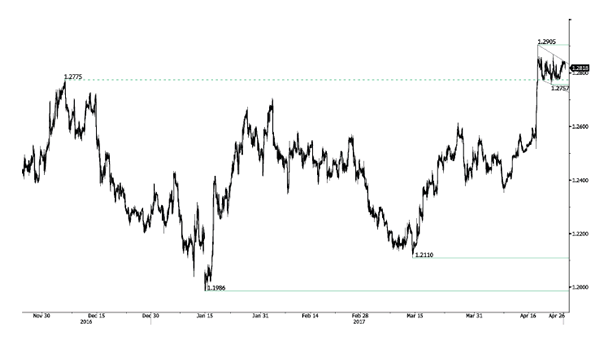
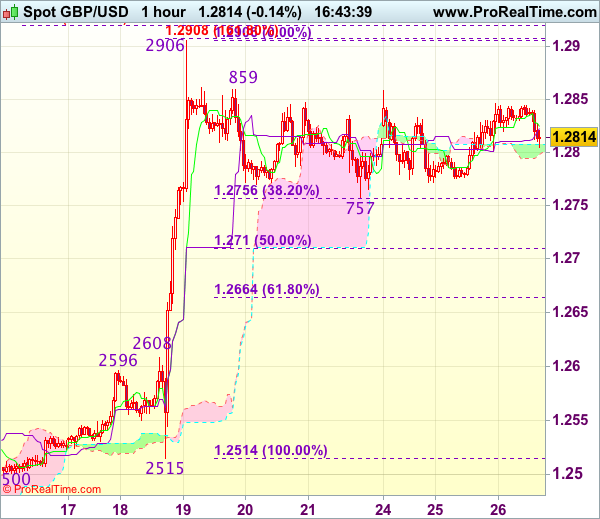
Currency pair GBP/USD
The GBP/USD bull flag chart pattern (red/blue lines) remains intact as long as price stays in between those levels. A break above resistance (red) could see price challenge the next Fibonacci level whereas a break below support (blue) could find a bounce at 1.27 support.
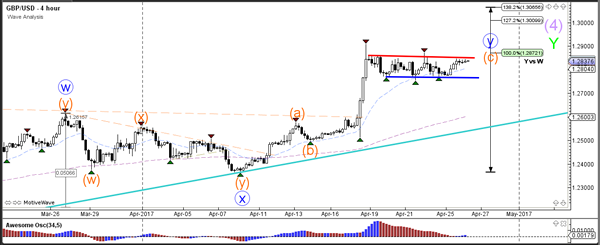
The GBP/USD has respected the 38.2% Fibonacci retracement level but a break below the 61.8% Fibonacci level invalidates wave 4 (purple). A break above the bull flag (red) could see a wave 5 (purple) develop.
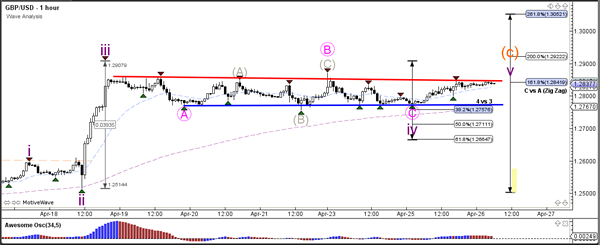
Trade Idea : GBP/USD – Buy at 1.2710
GBP/USD - 1.2817
Most recent candlesticks pattern : N/A
Trend : Near term up
Tenkan-Sen level : 1.2825
Kijun-Sen level : 1.2824
Ichimoku cloud top : 1.2808
Ichimoku cloud bottom : 1.2800
Original strategy :
Buy at 1.2710, Target: 1.2850, Stop: 1.2675
Position : -
Target : -
Stop : -
New strategy :
Buy at 1.2710, Target: 1.2850, Stop: 1.2675
Position : -
Target : -
Stop : -
Cable has continued trading within near term established range and further sideways trading is in store, whilst another test of Friday’s low at 1.2757 cannot be ruled out, reckon downside should be limited to 1.2700-10 (50% Fibonacci retracement of 1.2515-1.2906) and bring another rally, a break of indicated minor resistance at 1.2859 would signal the pullback from 1.2906 has ended, bring retest of this level, above there would extend recent upmove to 1.2920-30 (2 times extension of 1.2365-1.2575 measuring from 1.2500), then 1.2950 but loss of upward momentum should prevent sharp move beyond 1.2990-00 (1.236 times projection of 1.2109-1.2616 measuring from 1.2365 and psychological resistance).
In view of this, would not chase this rise here and would be prudent to buy cable on subsequent pullback as downside should be limited to 1.2710 (50% Fibonacci retracement of 1.2515-1.2906), bring another rise. Below 1.2700 would defer and signal top has been formed, risk correction to 1.2660-65 (61.8% Fibonacci retracement of 1.2515-1.2906) and price should stay well above 1.2608-16 (previous resistance now support).
Trade Idea : EUR/USD – Exit long entered at 1.0900
EUR/USD - 1.0903
Most recent candlesticks pattern : N/A
Trend : Near term up
Tenkan-Sen level : 1.0923
Kijun-Sen level : 1.0911
Ichimoku cloud top : 1.0865
Ichimoku cloud bottom : 1.0809
Original strategy :
Bought at 1.0900, Target: 1.1000, Stop: 1.0865
Position : - Long at 1.0900
Target : - 1.1000
Stop : - 1.0865
New strategy :
Exit long entered at 1.0900
Position : - Long at 1.0900
Target : -
Stop : -
Despite intra-day marginal rise to 1.0951, lack of follow through buying and current retreat suggest consolidation below this level would be seen and downside risk remains for retracement to 1.0870-75, break there would suggest an intra-day top is formed, bring further fall to 1.0850 but reckon support at 1.0821 would hold from here, bring another rise later.
In view of this, would be prudent to exit long entered at 1.0900 and stand aside for now. Only above said resistance at 1.0951 would extend recent upmove from 1.0340 low to 1.0975-80 and possibly towards 1.1000 which is likely to hold on first testing due to loss of momentum, risk from there is seen for a retreat later.
Trade Idea : USD/JPY – Buy at 110.70
USD/JPY - 111.27
Most recent candlesticks pattern : N/A
Trend : Near term up
Tenkan-Sen level : 111.28
Kijun-Sen level : 110.85
Ichimoku cloud top : 109.95
Ichimoku cloud bottom : 109.74
Original strategy :
Buy at 110.40, Target: 111.40, Stop: 110.05
Position : -
Target : -
Stop : -
New strategy :
Buy at 110.70, Target: 111.70, Stop: 110.35
Position : -
Target : -
Stop : -
The greenback surged after finding renewed buying interest at 109.59 and broke above previous resistance at 110.60, adding credence to our view that recent rise from 108.13 low is still in progress and bullishness remains for this move to bring at least a strong retracement of early downtrend, hence further gain to resistance at 111.58 would be seen, break would extend gain towards 111.90-00, however, overbought condition should prevent sharp move beyond another previous resistance at 112.20.
In view of this, would not chase this rise here and would be prudent to buy dollar on subsequent pullback as previous resistance at 110.60 should limit downside, bring another rally. Below 110.30-35 (61.8% Fibonacci retracement of 109.59-111.51) would defer and suggest top is possibly formed, risk weakness to 109.80 but break of support at 109.59 is needed to provide confirmation.
Corporate Earnings Lift US Stocks Ahead Of Trump’s Tax Reform Plan
Last week the US President Trump stated on twitter that he will “unveil his major tax reform plan on Wednesday April 26”. Trump intends to dramatically cut corporate tax from the current rate of 35% to 15%, and will likely make tax exemption on US corporate overseas earnings.
After the failure of his healthcare bill proposal on March 24, markets have, to an extent, lost confidence in Trump's leadership. Therefore, his tax reform plan is crucial to demonstrate to the markets the capability of the Trump administration and to regain market confidence. The healthcare bill failure resulted in USD plunging to a 4-and-a-half-month low with USD further weakening post Trump's recent “strong dollar” statement on April 12.
The tax reform bill will still need Congress's approval to pass. If Trump is unable to get enough support again, it will likely lead to substantial market disappointment likely to initiate a USD and Equity sell off.
Q1 US corporate earnings have generally outperformed expectations. To date there have been more than 90 S&P 500 listed companies announcing their results with 74.7% reporting better-than-expected profits. Only 19.5% of these companies reported lower-than-expected profits mainly because of individual factors instead of market or macroeconomic factors.
The outperforming corporate earnings pushed US stocks up. Tuesday evening, the Dow Jones index hit a 6-week high of 21022, The S & P 500 index hit a 8-week high of 2392.15.
A further 190 S&P 500 listed companies will report earnings this week including some major components such as: Microsoft, Amazon, Intel, and Alphabet. The mega-caps Apple and Facebook will report earnings next week.
Overall US corporate earnings growth for Q1 is forecasted to be 13.7% surpassing the 10% growth seen in Q4. If US corporate earnings continue to outperform, and Trump's tax cut or tax reform bill proposal is passed by Congress, we can expect USD and the US stock market to move higher.
Australian CPI Headline Inflation Misses Analysts’ Forecasts In Q1 Of 2017
'We see a genuine recovery in core inflation as a quite distant prospect, which biases the RBA to ease again.'
Australian consumer headline inflation growth missed forecasts in the three month to March, while core inflation rose in line with expectations, official figures revealed on Tuesday. The Australian Bureau of Statistics reported that its headline CPI came in at 0.5% in the Q1 of 2017, unchanged from the preceding quarter, while market analysts anticipated an increase of 0.6% during the reported quarter. On an annual basis, headline inflation climbed 2.1%, missing markets' expectations for a 2.2% rise. Nevertheless, the Trimmed Mean CPI, the ABS' core inflation measure, advanced 0.5% on a quarterly basis, in line with forecasts. Year-over-year, core inflation rose 1.9%, surpassing expectations for a 1.8% climb. Despite the rise in the core inflation rate, analysts stated that overall inflation was modest and driven by some temporary factors, such as the change in crude oil prices, forcing the Reserve Bank of Australia to remain on hold for an undefined period of time. Prices for education, health and transport climbed 3.1%, 2.0% and 1.5%, respectively. However, the following gains were offset by price declines in other categories. Prices for clothing and footwear dropped 1.4%, for furnishings, household equipment and services prices fell 1.0% and for recreation and culture prices plunged 0.7%.