
Sample Category Title
ECB: Political Caution Points To A Dull Meeting But June And September To Be More Exciting
- Ongoing French elections to overshadow ECB meeting
- ECB doesn't want to create extra volatility and Draghi will keep lips sealed
- Therefore, no major policy changes or tweaks in communication Risks to outlook upgraded to broadly balanced from tilted to the downside
- Slight tweak in Forward guidance (diminishing possibility of lower rates?) possible, but unlikely
- Major decisions likely at September meeting, with signaling of intentions in June
The ECB meeting on Thursday takes place in between the two rounds of the French presidential elections. So, we expect the ECB to refrain from giving important new information on its policy outlook. It doesn't want to risk adding unnecessarily to uncertainty and volatility about its future intentions or actions at a time of particular market sensitivity. In any event, there is little economic rationale for the ECB to alter its now well‐worn message. It has no new economic and inflation projections and the recent March inflation data surprised on the downside for both headline and core readings. These circumstances allow and encourage the ECB to take its time and await the right moment to eventually change policy. So, we expect ECB president Draghi to confirm the continuation of all major elements of the current policy stance. This entails continuing asset purchases till at least the end of 2017 or beyond, if necessary. Forward guidance will continue to suggest that rates might stay at current (or lower) levels for an extended period of time and well past the end of the asset purchases.
While the ECB is expected to emphasise continuity, there may be some subtle indications that circumstances are changing albeit gradually in a manner that in time will have more significant implications for policy. In this context, two points are open for debate in terms of this week's policy statement; Will the ECB in its forward guidance still keep the option that rates may be lowered further and, consistent with that possibility, will it continue to see downside risks to the growth outlook?
Minutes March meeting: Easing bias
The starting point for the discussion on Thursday's ECB meeting may be suggested by the recently published summary of the Minutes of the March meeting. These revealed that there 'was broad agreement' on the Governing Council that the outlook for activity had improved and that downside risks had receded. This prompted a debate about whether a softening of the 'easing bias' in the Bank's forward guidance was warranted. Governing Council members felt that a discussion of policy normalisation 'would be warranted in the future' if growth and underlying inflation increased.
It was decided that it would be 'premature' to remove hints about possible further easing because this 'could lead to an undue upward shift in market interest rates and tighten financial conditions'. There was also a consensus view that current plans to buy €60bn of assets per month throughout this year were appropriate. And the minutes reiterated that purchases would continue for longer if underlying inflation failed to pick up.
Economic recovering strengthens, while inflation unexpectedly dropped
Business surveys for the euro‐zone released in the past week that relate to April were very encouraging. The flash composite PMI rose to a six‐year high, reflecting improvements in both the services and manufacturing sectors. It means that not only Q1 activity continue to grow above trend, but it suggests that the economy is still accelerating at the start of Q2. It might lead to upward revision for growth in 2017 and beyond in the June ECB staff projections. Possibly even more encouraging, economic activity is broadening with the German economy possibly slightly slowing, but with accelerating growth in countries like France and Italy that until recently had been large and problematic laggards in the recovery. Finally, it should please the ECB that the manifold political risks inside and outside the euro area haven't had any discernible negative impact on the European economy at least to this point.
Inflation disappointed in March with the headline HICP dropping to 1.5% Y/Y, after having briefly touched 2% Y/Y in February, while the core inflation fell back to 0.7% Y/Y from 0.9% Y/Y. This release certainly gives the ECB grounds to argue that inflation is not on a sustainable path towards the 2% objective and, by extension, substantial monetary accommodation continues to be required. Without going into too much detail, the decline doesn't seem particularly worrisome to us and is the result of some special factors like energy and food that pushed inflation higher (than expected) in the winter months and are now reversing In March, the decline was driven by lower energy and food prices, but also by a number of service prices that were affected by the late timing of Easter this year compared to last year. The holiday package price evolution is the best known example. Therefore, we expect inflation and core inflation to have moderately rebounded in April (to be published on Friday).
Changes in FG and risk assessment
In the light of these elements, we think the ECB will now see risks to the growth outlook as being broadly balanced instead of tilted to the downside. ECB executive member Coeuré argued in favour of such a change two weeks ago.
A small change in the forward guidance is not excluded either. More in particular the ECB may drop the reference to 'lower rates'. That reference is long overdone. First, deflation risks have disappeared and second, from a fundamental point of view, the current ‐40 basis points depo‐rate is considered by many governors and still more observers as a kind of lower boundary beyond which negative effects outweigh positive ones. However, the ECB may strategically and tactically want to wait for a more thorough examination and discussion of its forward guidance at the June meeting, when French presidential elections are over and new projections are available. A fuller consideration at that point would emphasise that the ECB is not mechanically responding to the vagaries of monthly releases but is instead carefully refining its view of any emerging changes to the policy relevant medium term outlook.
Exit crisis policy stance coming closer
While we don't expect much by way of fireworks this week, we think that the June and September ECB meetings will be crucial to an eventual but carefully prepared shift in the stance of ECB policy. In June, we might see the ECB rework its forward guidance to bring it more in sync with the current economic reality of healthy and increasingly broadly based gains in activity employment.
That could set the stage for crucial decisions in September on the exit policy from the current unconventional setting (QE/negative rates). At the September meeting, we might see the ECB recalibrate again its QE and reduce the monthly amount of asset purchases further, perhaps to €40B, but at the same time prolonging QE into 2018 which would see the further tapering and the eventual ending of asset purchases.
A further recalibration as early as September might be presented as giving the ECB more space to prolong the period of purchase programme as technical hurdles to its smooth continuation in the form of a growing scarcity of eligible assets will steadily increase. The issue and issuer limits in the asset purchases framework are becoming a binding hurdle to buy bonds of an increasing number of countries
In this regard, the ECB SESFOD survey of financial markets for the first time mentioned deterioration of conditions in various markets due to the asset purchases. It mentioned worsened market liquidity for underlying collateral, less favourable non‐price terms for secured funding and for non‐cleared OTC derivatives. 'The tightening of credit terms was more pronounced with respect to non‐price terms than for price terms. Also, overall credit terms for secured funding tightened year‐on‐year when government bonds, high‐yield corporate bonds or equities were used as collateral. Survey respondents also reported less favourable non‐price credit terms applied to OTC derivative counterparties relative to one year ago, in particular in the case of interest rate and foreign exchange derivatives.'
While we don't expect any clear signals in relation to the asset purchase programme this week, we will be particularly attentive to any part of the Q&A session that hints the matter may be receiving serious attention at present in Frankfurt. Policy and technical considerations mean we think that the ECB will need to signal a notably diminished amount of bond purchases before the end of the year. We also think that the first rate hike will take place before end 2018 and that they will speedily bring the depo‐rate to zero.
We don't expect any significant first step to be signalled at this week's ECB meeting but there may be hints that behind the scenes plans for an eventual exit path from the current exceptional monetary stance are at least starting to be discussed.
EUR/AUD Daily Outlook
Daily Pivots: (S1) 1.4384; (P) 1.4462; (R1) 1.4577; More...
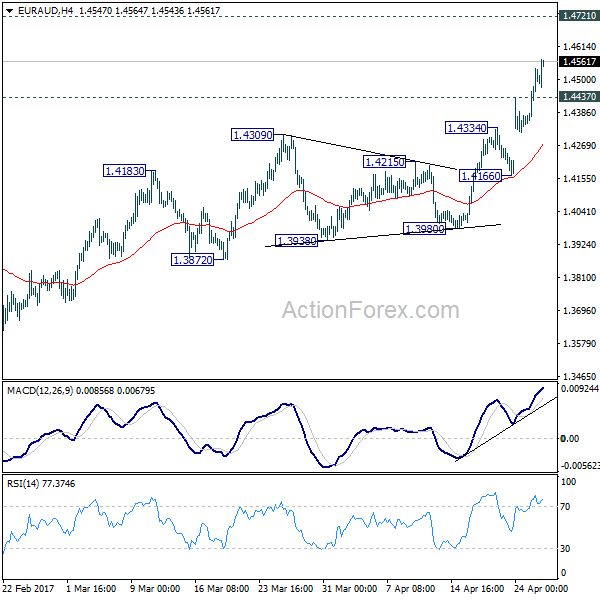
EUR/AUD's really continues today and reaches as high as 1.4570 so far. Intraday bias remains on the upside for 1.4721 key resistance next. As noted before, we're holding on to the case off trend reversal after defending 1.3671 key support. Decisive break of 1.4721 should confirm. On the downside, below 1.4437 minor support will turn intraday bias neutral and bring consolidation. But retreat should be contained well above 1.4166 support and bring rise resumption.
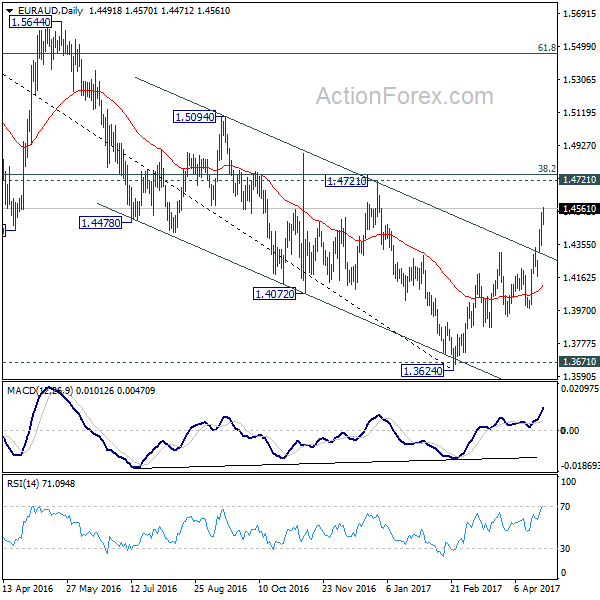
In the bigger picture, price actions from 1.6587 medium term top are viewed as a corrective pattern. Such correction could be completed after defending 1.3671 key support. Break of 1.4721 cluster resistance (38.2% retracement of 1.6587 to 1.3624 at 1.4756) should confirm this case and target 61.8% retracement at 1.5455 and above. Overall, we'd expect the up trend from 1.1602 to resume later. However, sustained break of 1.3671 will invalidate our bullish view and would turn extend the fall from 1.6587 towards 1.1602 long term bottom.
EUR/JPY Daily Outlook
Daily Pivots: (S1) 119.75; (P) 120.69; (R1) 122.33; More...
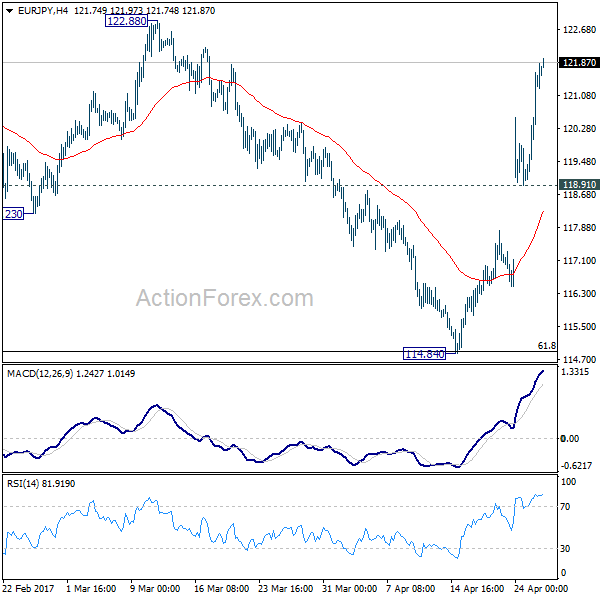
EUR/JPY's rally continues today and reaches as high as 121.97 so far. Intraday bias remains on the upside for 122.88 resistance next. Break there will likely resume the larger rally from 109.20. In such case, EUR/JPY should break through 124.08 to 126.09 key resistance level. On the downside, break of 118.91 support is needed to indicate short term topping. Otherwise, outlook will remains bullish in case of retreat.
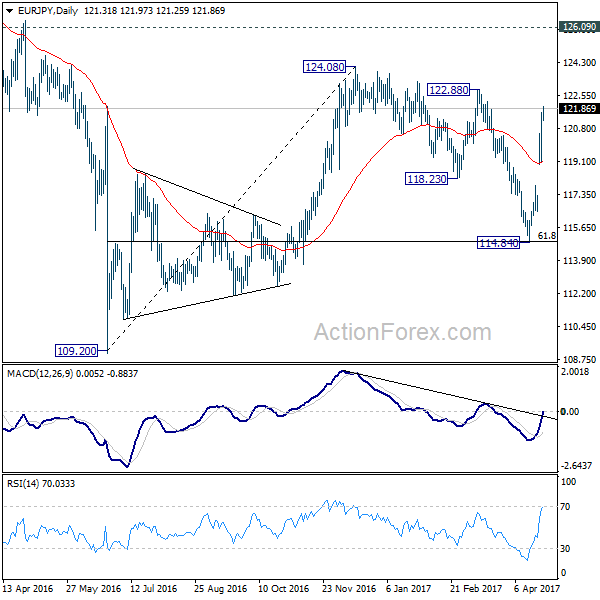
In the bigger picture, price actions from 109.20 is still seen as a corrective move for the moment. But current development suggests that the first leg is finished at 109.20, second leg at 114.84. And rise from 114.84 is possibly developing into the third leg. Further rise will now be in favor through 124.08 resistance. Strong break of 126.09 support turned resistance will confirm completion of whole fall from 149.76 at 109.20. In such case, rise from 109.20 is developing into a medium term move for 141.04 and above.
GBP/JPY Daily Outlook
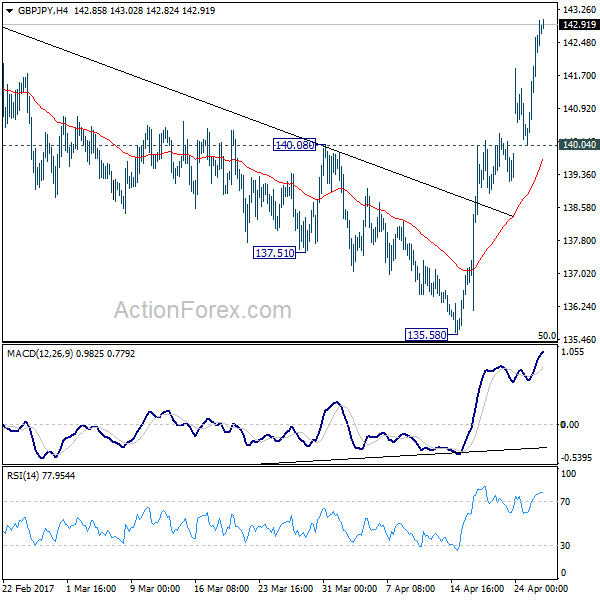
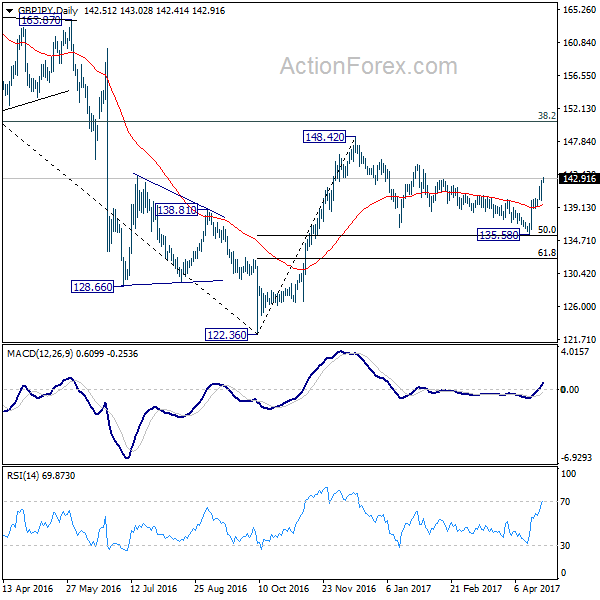
Daily Pivots: (S1) 140.86; (P) 141.76; (R1) 143.47; More....
GBP/JPY's rally continues and reaches as high as 143.20 so far. Intraday bias remains on the upside for 144.77 resistance. Consolidation pattern from 148.42 should have completed three waves down to 135.58, after hitting 135.39 fibonacci level. Break of 144.77 should extend whole rise from 122.36 through 148.42. On the downside, break of 140.04 support is needed to indicate short term topping. Otherwise, outlook will remain bullish in case of retreat.
In the bigger picture, price actions from 122.36 medium term bottom are still seen as a corrective pattern. As long as 50% retracement of 122.36 to 148.42 at 135.39 holds, another rising leg would be seen to 38.2% retracement of 195.86 to 122.36 at 150.42 and possibly above. However, firm break of 135.39 will bring retest of 122.36, with prospect of resuming the larger down trend from 195.86.
Risk-On Mode Continues, Dollar Awaits Trump’s Tax Reform
Markets remain in full risk on mode this week. DJIA gained 232.23 pts or 1.12% to close at 20996.12 overnight. S&P 500 also rose 14.46 pts or 0.61% to close at 2388.61. Both indices took out structural resistance at 20887.5 and 2378.36 respectively and should be heading for new record highs. Meanwhile, NASDAQ maintains its lead and closed at new record high at 6025.49, up 0.7%. Treasury yields also jumped with 10 year yield closing up 0.054 at 2.327. That compares to last week's low at 2.177 and structural resistance at 2.391. A break above 2.391 will pave the way for a test on 2.621 key near term resistance. Dollar stays weak against European majors though. But the dollar index is losing some downside momentum below 98.85 support.
Trump administration to deliver tax reform
Markets continue to re-price in June Fed hike. Fed fund futures now suggest over 75% chance of a 25bps hike by Fed at June meeting. And, it was below 50% last week. But the expectation would very much depends on what US President Donald Trump would deliver regarding his tax reforms today. There are talks that Trump would push to lower public companies' income tax rate to 15%, down from 35%. Besides, there would be cut on top tax rate on "pass through" businesses, from 39.6% to 15%. And there would also be tax rate cut on offshore earnings which are repatriated, down from 35% to 10%. Meanwhile, there won't be a so called "border-adjustment" tax on imports. Treasury Secretary Steven Mnuchin and National Economic Director Gary Cohn are scheduled to have a joint pressure conference around 1:30pm ET today, from the White House Briefing Room.
UK required to pay EU contributions until 2020
In UK, it's reported that EU would require UK to pay the committed budget until 2020 before getting reasonable Brexit terms. On the other hand, UK Prime Minister Theresa May would only agree to it in exchange for a transitional deal that both sides would agree on. Meanwhile, May could offer an "ongoing payments" of some sort in exchange for a Free Trade Agreement after Brexit. European Commission President Jean-Claude Juncker and EU's chief Brexit negotiator Michel Barnier will arrive in London today for a meeting with May. EU officials will discuss and approval their own negotiation plan in a summit on April 29.
BOJ Kuroda: G20 and IMF agreed to its monetary policies
Ahead of the two day BoJ monetary policy meeting, Governor Haruhiko Kuroda said yesterday that the G20 and IMF officials agreed with the central bank's monetary policies. Kuroda told the parliament that "the IMF released a statement that re-affirms previous agreements that central banks should pursue their mandate to support economic activity and attain price stability." And he earned "the understanding that we are conducting policy to meet our inflation target."
Meanwhile, it's expected that BoJ would lower inflation forecast in the quarterly Outlook for Economic Activity and Prices report, to be released on Thursday after the policy announcement. But the central bank may upgrade growth forecast. In January forecast, BoJ projected core CPI to hit 1.5% yoy in this fiscal year. But core CPI is currently standing at 0.2% yoy in February with weak momentum in price growth. On the other hand, IMF raised Japan's growth forecast to 1.2% in 2017, up from January estimate of 0.8%. BoJ could share similar view.
Australian CPI back in RBA's target range
Australia CPI rose 0.5% qoq and 2.1% yoy in Q1, up from prior quarter's 0.5% qoq, 1.5% yoy. But missed expectation of 0.6% qoq, 2.2% yoy. That's the first time inflation is back in RBA's target range since 2014. RBA said earlier this month that it expected headline inflation to pick up over the course of 2017. However, it also expected that recovery in underlying inflation to be "a bit more gradual" due to subdued wage growth. Trimmed mean CPI rose to 1.9% yoy, up from 1.6% yoy and beat expectation of 1.8% yoy. Weighted median CPI rose to 1.7% yoy, up from 1.5% yoy, but missed expectation of 1.8% yoy.
Elsewhere...
Japan all industry activity index rose 0.7% mom in February. Swiss UBS consumption indicator will be released in European session. Canada will release retail sales later today.
GBP/JPY Daily Outlook
Daily Pivots: (S1) 140.86; (P) 141.76; (R1) 143.47; More....
GBP/JPY's rally continues and reaches as high as 143.20 so far. Intraday bias remains on the upside for 144.77 resistance. Consolidation pattern from 148.42 should have completed three waves down to 135.58, after hitting 135.39 fibonacci level. Break of 144.77 should extend whole rise from 122.36 through 148.42. On the downside, break of 140.04 support is needed to indicate short term topping. Otherwise, outlook will remain bullish in case of retreat.
In the bigger picture, price actions from 122.36 medium term bottom are still seen as a corrective pattern. As long as 50% retracement of 122.36 to 148.42 at 135.39 holds, another rising leg would be seen to 38.2% retracement of 195.86 to 122.36 at 150.42 and possibly above. However, firm break of 135.39 will bring retest of 122.36, with prospect of resuming the larger down trend from 195.86.
Economic Indicators Update
| GMT | Ccy | Events | Actual | Forecast | Previous | Revised |
|---|---|---|---|---|---|---|
| 1:30 | AUD | CPI Q/Q Q1 | 0.50% | 0.60% | 0.50% | |
| 1:30 | AUD | CPI Y/Y Q1 | 2.10% | 2.20% | 1.50% | |
| 1:30 | AUD | CPI RBA Trimmed Mean Q/Q Q1 | 0.50% | 0.50% | 0.40% | |
| 1:30 | AUD | CPI RBA Trimmed Mean Y/Y Q1 | 1.90% | 1.80% | 1.60% | |
| 1:30 | AUD | CPI RBA Weighted Median Q/Q Q1 | 0.40% | 0.50% | 0.40% | |
| 1:30 | AUD | CPI RBA Weighted Median Y/Y Q1 | 1.70% | 1.80% | 1.50% | |
| 4:30 | JPY | All Industry Activity Index M/M Feb | 0.70% | 0.60% | 0.10% | -0.40% |
| 6:00 | CHF | UBS Consumption Indicator Mar | 1.5 | |||
| 12:30 | CAD | Retail Sales M/M Feb | 0.20% | 2.20% | ||
| 12:30 | CAD | Retail Sales Less Autos M/M Feb | -0.30% | 1.70% | ||
| 14:30 | USD | Crude Oil Inventories | -1.0M |
Elliott Wave View: USDCAD More Upside
Short term Elliott Wave view in USDCAD suggest the decline to 1.322 ended Intermediate wave (X). Revised view suggests that the rally from there is unfolding as a double three Elliott Wave structure where Minute wave ((w)) ended at 1.3525 and Minute wave ((x)) ended at 1.3406. Minute wave ((w)) is subdivided as a Flat Elliott wave structure where Minutte wave (a) ended at 1.3338 and Minutte wave (b) ended at 1.3258. Near term, pair is within Minutte wave (x) pullback to correct the cycle from 4/24 low in 3, 7, or 11 swing before the rally resumes. We don’t like selling the proposed pullback and expect buyers to appear once wave (x) pullback is complete in 3, 7, or 11 swing as far as pivot at 1.3406 stays intact.
USDCAD 1 hour Elliott Wave Chart
Daily Technical Outlook And Review: EUR/USD, GBP/USD, AUD/USD, USD/JPY, USD/CAD, USD/CHF, DOW 30, GOLD
A note on lower timeframe confirming price action...
Waiting for lower timeframe confirmation is our main tool to confirm strength within higher timeframe zones, and has really been the key to our trading success. It takes a little time to understand the subtle nuances, however, as each trade is never the same, but once you master the rhythm so to speak, you will be saved from countless unnecessary losing trades. The following is a list of what we look for:
- A break/retest of supply or demand dependent on which way you're trading.
- A trendline break/retest.
- Buying/selling tails ... essentially we look for a cluster of very obvious spikes off of lower timeframe support and resistance levels within the higher timeframe zone.
- Candlestick patterns. We tend to only stick with pin bars and engulfing bars as these have proven to be the most effective.
EUR/USD
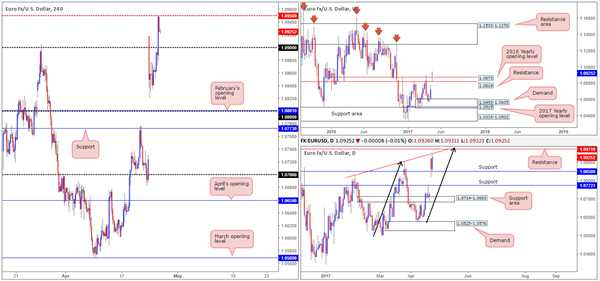
Going into the early hours of yesterday's US segment, H4 price cleared the 1.09 handle on lower-than-expected US consumer confidence and ended the day touching gloves with mid-level resistance at 1.0950. While the bulls certainly appear in fine form this morning, traders may want to take into account that not only is 1.0950 now in play, but twenty or so pips above here there's a daily resistance sitting at 1.0971 (converges with a trendline resistance taken from the high 1.0828 and an AB=CD completion point at 1.0980 [black arrows]). What is strongly favoring the bulls at the moment, however, is weekly price. Notice how the week's open forced the unit above resistance at 1.0819 and the 2016 yearly opening level at 1.0873, which are both currently being used as support.
Our suggestions: Based on the above structure, we see three possible trade scenarios:
Look to buy the couple on any retest seen at 1.09. There's not much H4 confluence seen here though, so waiting for additional confirmation is advised (a reasonably sized H4 bull candle should suffice – preferably a full-bodied candle).
Wait and see if the daily bulls can close price above the current daily resistance. Should this come to fruition, one could then look to trade any retest seen thereafter.
Go against the grain and consider shorting from 1.0971, given the daily confluence seen at the daily resistance level. To be on the safe side, we would personally wait for a H4 bear candle (preferably a full-bodied close) to form before committing, since ending up on the wrong side of weekly flow would not be pleasant.
Data points to consider: No high-impacting economic events.
Levels to watch/live orders:
- Buys: 1.09 region ([waiting for a reasonably sized H4 bull candle to form before pulling the trigger is advised] stop loss: ideally beyond the candle's tail). Watch for a daily close to be seen above 1.0971.
- Sells: 1.0971 region ([waiting for a reasonably sized H4 bear candle to form before pulling the trigger is advised] stop loss: ideally beyond the candle's wick).
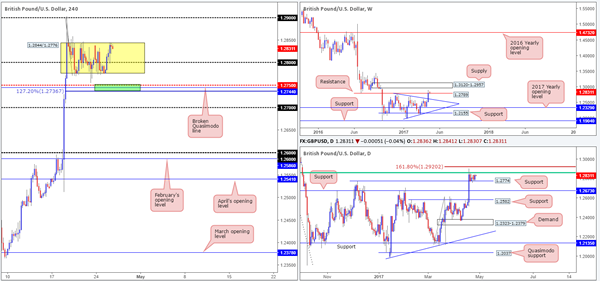
GBP/USD
Since the 19th April, H4 price has been busy chiseling out a consolidation zone fixed between 1.2844/1.2776. Directly below this range sits 1.2750: an interesting level given that there's also a AB=CD 127.2% Fib extension seen nearby at 1.2736 (drawn from the high 1.29) that unites closely with a broken Quasimodo line pegged at 1.2744 (green area).
Over on the weekly chart, we can see price trading marginally above resistance coming in at 1.2789, which could eventually encourage further buying up to supply at 1.3120-1.2957. Down on the daily chart, nevertheless, the candles are seen consolidating between support at 1.2774 and a H4 61.8% Fib resistance at 1.2859 (taken from the high at 1.3445).
Our suggestions: Technically speaking, we see two possible trade setups:
The H4 zone marked in green at 1.2736/1.2750 is, in our opinion, a nice area to consider an intraday bounce from. Apart from the H4 confluence, this zone is also seen planted directly beneath both the H4 range and the said daily support. For that reason, it could perhaps be a nice base to help facilitate a fakeout! The only grumble, of course, is that weekly sellers could still be active from resistance at 1.2789, hence the reason for not expecting much more than an intraday bounce from the H4 area.
A H4 close above the aforementioned H4 range could be considered an important cue for longs. A retest to the top side of this broken area as support followed by a reasonably sized H4 bull candle (preferably a full-bodied candle) would be sufficient enough to enter long, targeting 1.29, followed by 1.2920 (weekly 161.8% Fib ext. taken from the low 1.2108) and then the underside of weekly supply at 1.2957.
Data points to consider: No high-impacting economic events.
Levels to watch/live orders:
- Buys: 1.2736/1.2750 (stop loss: at least five pips beyond the lower edge of the area). Watch for price to engulf 1.2844 and then look to trade any retest seen thereafter ([waiting for a H4 bull candle to form following the retest is advised] stop loss: ideally beyond the candle's tail).
- Sells: Flat (stop loss: N/A).
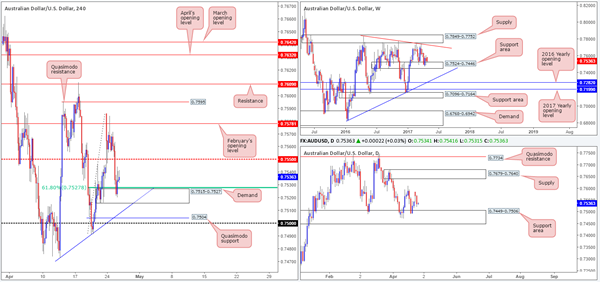
AUD/USD
Helped by US dollar weakness, the commodity currency found a pocket of bids around H4 demand at 0.7515-0.7527, which happens to fuse together with a H4 61.8% Fib support at 0.7527 (taken from the low 0.7491). Despite this, the bulls appear to be struggling to register any noteworthy moves from here, with an array of H4 selling wicks seen forming overhead.
Climbing up to the weekly chart, the bulls have so far failed to generate anything of note out of the support area marked at 0.7524-0.7446. There's not much difference seen on the daily chart as price is currently trading from a support area at 0.7449-0.7506 seen lodged within the said weekly support area at 0.7449-0.7506.
Our suggestions: We see very little to hang our hat on here this morning. Even if the weekly and daily charts emphasized strong buying pressure, a long from the current H4 demand would be difficult from a risk/reward perspective, given how close the H4 mid-level resistance is at 0.7550. Therefore, opting to stand on the sidelines today may very well be the better path to take.
Data points to consider: Aussie inflation data at 2.30am GMT+1.
Levels to watch/live orders:
- Buys: Flat (stop loss: N/A).
- Sells: Flat (stop loss: N/A).
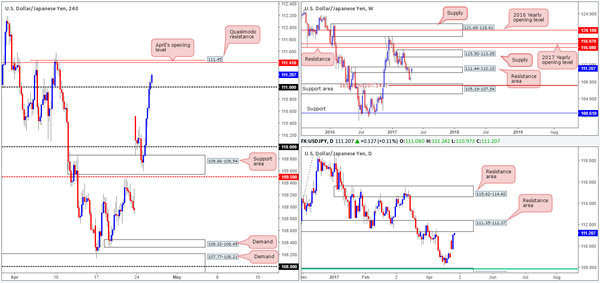
USD/JPY
The value of the US dollar strengthened in aggressive fashion against the Japanese yen yesterday, despite US consumer confidence coming in lower than expected. As can be seen from the H4 chart, the day ended with price closing above the 111 handle. Should the bulls remain in the driving seat here, there's a good chance that the pair will strike April's opening level at 111.41/Quasimodo resistance at 111.45.
Our suggestions: To make a long story short, our desk has placed a pending sell order at 111.41 with a stop set at 111.60 (above the H4 Quasimodo apex). Our rationale behind this simply comes from seeing the two H4 levels positioned around not only a weekly resistance area at 111.44-110.10, but also a daily resistance area coming in at 111.35-112.37.
The first take-profit target is set at 111, and upon a decisive close seen beyond this number, we'll be looking to initiate a trailing stop.
Data points to consider: No high-impacting economic events.
Levels to watch/live orders:
- Buys: Flat (stop loss: N/A).
- Sells: 111.41 ([pending order] stop loss: 111.60).
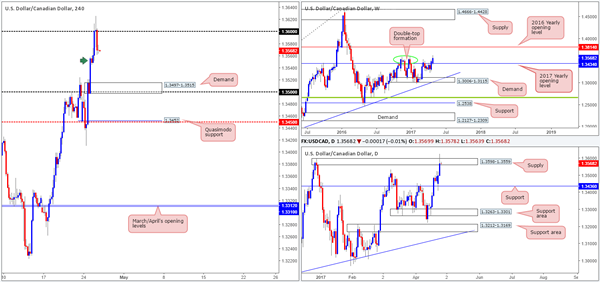
USD/CAD
During the course of yesterday's sessions the USD/CAD aggressively punched its way through 1.36 and tapped a high of 1.3626, before collapsing lower. Although the nearby H4 demand seen marked with a green arrow at 1.3545-1.3559 could hold price higher today, it is not this area that we're interested in. It's the H4 demand base seen below that's wrapped around the 1.35 handle at 1.3497-1.3515.
Here's the idea. The weekly chart shows that price is not only respecting the 2017 yearly opening level at 1.3434 as support, it also recently broke above a well-defined double-top formation seen around the 1.3588 neighborhood (green circle). The daily supply at 1.3598-1.3559 currently in play, which was also aggressively spiked yesterday, will likely help in pushing things down to our H4 demand.
Our suggestions: Wait and see if H4 price can stretch down to H4 demand at 1.3497-1.3515. Dependent on the time of day, a long from here without the need for additional confirmation is possible.
Data points to consider: Canadian retail sales at 1.30pm, Crude oil inventories at 3.30pm GMT+1.
Levels to watch/live orders:
- Buys: 1.3497-1.3515 ([dependent on the time of day, a long from here without the need for additional confirmation is possible] stop loss: 1.3495).
- Sells: Flat (stop loss: N/A).
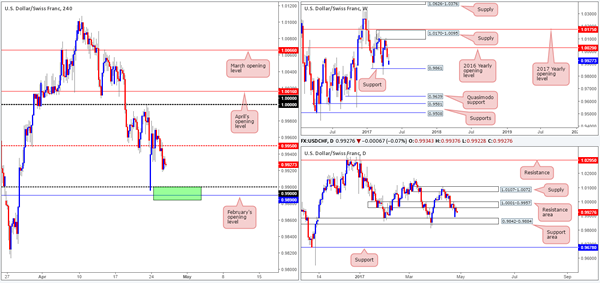
USD/CHF
H4 bulls, as you can see, were unable to sustain gains above the mid-level resistance at 0.9950 yesterday. Price closed below the number amid the early hours of London and sold off from this region going into the opening of the US segment, eventually bringing price down to a low of 0.9918. Given this factor, the nearby 0.99 handle may very well come into play today. 0.99 is an interesting number. Not only because it is likely being watched by the majority of the market, but also for the reason that it is seen positioned nearby February's opening level at 0.9890 and the top edge of a daily support area at 0.9842-0.9884 (green area). The only grumble we would have if we were to take a long position from this area is the fact that weekly price could potentially push the market through our H4 buy zone to shake hands with support at 0.9861.
Our suggestions: Watch for H4 price to attack the 0.9884/0.9900 region today. Should this come to fruition, and price chalks up a reasonably sized H4 bull candle (preferably a full-bodied candle), then our team would have no hesitation in pressing the buy button. As of this point it is difficult to pin-point a take-profit target since we are yet to see the approach.
Data points to consider: No high-impacting economic events.
Levels to watch/live orders:
- Buys: 0.9884/0.99 ([waiting for a reasonably sized H4 bull candle to form before pulling the trigger is advised] stop loss: ideally beyond the candle's tail).
- Sells: Flat (stop loss: N/A).
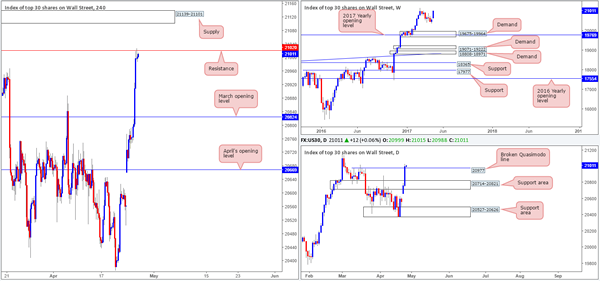
DOW 30
The DOW aggressively climbed higher on Tuesday, following Monday's rally. Several H4 tech resistances were wiped out during the bullish onslaught, with H4 price not stabilizing until reaching resistance drawn from 21020. Over on the daily candles, the unit crossed above a Quasimodo resistance at 20977 thanks to the recent advance. In the event that this line is now respected as support, we could potentially see US equities pop to fresh highs sometime this week.
Our suggestions: An ideal scenario would be to see H4 price print a decisive close beyond resistance at 21020. This – coupled with a retest and a reasonably sized H4 bull candle (preferably a full-bodied close) would, in our opinion, be enough to validate a long trade here, targeting H4 supply at 21139-21101, and then possibly on to fresh record highs.
Data points to consider: No high-impacting economic events.
Levels to watch/live orders:
- Buys: Watch for H4 price to engulf H4 resistance at 21020 and then look to trade any retest seen thereafter ([waiting for a H4 bull candle to form following the retest is advised] stop loss: ideally beyond the candle's tail).
- Sells: Flat (stop loss: N/A).
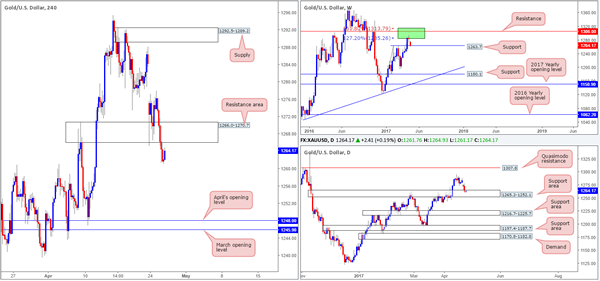
GOLD
Kicking this morning's report off with a look at the weekly chart, it's relatively easy to see what side is in control at the moment. Weekly bears, after engaging with the two Fibonacci extensions 161.8/127.2% at 1313.7/1285.2 taken from the low 1188.1 (green zone), have brought the yellow metal down to a support level drawn in at 1263.7. The story on the daily chart, nevertheless, shows the candles to be trading within the walls of a support area at 1265.2-1252.1 (encapsulates the said weekly support level). However, should the H4 resistance area at 1266.0-1270.7 hold ground today, this could spell trouble for the bulls.
Our suggestions: Neither a long nor short seems attractive at this time. While entering long would see you trading in line with the current weekly support level and daily support area, it would also mean buying into a H4 resistance zone! By the same token, a short from the H4 resistance area would potentially position you against weekly and daily flow. So, we have come to the conclusion that remaining flat for the time being may be the better path to take.
Levels to watch/live orders:
- Buys: Flat (stop loss: N/A).
- Sells: Flat (stop loss: N/A).
European Open Briefing: The Australian Dollar Came Under Pressure
Global Markets:
- Asian stock markets: Nikkei up 0.35 %, Shanghai Composite gained 0.30 %, Hang Seng rose 0.60 %, ASX 200 rallied 0.65 %
- Commodities: Gold at $1265 (-0.10 %), Silver at $17.66 (+0.05 %), WTI Oil at $49.45 (-0.20 %), Brent Oil at $52.50 (-0.20 %)
- Rates: US 10 year yield at 2.34, UK 10 year yield at 1.09, German 10 year yield at 0.39
News & Data:
- Australia CPI (YoY) (Q1): 2.10% (est 2.20%, prev 1.50%)
- Australia CPI (QoQ) (Q1): 0.50% (est 0.60%, prev 0.50%)
- Australia CPI Trimmed Mean (YoY) (Q1): 1.90% (est 1.80%, prev 1.60%)
- Australia CPI Trimmed Mean (QoQ) (Q1): 0.50% (est 0.50%, prev 0.40%)
- Australia CPI Weighted Median (YoY) (Q1): 1.70% (est 1.80%, prev 1.50%)
- Australia CPI Weighted Median (QoQ) (Q1): 0.40% (est 0.50%, prev 0.40%)
- Australia ANZ Roy Morgan Weekly Consumer Confidence Index (23/Apr): 111.2 (prev 112.6)
- Australia Skilled Vacancies (MoM) (Mar): -0.60% (prev 0.10%)
- Asian stocks hover near two-year highs on U.S. optimism, euro steady – RTRS
- Nasdaq tops 6,000 as earnings boost Wall St; U.S. tax code eyed – RTRS
Markets Update:
The Australian Dollar came under pressure following weaker than expected inflation data. The headline CPI figure arrived at 2.10 % y/y, slightly below the forecast. AUD/USD fell from 0.7545 to 0.7505. The technical outlook for the currency pair is rather poor as well. Should it break below 0.7480 support, it is likely to reach 0.73 quite soon.
The Canadian Dollar has received plenty of attention in the past two trading days. Announcements about US tariffs on Canadian products and a decline in Oil prices led to a decline of the currency. USD/CAD broke through 1.36 yesterday and rallied to 1.3625. While the pair retraced somewhat in Asia, it will likely remain bid, and further gains seem likely.
USD/JPY was boosted by the rally in equity markets. The break above 110.50 resistance suggests that the pair will test 112 resistance soon. Meanwhile, the Euro and Pound are consolidating. Traders are now looking forward to tomorrow’s ECB rate decision.
Upcoming Events:
- 13:30 GMT – Canadian Retail Sales
- 15:30 GMT – US Crude Oil Inventories
Australia’s Annual inflation Surged To Its Highest Level Since 2014 In 1Q 2017
For the 24 hours to 23:00 GMT, the AUD declined 0.38% against the USD and closed at 0.7538.
LME Copper prices rose 0.7% or $40.5/MT to $5652.5/MT. Aluminium prices rose 0.8% or $15.0/MT to $1943.0/MT.
In the Asian session, at GMT0300, the pair is trading at 0.7512, with the AUD trading 0.34% lower against the USD from yesterday's close, following the release of a softer-than-expected inflation data.
Early morning data revealed that Australia's consumer price index (CPI) climbed 0.5% on a quarterly basis in 1Q 2017, falling short of market expectations for a rise of 0.6% and compared to a similar rise in the previous quarter. Meanwhile, on an annual basis, the CPI advanced 2.1% in the first quarter of 2017, surpassing the 2.0% mark for the first time since 2014, thus easing the threat of deflation in the nation. The CPI had advanced 1.5% in the prior quarter, whereas markets anticipated for a rise of 2.2%.
The pair is expected to find support at 0.7489, and a fall through could take it to the next support level of 0.7466. The pair is expected to find its first resistance at 0.7549, and a rise through could take it to the next resistance level of 0.7586.
The currency pair is trading below its 20 Hr and 50 Hr moving averages.

Euro Trading On A Stronger Footing This Morning
For the 24 hours to 23:00 GMT, the EUR rose 0.56% against the USD and closed at 1.0928.
In economic news, industrial business climate index in France remained steady at a level of 104.0 in April, meeting market expectations.
The greenback traded mixed against a basket of major currencies, after the latest economic data painted a gloomy picture of the world’s largest economy.
The US consumer confidence index fell more-than-expected to a level of 120.3 in April, from a revised sixteen-year high level of 124.9 in the prior month, as optimism about the economy dwindled. Markets had anticipated the index to drop to a level of 122.5.
On the other hand, the nation’s new home sales registered an unexpected rise of 5.8% on a monthly basis, to a level of 621.0K in March, accelerating at its fastest pace in eight months, thus underlining strength in the economy, despite an apparent slowdown in the first quarter. Markets were expecting new home sales to ease to a level of 584.0K, compared to a revised level of 587.0K in the prior month. Further, the nation’s housing price index surged to a nearly three-year high level, after it rose 0.8% MoM in February, surpassing market consensus for a gain of 0.4% and compared to a revised rise of 0.2% in the previous month.
Other economic data revealed that the US Richmond Fed manufacturing index dropped less-than-anticipated to a level of 20.0 in April, following a level of 22.0 in the previous month.
In the Asian session, at GMT0300, the pair is trading at 1.0938, with the EUR trading 0.09% higher against USD from yesterday’s close.
The pair is expected to find support at 1.0875, and a fall through could take it to the next support level of 1.0813. The pair is expected to find its first resistance at 1.0975, and a rise through could take it to the next resistance level of 1.1013.
In absence of any major economic releases in the Euro-zone today, traders would focus on the US MBA mortgage applications data, due later today. Meanwhile, investors will seek details on the US President, Donald Trump’s tax reform plan, scheduled to be announced later today.
The currency pair is trading above its 20 Hr and 50 Hr moving averages.
