
Sample Category Title
U.S. Home Prices Continue to Hit New Highs
National home prices rose 0.4 percent in February and are up 5.8 percent year over year, according to the S&P CoreLogic Case-Shiller Index. Prices continue to be fueled by a steady uptrend in sales and low inventory.
National Home Prices Edge Up
Supported by tight supply and steady gains in home sales, U.S. home prices continue to edge higher. The S&P CoreLogic Case- Shiller National Home Price Index is up 5.8 percent over the past 12 months and the 20-City and 10-City indices are up 5.9 percent and 5.2 percent, respectively.
Among the 20 cities, Seattle continues to lead price gains, reporting a 12.2 percent increase over the year.
Solid Seller's Market
Sentiment reports indicate that consumers feel increasingly confident that it is a "good time to sell." Survey measures have been corroborated by recent hard data as the NAR reports properties are selling at a faster rate. Existing homes were on the market for an average of just 34 days in March, down from 45 days in February and 50 days in January. Low inventories and rising demand are likely to continue to fuel price pressures.
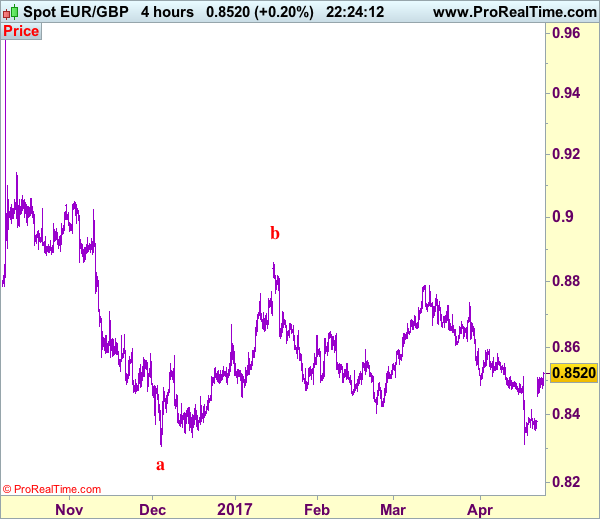
Trade Idea: EUR/GBP – Stand aside
EUR/GBP - 0.8523
Recent wave: Major double three (A)-(B)-(C)-(X)-(A)-(B)-(C) is unfolding and 2nd (A) has possibly ended at 0.6936.
Trend: Near term down
Original strategy :
Sold at 0.8475, stopped at 0.8515
Position : - Short at 0.8475
Target : -
Stop : - 0.8515
New strategy :
Stand aside
Position : -
Target : -
Stop : -
The single currency has continued edging higher and broke above indicated previous resistance at 0.8512, dampening our bearishness and signal temporary low has been formed at 0.8312, hence near term upside risk remains for the rebound from 0.8312 to bring retracement of recent decline to 0.8545-50, however, reckon resistance at 0.8580 would hold from here.
In view of this, would not chase this rise here and would be prudent to buy euro on subsequent pullback as 0.8450-55 should limit downside. Only below previous resistance at 0.8415 would abort and signal top is formed instead, bring weakness to 0.8380-85 but break of support at 0.8351 is needed to signal the rebound from 0.8312 has ended, bring retest of this level first.
Our preferred count is that, after forming a major top at 0.9805 (wave V), (A)-(B)-(C) correction is unfolding with (A) leg ended at 0.8400 (A: 0.8637, B: 0.9491 and 5-waver C ended at 0.8400. Wave (B) has ended at 0.9413 and impulsive wave (C) has either ended at 0.8067 or may extend one more fall to 0.8000 before prospect of another rally. Current breach of indicated resistance at 0.9043 confirms our view that the (C) leg has ended and bring stronger rebound towards 0.9150/54, then towards 0.9240/50.
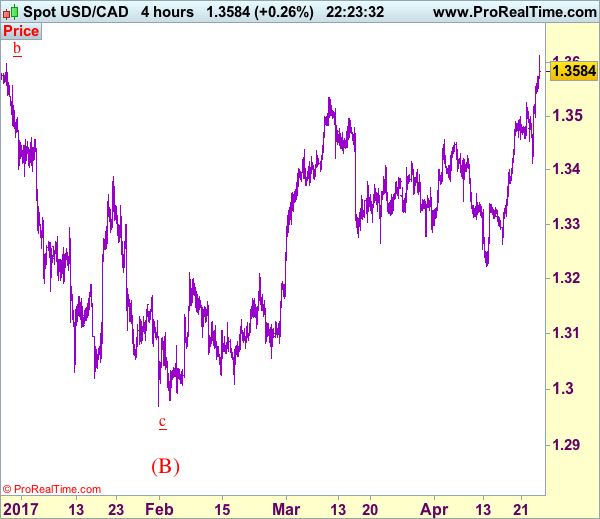
Trade Idea: USD/CAD – Target met and stand aside
USD/CAD - 1.3588
Recent wave: Only wave v of c has ended at 0.9407 and wave C of major A-B-C correction is underway for headway to 1.4700
Trend: Near term up
Original strategy :
Bought at 1.3430, met target at 1.3590
Position: - Long at 1.3430
Target: - 1.3590
Stop: -
New strategy :
Stand aside
Position: - Long at 1.3430
Target: - 1.3590
Stop:- 1.3410
Current anticipated rally adds credence to our bullish view and the breach of previous resistance at 1.3599 confirms early upmove has resumed, hence upside bias remains for recent rise to extend further gain to 1.3650-60, however, near term overbought condition should prevent sharp move beyond 1.3690-00 and reckon 1.3750-60 would hold from here, bring retreat later.
As we have taken profit on our long position entered at 1.3430, would not chase this rise here and would be prudent to stand aside for now, then look to buy again on subsequent pullback as 1.3500 should limit downside. Below 1.3465-70 would risk weakness to 1.3430 but indicated support at 1.3411 should contain downside and bring rebound later.
To recap, wave B from 1.3066 is unfolding as an a-b-c and is sub-divided as a: 1.2192, b: 1.2716 and wave c is a 5-waver with i: 1.1983, ii: 1.2506, extended wave iii with minor iii at 1.0206, wave iv ended at 1.0781 and wave v as well as wave iii has ended at 0.9931, hence the subsequent choppy trading is the wave iv which is unfolding as (a)-(b)-(c) with (a) leg of iv ended at 1.0854, followed by (b) leg at 1.0108 and (c) leg as well as the wave iv ended at 1.0674. The wave v is sub-divided by minor wave (i): 0.9980, (ii): 1.0374, (iii): 0.9446, (iv): 0.9913 and (v) as well as v has possibly ended at 0.9407, therefore, consolidation with upside bias is seen for major correction, indicated target at 1.3700 and 1.4000 had been met and further gain to 1.4700 would be seen later.
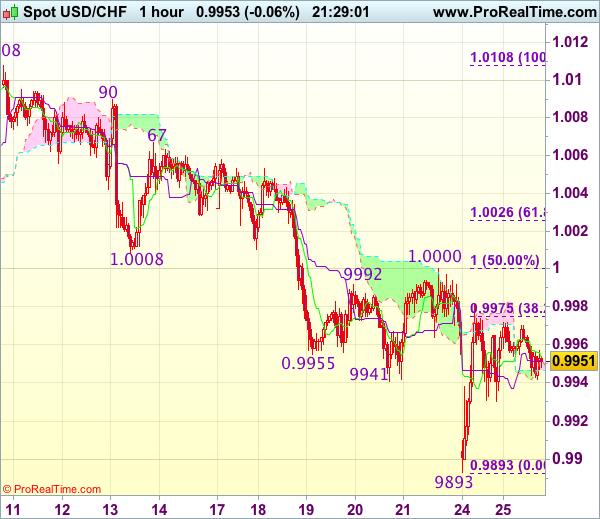
Trade Idea Update: USD/CHF – Stand aside
USD/CHF - 0.9948
New strategy :
Stand aside
Position : -
Target : -
Stop : -
Despite dropping to 0.9893 yesterday, lack of follow through selling and the subsequent rebound suggest consolidation above this level would be seen and another bounce to 0.9975-80 cannot be ruled out, however, reckon 1.0000 (said resistance and 50% Fibonacci retracement of 1.0108-0.9893) would limit upside and bring another decline later. Below said support at 0.9893 would extend the fall from 1.0108 top to 0.9865-70 (2 times extension of 1.0108-1.0008 measuring from 1.0067) but support at 0.9831 would hold, bring rebound later.
In view of this, would be prudent to stand aside in the meantime. Above previous support at 1.0008 would suggest low is formed instead, bring rebound to 1.0025-30 (61.8% Fibonacci retracement of 1.0108-0.9893) but price should falter below resistance at 1.0067.
Yen Slips to 2-Week Low, US Consumer Confidence Next
USD/JPY has posted considerable gains on Tuesday, as the pair trades at 110.60 in the North American session. On the release front, Japanese SPPI remained at 0.8%, edging above the agreement of 0.7%. Over in the US, we'll get a look at two key events. CB Consumer Confidence is expected to improve to 123.7, while New Home Sales is forecast to edge lower to 590 thousand.
Japanese SPPI, which measures inflation in the corporate sector, posted a solid reading of 0.8%, but other inflation indicators haven't kept pace. We'll get a look at more inflation numbers, highlighted by Tokyo Core CPI, the primary gauge of consumer inflation has posted a steady stream of declines, and a decline of 0.2% is expected in the April reading. If the indicator misses expectations, the yen could lose more ground.
The Bank of Japan will release its monetary policy statement on Wednesday, and is expected to maintain interest rates at -0.10%. The negative rates are part of the BoJ's ultra-loose monetary policy, which is expected to continue until inflation levels move closer to the central bank's target of around 2 percent. Japan's economy has improved in recent months, as a weak yen and stronger global demand have boosted exports and boosted the manufacturing sector. However, Japanese policymakers need to tread carefully, as Japan's trade surplus has triggered sharp criticism from the US President Trump. The weak yen has also drawn Trump's ire, as he recently called out Japan for manipulating its currency for trade purposes. Still, the most recent US Treasury Currency Report, did not name Japan as a currency manipulator. If the yen weakens and heads back towards the 120 level, the Japanese are likely to get an earful from Trump about unfair trade practices.
President Trump will have to reach out to the Democrats in order to avoid a shutdown of the federal government on Saturday. Congress must pass a spending bill which will fund the government until October, but the bill requires the backing of 60 senators. This means that the Republicans (who control 52 seats) will need the support of 8 Democrats. This has led to bipartisan negotiations, and it's reasonable to expect that these talks could go down to the wire, as both sides try to stick to their positions and try not to blink first. The last shutdown was in 2013, lasting 17 days. Another shutdown would be embarrassing for Trump, as it would start on his 100th day in office and would cast doubts on his ability to push his budget and tax plan through Congress.
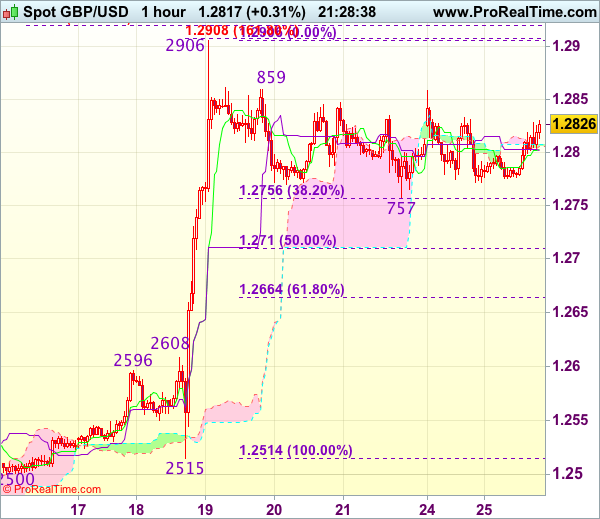
Trade Idea Update: GBP/USD – Buy at 1.2710
GBP/USD - 1.2820
Original strategy :
Buy at 1.2710, Target: 1.2850, Stop: 1.2675
Position : -
Target : -
Stop : -
New strategy :
Buy at 1.2710, Target: 1.2850, Stop: 1.2675
Position : -
Target : -
Stop : -
Cable has remained confined within near term established range and further sideways trading is in store, whilst another test of Friday’s low at 1.2757 cannot be ruled out, reckon downside should be limited to 1.2700-10 (50% Fibonacci retracement of 1.2515-1.2906) and bring another rally, break of 1.2859 would signal the pullback from 1.2906 has ended, bring retest of this level, above there would extend recent upmove to 1.2920-30 (2 times extension of 1.2365-1.2575 measuring from 1.2500), then 1.2950 but loss of upward momentum should prevent sharp move beyond 1.2990-00 (1.236 times projection of 1.2109-1.2616 measuring from 1.2365 and psychological resistance).
In view of this, would not chase this rise here and would be prudent to buy cable on subsequent pullback as downside should be limited to 1.2710 (50% Fibonacci retracement of 1.2515-1.2906), bring another rise. Below 1.2700 would defer and signal top has been formed, risk correction to 1.2660-65 (61.8% Fibonacci retracement of 1.2515-1.2906) and price should stay well above 1.2608-16 (previous resistance now support).
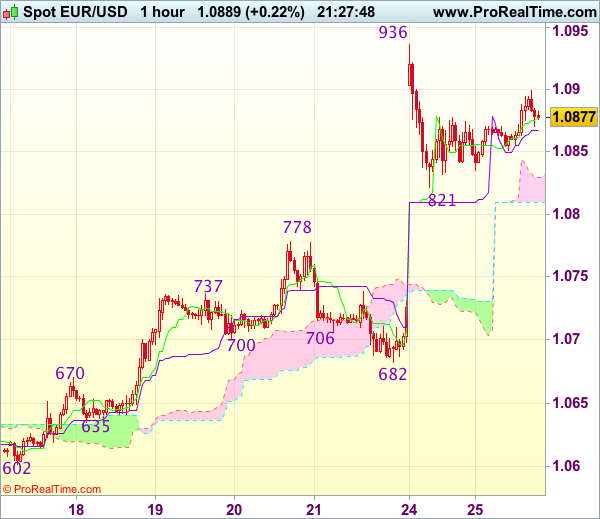
Trade Idea Update: EUR/USD – Stand aside
EUR/USD - 1.0887
New strategy :
Stand aside
Position : -
Target : -
Stop : -
Euro’s retreat after rising to 1.0936 yesterday suggests consolidation below this level would be seen but reckon downside would be limited to 1.0850 and support at 1.0821 should hold, bring another rise later, above 1.0936 resistance would signal recent erratic upmove from 1.0340 has resumed and extend gain to 1.0975-80 and possibly towards 1.1000 which is likely to hold from here due to loss of momentum.
In view of this, would not chase this rise here and would be prudent to stand aside in the meantime. Below 1.0850 would bring test of said support at 1.0821 but break there is needed to signal top has possibly been formed, then fall to previous resistance at 1.0778 (now support) would follow, break there would add credence to this view and extend weakness to 1.0750.
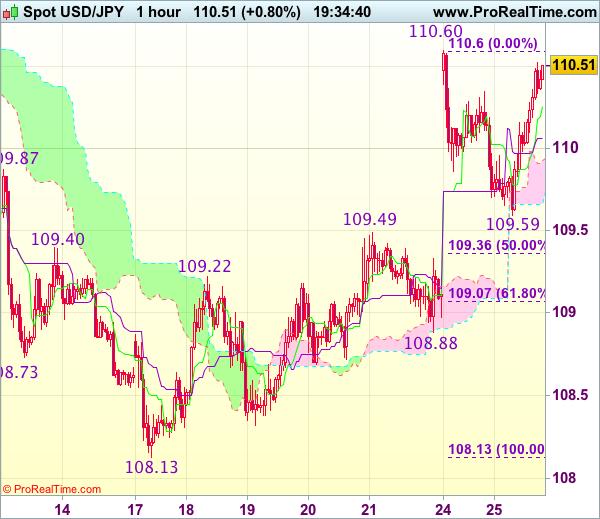
Trade Idea Update: USD/JPY – Stand aside
USD/JPY - 110.50
New strategy :
Stand aside
Position : -
Target : -
Stop : -
Although the greenback found good support at 109.59 and has rebounded, break of yesterday’s high at 110.60 is needed to signal recent upmove from 108.13 low has resumed and may extend further gain to 110.90-00, however, near term overbought condition should prevent sharp move beyond 111.25-30 and price should falter well below resistance at 111.58, risk from there is seen for a retreat later.
In view of this, would not chase this rise here and would be prudent to stand aside in the meantime. Below 109.90-95 would risk another retreat to 109.59 but break of previous resistance at 109.49 is needed to signal top is formed instead, bring correction of recent rise to 109.05-10 (61.8% Fibonacci retracement of 108.13-110.60).
Selloff in Canadian Dollar Extends, Euro and Sterling Firm
European majors stay generally firm today, continuing to ride on the boost from French election result. Meanwhile, Dollar closely follow as strong risk appetite lifts Fed rate hike expectations. Meanwhile, markets are eagerly waiting for US President Donald Trump to announce his tax reforms. Commodity currencies are generally under pressure and decoupled from stock markets. In particular, Canadian Dollar is pressured by weakness in oil prices, as well as US's announcement of tariffs for lumber products.
Trump imposes countervailing duties on Canadian Lumber products
Commodity currencies are generally lower following the Japanese Yen. Canadian Dollar is pressured by news that US President Donald Trump's administration imposed countervailing duties on Canadian Lumber products, ranging from 3% to 24.1%. Trump said yesterday that there will be 20% tax of softwood lumber coming from Canada. The move is seen as an escalation of trade battle between the US and its neighboring countries. US Commerce Secretary Wilbur Ross said that "it became apparent that Canada intends to effectively cut off the last dairy products being exported from the United States." And, because of unfair Canadian subsidies to the lumber industry, there is a need to impose "countervailing duties of roughly one billion dollars."
Canada fired back as a joint statement from Foreign Minister Chrystia Freeland and Natural Resources Minister Jim Carr noted that the tariff is an "unfair and punitive duty" imposed on baseless and unfounded" allegations. And, Canada "will vigorously defend the interests of the Canadian softwood lumber industry, including through litigation." Meanwhile, both ministries noted that "a negotiated settlement is not only possible but in the best interests of both countries."
Trump to cut corporate tax rate to 15%
The outlook of Fed rate, yields and Dollar will largely depend on what US President Donald Trump will deliver this Wednesday regarding his tax reforms. It's reported that Trump would seek to lower corporate income tax rate to 15%, down from 35%. Meanwhile, individual tax rate could be capped at 33%. However, there are talks that such a plan would set up clashes with Republicans as some of them would oppose to raising the country's debt. The outline of the plan itself would be the first test for Dollar. And the execution of the plan, including parliamentary approval, will be another test.
UK PM May to Meet EC Juncker
UK Prime Minister Theresa May will have a face-to-face meeting with President of the European Commission Jean-Claude Juncker and EU chief Brexit negotiator Michel Barnier tomorrow. That comes ahead of the EU summit on April 29, where leaders will approve the EU's Brexit negotiation plan and guidelines. It's reported that in the latest draft of EU negotiation plan, financial services was split off from wordings on the trade deal. And, "any future framework should safeguard financial stability in the Union and respect its regulatory and supervisory standards regime and application." That was believed to be in response to France's request to separate financial services with trade. Meanwhile, EU would push for reciprocal guarantees to give EU citizens in UK, and UK citizens in EU, to acquire permanent residence after a continuous period of five years. EU will approve the negotiation guidelines and plans on April 29 but will wait until UK elections in June to start formal negotiations.
BoJ Deputy Iwata: BoJ in exit simulation
BoJ Deputy Governor Kikuo Iwata said that "the BOJ is carrying out a simulation based on several assumptions of an exit strategy." However, he acknowledged that Japan is still far from meeting the inflation target of 2%. BoJ will start its two-day policy meeting tomorrow and announce policy decisions on Thursday. It's widely expected that the central bank will keep all monetary policies unchanged. Governor Haruhiko Kuroda said last week that it's "premature to discuss in an exact way about exit strategy." Meanwhile, Kuroda also talked down the question of scarcity of assets to purchase. Kuroda noted that "I don't think our monetary policy is constrained by the fact that we have acquired 40 percent of JGBs already, or our balance sheet is about 80 percent of GDP, which is certainly large compared with other central banks."
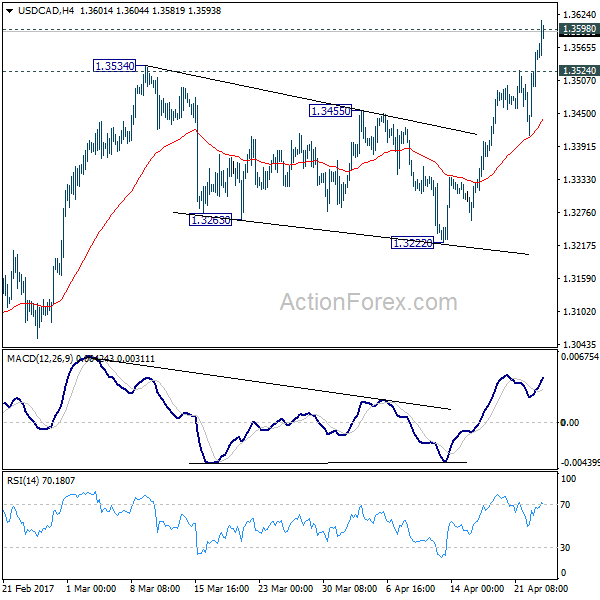
USD/CAD Mid-Day Outlook
Daily Pivots: (S1) 1.3432; (P) 1.3476; (R1) 1.3543; More....
USD/CAD's rise continues today. The break of 1.3598 key resistance indicates resumption of medium term rise from 1.2460. Intraday bias remains on the upside and USD/CAD should target next medium term fibonacci level at 1.3838. On the downside, below 1.3524 minor support will turn bias neutral and bring retreat. But downside should be contained well above 1.3222 support and bring another rise.
In the bigger picture, price actions from 1.4689 medium term top are seen as a correction pattern. The first leg has completed at 1.2460. The second leg from 1.2460 is likely still in progress and could target 61.8% retracement of 1.4689 to 1.2460 at 1.3838. We'd look for reversal signal there to start the third leg. However, break of 1.2968 will argue that the third leg has already started and should at least bring a retest of 1.2460 low. Meanwhile, sustained trading above 1.3838 would pave the way to retest 1.4689 high.
Economic Indicators Update
| GMT | Ccy | Events | Actual | Forecast | Previous | Revised |
|---|---|---|---|---|---|---|
| 23:50 | JPY | Corporate Service Price Y/Y Mar | 0.80% | 0.80% | 0.80% | |
| 08:30 | GBP | Public Sector Net Borrowing (GBP) Mar | 4.4B | 2.6B | 1.1B | -0.7B |
| 13:00 | USD | House Price Index M/M Feb | 0.80% | 0.30% | 0.00% | 0.20% |
| 13:00 | USD | S&P/Case-Shiller Composite-20 Y/Y Feb | 5.90% | 5.80% | 5.73% | |
| 14:00 | USD | New Home Sales Mar | 584K | 592K | ||
| 14:00 | USD | Consumer Confidence Apr | 122.5 | 125.6 |
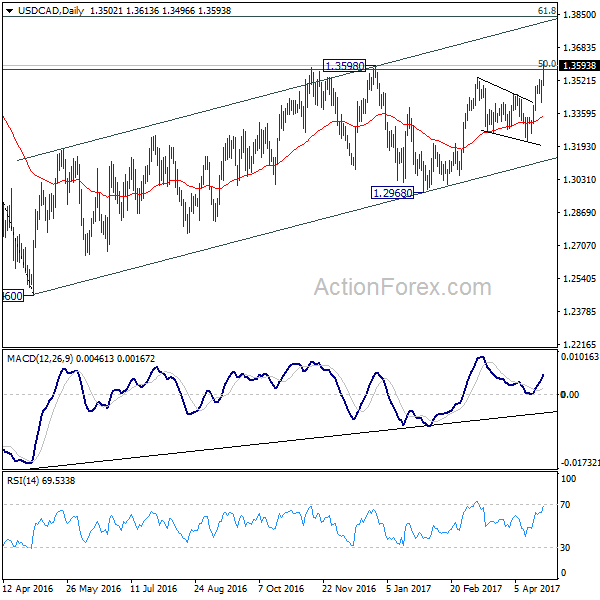
USD/CAD Mid-Day Outlook
Daily Pivots: (S1) 1.3432; (P) 1.3476; (R1) 1.3543; More....
USD/CAD's rise continues today. The break of 1.3598 key resistance indicates resumption of medium term rise from 1.2460. Intraday bias remains on the upside and USD/CAD should target next medium term fibonacci level at 1.3838. On the downside, below 1.3524 minor support will turn bias neutral and bring retreat. But downside should be contained well above 1.3222 support and bring another rise.
In the bigger picture, price actions from 1.4689 medium term top are seen as a correction pattern. The first leg has completed at 1.2460. The second leg from 1.2460 is likely still in progress and could target 61.8% retracement of 1.4689 to 1.2460 at 1.3838. We'd look for reversal signal there to start the third leg. However, break of 1.2968 will argue that the third leg has already started and should at least bring a retest of 1.2460 low. Meanwhile, sustained trading above 1.3838 would pave the way to retest 1.4689 high.