
Sample Category Title
Markets to Focus on President Trump’s Tax Reform Announcement on Wednesday
- Euro continues its surge against all major currencies
- French presidency candidate Le Pen to temporarily step aside as Front National Leader
- Markets to focus on President Trump's tax reform announcement on Wednesday
Yesterday saw the Euro continue its relief-style rally against the pound, and all major currencies, after it was declared Macron and Le Pen reached the final round of the French elections. Centrist Emmanuel Macron is the 'continuity-candidate' for the markets – ironically as he does not come from either of France's major parties. A Macron victory is positive for the Euro hence its gains. Investors are satisfied that the polls in France have been accurate and Macron has a good chance of a sweeping victory. Currently polls suggest Macron will win 62% of the vote vs Le Pen's 38%. However, the result of the French election is not a done deal and we should expect to see Euro gains limited because the prospect of a Le Pen win in the final round cannot be completely dismissed like we experienced firsthand with a Brexit and Trump victory.
The danger for Macron is Le Pen's supporters come out in force in the Second Round while his own stay at home assuming it's a done deal. Also, is Macron able to attract the support of the losing candidates? The second and final round is Sunday 7th May, meanwhile ongoing polls and a TV debate on 3rd May will dictate movement for the Euro. Yesterday evening Le Pen announced she'll temporarily step aside as Front National leader to focus on becoming president. It appears to be a way for Le Pen to embrace a wider range of potential voters as she'll be above partisan considerations. Those who like Le Pen but not necessarily Front National may cast their vote for her. Charles de Gaulle did the same in 1958 portraying himself as a universal leader rather than just a political party leader.
The focus for this week will now turn to the European Central Bank monetary policy announcement and the tax reform announcement by U.S. President Trump on Wednesday. The markets are thinking that ECB President Draghi could taper their QE programme faster once the French hurdle is cleared, however, it is coming clear that the ECB are uncomfortable with the markets hawkish interpretation of their last monetary policy, with inflation still below their target. So President Draghi, may take this opportunity to emphasise their policy and will remain accommodative for the foreseeable future, which could see the gap which was created from the French elections - where the market closed on Friday and opened on Monday - filled.
After President Trump's first failed attempt on healthcare, the focus will turn to his tax reforms. The reflationary USD rally we experienced after a Trump victory was partly on the prospect of lower taxes. During his campaign President Trump said he wanted to cut corporate tax to 15% from 35% however both Republicans and Democrats are pushing for less drastic changes which could result in another humiliating failure for President Trump, resulting in the USD being sold off aggressively.
The US government is once again on the brink of another shutdown on Friday, however, with Republicans controlling both houses, the chances of shutdown is slim. We are likely to see a temporary extension passed whilst the longer term measures are being negotiated, like that of the funding of the border wall and subsidies over Obamacare.
Apart from UK GDP on Friday there is little on the economic calendar for the UK, Sterling will likely take its cue from markets' appetite for the US dollar highlighted above.
Quotes
- The four most beautiful words in our common language: I told you so.
- You'll never be lazy as whoever named the fireplace.
- How come you never see a headline like "Psychic win lottery"?
- Every novel is a mystery novel if you never finish it.
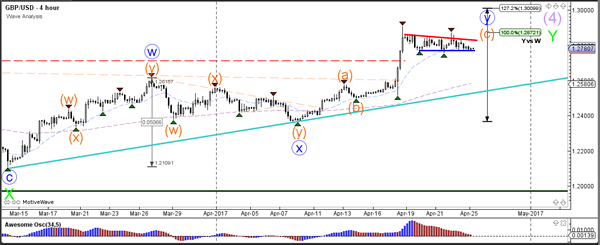
GBP/USD Elliott Wave Analysis
GBP/USD – 1.2818
GBP/USD – Wave 4 is unfolding as an (A)-(B)-(C) and could have ended at 1.7192
Cable has maintained a firm undertone after last week’s rally above indicated previous resistance at 1.2706 and 1.2775, adding credence to our view that low has indeed been formed at 1.1986 and bullishness remains for the erratic rise from 1.1986 to bring retracement of medium term decline, hence further gain to 1.2910-20 and 1.2950-60 would be seen, however, reckon psychological resistance at 1.3000 would limit upside and price should falter below 1.3140-50 (38.2% Fibonacci retracement of 1.5018-1.1986).
Our preferred count on the daily chart is that cable's rebound from 1.3500 (wave (A) trough) is unfolding as a wave (B) with A ended at 1.7043, followed by triangle wave B and wave C as well as wave (B) has possibly ended at 1.7192, below support at 1.4232 would add credence to this count, then further fall to 1.4000 level would follow but reckon downside would be limited to 1.3655 support and price should stay above previous support at 1.3500.
On the downside, whilst initial pullback to 1.2750 cannot be ruled out, reckon another previous resistance at 1.2706 would turn into support and contain downside, bring another rise later. Below previous resistance at 1.2616 (tentatively wave i top) would abort and suggest top is possibly formed, risk weakness to 1.2550-60 but break of 1.2500 support is needed to provide confirmation.
Recommendation: Buy at 1.2710 for 1.2910 with stop below 1.2610.
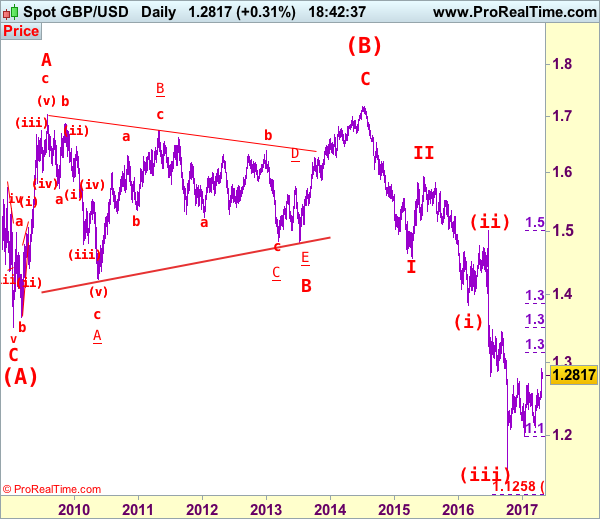
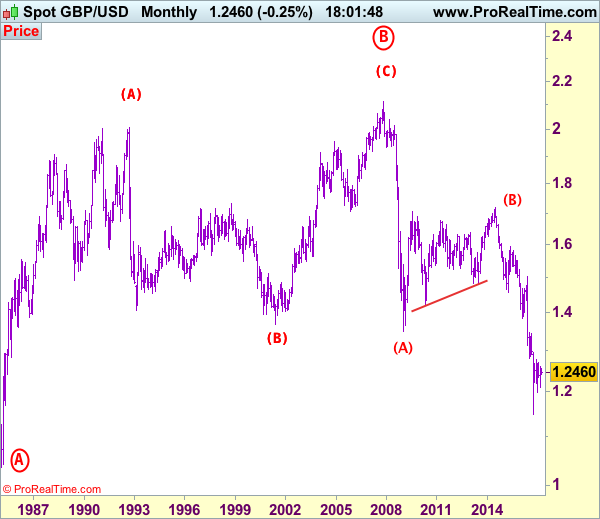
Longer term - Cable's rise from 1.0520 (Feb 1985) to 2.0100 (September 1992) is seen as [A], the decline to 1.3682 is labeled as (B) and (C) wave rally has ended at 2.1162 (9 Nov, 2007) which is also the top of larger degree wave B with circle. The selloff from there is a 5-waver with wave (A) ended at 1.3500 (23 Jan 2009), wave (B) itself is labeled as A: 1.6733, triangle wave B: 1.4813 and wave C as well as top of wave (B) ended at 1.7192 (2014), hence the selloff from there is an impulsive wave (C) with wave I : 1.4566, wave II 1.5930, an extended wave III is unfolding and already exceeded our downside target at 1.3500 and 1.3000, hence weakness to 1.2500 and possibly 1.2000 cannot be ruled out, however, price should stay well above psychological level at 1.0000.
Daily Technical Analysis: Major US Dollar Pairs Indicate Bull Flag Chart Patterns
Currency pair EUR/USD
The EUR/USD is moving sideways and respecting the 61.8% Fibonacci resistance level of wave 2 (green). A bullish break could see price build an extension towards the 78.6% Fibonacci level.
The EUR/USD bounced at the 50% Fibonacci support level and most likely in a wave 4 (pink) correction. A break above the resistance (red) could price continue with a wave 5 (pink) where a break below support (blue) could indicate a larger bearish retracement.
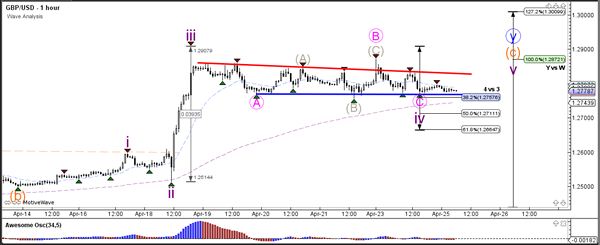
Currency pair GBP/USD
The GBP/USD continues to build a bull flag chart pattern (red/blue lines). A break above it could see price challenge the next Fibonacci level.
The GBP/USD retracement still stays above the 38.2% Fibonacci retracement level at 1.2750. A break below the 61.8% Fibonacci level invalidates wave 4 (purple) where a break above the bull flag (red) could see a wave 5 (purple) develop.
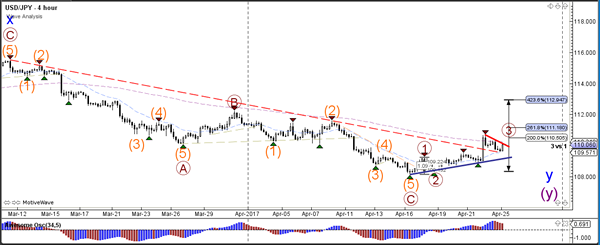
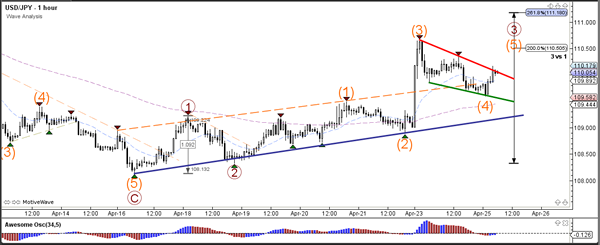
Currency pair USD/JPY
The USD/JPY bullish breakout could see a continued bullish extension within wave 3 (brown).
The USD/JPY is building a bull flag chart pattern (red/green lines). A breakout above resistance (red) could see price complete a wave 5 (orange).
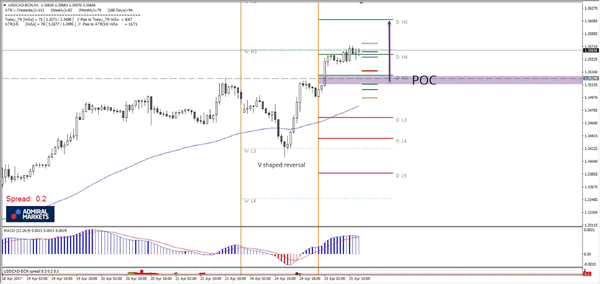
Daily Technical Analysis: USD/CAD V Shaped Reversal Marks Uptrend Continuation
The USD/CAD has spiked from Weekly L3 support straight to D H4 breakout target leaving a V shaped reversal pattern behind it. If retracement happens watch for 1.3520-35 POC ( D H3, V shaped reversal top/order block, ATR Pivot) and rejection from the zone. If we don’t see any retracement, then a direct spike from D H4/ W H3 could be possible – 1.3559 towards 1.3610. Have in mind that ATR has already been completed and that an overshot of ATR range could bring the pair up to 1.3610 – D H5. This is the indication of strong uptrend.
DAX Hits Record High On French Election Outcome
The DAX has inched upwards in the Tuesday session, as the index is currently trading at 12,445. The DAX climbed 1.2 percent on Monday, and has set a record high of 12,480 on Tuesday. It's a quiet day on the release front, with no German or Eurozone indicators on the schedule.
European stock markets jumped on Monday, buoyed by the results from the first round of the first round of the French presidential election. The markets breathed a collective sigh of relief, as opinion polls accurately forecast the outcome. The field of 11 candidates in the first round was pared to just 2 candidates, centrist Emmanuel Macron and far-right Marie Le Pen. Macron garnered 24% of the vote and Le Pen 22%. The runoff vote takes place on May 7 and French voters couldn't have a clearer choice as they head back to the polls on Sunday. Macron, who served as a minister under Socialist Francois Hollande, favors deregulation and is a staunch supporter of the European Union. Le Pen, who heads the National Front, has campaigned on a 'France first' platform, vowing to curb immigration and take France out of the eurozone. Hollande and Francois Fillon, who ran in the first round, have thrown their support behind Macron and asked voters to reject 'extremism'. Macron is a heavy favorite to win the second round and become president, with polls giving him a comfortable lead of above 60%.Since opinion polls were accurate ahead of the first round of voting, the markets appear to relying on the current polls as well, meaning that a Macron victory has been priced in. Unless this sentiment drastically changes during the week, the election will be a non-event for the market. At the same time, nothing is a sure thing in politics, as underscored by the Brexit vote and the election of Donald Trump, two events which stunned the markets and triggered strong market movement.
President Trump will have to reach out to the Democrats in order to avoid a shutdown of the federal government on Saturday. Congress must pass a spending bill which will fund the government until October, but the bill requires the backing of 60 senators. This means that the Republicans (who control 52 seats) will need the support of 8 Democrats. This has led to bipartisan negotiations, and it's reasonable to expect that these talks could go down to the wire, as both sides try to stick to their positions and try not to blink first. The last shutdown was in 2013, lasting 17 days. Another shutdown would be embarrassing for Trump, as it would start on his 100th day in office and would cast doubts on his ability to push his budget and tax plan through Congress.
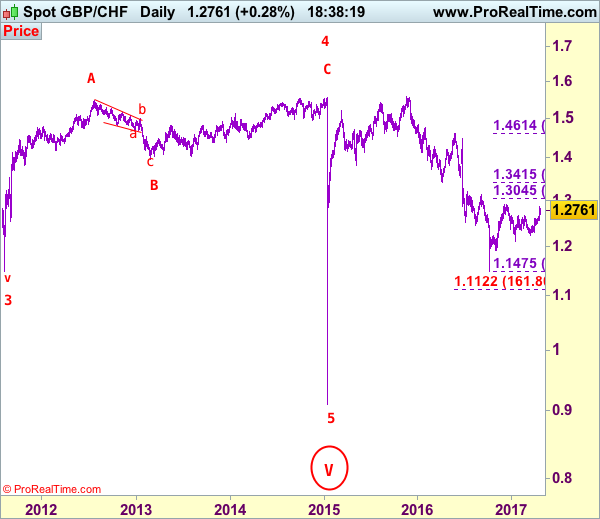
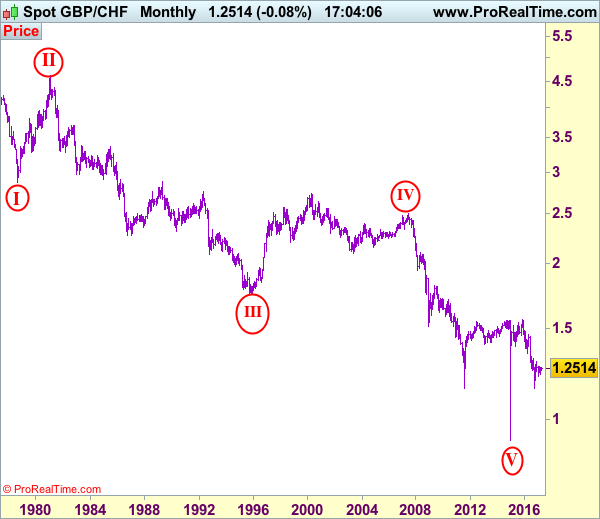
GBP/CHF Elliott Wave Analysis
GBP/CHF – 1.2760
GBP/CHF – Circle wave v ended at 0.9106 and major correction has commenced for subsequent gain to 1.5547.
Sterling found renewed buying interest at 1.2443 earlier this month and has rallied last week, the breach of indicated previous resistance at 1.2660 adds credence to our bullish view that the rebound from 1.2102 is still in progress and may extend further gain to previous resistance at 1.2915. Once this level is penetrated, this would confirm another leg of corrective upmove from 1.1475 low is underway, then further gain to 1.3000, then 1.3045-50 (50% Fibonacci retracement of 1.4614-1.1475) would follow but reckon previous chart resistance at 1.3122 would hold from here.
To recap the larger degree count, the selloff from 2.4965 (July 2007) is the beginning of wave V with circle and is labeled as 1: 2.3760, 2: 2.4425, wave 3 extension ended at 1.1470, followed by wave 4 at 1.5547, the quick rebound from 0.9106 suggests wave 5 as well as entire circle wave V could have ended there, hence consolidation with mild upside bias is seen for major correction to take place, bring initial test of 1.5547 (previous 4th of a lesser degree).
On the downside, whilst initial pullback to 1.2690-00 cannot be ruled out, reckon previous resistance at 1.2660 would limit downside and bring another rise later. Below 1.2595-00 (another previous resistance) would defer and risk correction to 1.2552 support but only a daily close below this level would abort and signal top is formed instead, risk further fall to 1.2500 and possibly towards 1.2460-65 but said support at 1.2443 should remain intact.
Recommendation: Buy at 1.2650 for 1.2850 with stop below 1.2550.
On the Monthly chart, the longer-term count is that major downtrend is under way with circle wave I at 2.8645 (Sep 1.978), then wave II with circle at 4.6175 (Feb 1981), the wave III with circle ended at 1.7425 (Nov 1995) and followed by wave IV with circle at 2.4965 (July 2007 with a short wave C) and wave V with circle has possibly ended at 0.9106. A monthly close above 1.5547 would add credence to this view, bring major correction to 1.7000, then towards psychological level at 2.0000.
Market Update – European Session: Earnings Season Moves Into High Gear
Notes/Observations
Protectionism moving from theme to reality
Effects from French elections begin to subside for the time being
Overnight:
Asia:
BOJ Dep Gov Iwata: Doing internal simulations of exit from QE; Too early to discuss exit externally
South Korea Nuclear Envoy Chief: Discussed with US, Japan counterparts ways to gain cooperation from China and Russia on North Korea
Europe:
Marine Le Pen steps down as president of National Front Party to be 'above' party considerations ahead of France presidential second-round vote. Move seen to widen her appeal ahead of next month's presidential election run-off and reach out to potential voters who backed the Eurosceptic and protectionist far-Left candidate
EU reportedly updates draft Brexit guidelines to include citizens' residence rights
Britain will have to settle €2.0B charge from the European Union over customs fraud before it can agree a Brexit trade deal
Italy govt raising taxes on tobacco and gambling and cracking down on evasion of value added tax to help it reduce this year's budget deficit as demanded by EU
Americas:
President Trump has called on the UN Security Council to be prepared to impose additional sanctions against North Korea’s nuclear and ballistic missile programs
Trump tax plan reportedly to include corporate tax rate cut to 15% andto prioritize tax cuts over deficit reduction
US Commerce Dept finds Canada softwood lumber exporters get subsidies; 20% tariff to be applied retroactively
Energy:
Norway Petroleum Directorate (NPD) Mar Oil Production: 1.73M bpd
Economic Data
(NO) Norway Q1 House Price Index Q/Q: 1.9% v 2.7% prior
(FR) France Apr Business Confidence: 104 v 104e; Manufacturing Confidence: 108 v 105e, Production Outlook Indicator: 1 v 3e, Own-Company Production: 14 v 13e
(FR) France Apr Business Survey Overall Demand: 14 v 12 prior
(ES) Spain Mar PPI M/M: -0.8% v -1.2% prior; Y/Y: 6.0% v 7.4% prior
(DK) Denmark Mar Retail Sales M/M: 0.3% v 0.2%e; Y/Y: +2.6% v -3.4% prior
(SE) Sweden Mar Unemployment Rate: 6.8% v 7.3%e, Unemployment Rate (Seasonally Adjusted): 6.4% v 6.8%e
(UK) Mar Public Finances (PSNCR): £34.3B v £12.9B prior; Public Sector Net Borrowing: £4.4 v £1.5Be v £1.1B prior, Central Government NCR: +£18.3B v -£3.7B prior, PSNB ex Banking Groups: £5.1 v £3.1Be
(HK) Hong Kong Mar Trade Balance (HKD): -42.3B v -55.5Be, Exports Y/Y: 16.9% v 10.4%e, Imports Y/Y: 13.0% v 12.5%e
Fixed Income Issuance:
(ID) Indonesia sold total IDR17T vs. IDR15T target in 5-year, 10-year, 20-year and 30-year Bonds
(EU) EFSF opened book to sell combined €8.0B in 2027 and 2043 bonds via syndicate
(NL) Netherlands Debt Agency (DSTA) sold €2.1B vs. €2.0-3.0B indicated range in 0.75% 2027 DSL Bonds; Avg Yield: 0.570% v 0.707% prior
SPEAKERS/FIXED INCOME/FX/COMMODITIES/ERRATUM
Index snapshot (as of 10:00 GMT)
Indices [Stoxx50 +0.2% at 3,581, FTSE +0.2% at 7,282, DAX flat at 12,457, CAC-40 +0.2% at 5,277, IBEX-35 -0.3% at 10,734, FTSE MIB +0.2% at 20,728, SMI +0.5% at 8,753, S&P 500 Futures +0.1%]
Market Focal Points/Key Themes: European equity indices are trading mixed across the board after a raft of corporate earnings pre-market, and as market participants further digest Sunday’s first-round French election results; shares of LVMH leading the gains in the Eurostoxx after announcing it is to acquire Christian Dior’s Couture unit for €6.5B in cash and shares; Banking stocks trading generally lower in the index with shares of Deutsche Bank, BBVA, and Santander leading the sector losses; Healthcare stocks leading the gains in the FTSE 100 with shares of Hikma Pharmaceuticals and Shire leading the gains in the index, shares of AstraZeneca and Shire also trading notably higher; Energy stocks also trading higher as oil prices trade higher intraday; commodity and mining stocks trading lower in the index despite copper prices trading sharply higher intraday; shares of Whitbread the notable laggard after releasing better than expected FY16 results but providing some negative outlook relative to cost headwinds.
A plethora of upcoming scheduled US earnings (pre-market) include Avangrid, AK Steel, AutoNation, Astec Industries, Allegheny Technologies, Anixter International, Baker Hughes, Biogen, BankUnited, Caterpillar, CIT Group, Centene Corp, E.I. Du Pont, Brinker International, Freeport McMoran, Fifth Third, FNB, Gannett, Corning, Graphic Packaging, Hubbell, JetBlue Airways, Coca-Cola, Laboratory Corp of America, Eli Lilly, Lockheed Martin, Masco, McDonald’s, McDermott International, 3M, Nielsen Company, Northern Trust, Paccar, PulteGroup, Polaris Industries, Pentair, Ryder System, Rite Aid, Stepan, S&P Global, Sensata Technologies, Supervalu, T. Rowe Price, TransUnion, Tupperware Corp, Valero Energy, Wabtec, Waters Corp, Watsco, and Xerox.
Equities (as of 09:50 GMT)
Consumer Discretionary: [Christian Dior CDI.FR +11.7% (LVMH to acquire Couture unit), Continental CON.DE -2.4% (to invest €300M in Powertrain division), Carpetright CPR.UK -7.4% (12-week sales), Essilor International EI.FR +0.7% (Q1 sales), Plastic Omnium POM.FR +3.6% (Q1 sales), Puma PUM.DE +2.8% (Q1 results), Whitbread WTB.UK -7.5% (FY16 results, div increase)]
Financials: [Intrum Justitia IJ.SE -0.7% (Q4 results), Randstad RAND.NL -0.6% (Q1 results), Swedbank SWEDA.SE -1.4% (Q1 results)]
Healthcare: [Novartis NOVN.CH +2.2% (Q1 results)]
Industrials: [Metso MEO1V.FI +5.2% (Q1 results), Schindler Holding SCHP.CH -1.0% (Q1 results), UPM UPM1V.FI +4.6% (Q1 results), Volvo VOLVA.SE +7.4% (Q1 results)]
Materials: [Covestro 1COV.DE -2.1% (Q1 results), Lonza LONN.CH +3.6% (Q1 trading update)]
Telecom: [Ericsson ERICB.SE -2.3% (Q1 results)]
Speakers
ECB's Nowotny (Austria): Brexit fears have been under-estimated; many negative surprise could come up. Did not expect the 2-year Brexit negotiation timeframe to be extended
ECB Bank Lending Survey: Net standards for home loans unchanged in 2Q. Banks expected a slight net tightening of standards for company loans in 2Q. Negative deposit rate had a positive impact on lending
EU's Dombrovskis reiterated view that region's economy was recovering but uncertainties remain
IMF's Obstfeld reiterates IMF view that its too early for ECB to exit its stimulus program
Russia Energy Min Novak: Russia will wait until May to decide on production cuts extension
Currencies
Euro paused after rally but remained within striking distance of ist 5-month highs that were achieved following the results of the French 1st round Presidential election. Euro has benefited from growing confidence that the market-friendly Macron would beat Le Pen to become the next French president.Dealers noted that Euro Zone money markets saw a chance of ECB rate hike in 2018 in the aftermath of the French 1st round of the Presidential vote. Analysts noted that ECB Draghi could help German Chancellor Merkel in the upcoming Sept elections by signaling that he intends to wind back some of the ECB's major stimulus policies. ECB unlikely to send strong new signals on monetary policy at its Thursday meeting ahead of the second round of the French presidential election.
CAD currency (Loonie) stumbled to hit 4-month lows after the US announced new duties on Canadian lumber. USD/CAD was above the 1.3570 level. Trump administration was taking retaliatory action against Canada over a decades-old trade dispute, moving to impose a 20% tariff on softwood lumber that is typically used to build single-family homes
Fixed Income
Bund futures trade at 161.17 down 18 ticks maintaining downward momentum following yesterdays sharp falls as supply pressures weigh. Continued downside targets yesterday low at 160.93 then 160.72 followed by 160.15. Resistance moves to 161.63 followed by 162.02 then 162.52 gap fill.
Gilt futures trade at 128.01 down 37 ticks approaching support at 127.95, with follow through targeting yesterday low at 127.76. A reversal eyes 128.81 followed by 129.14. Short Sterling futures trade flat to down 2bp with Jun17Jun18 trading at 12.5/13bp.
Tuesday's liquidity report showed Monday's excess liquidity rose to €1.576T a rise of €15B from €1.561T prior. Use of the marginal lending facility fell to €207M from €218M prior.
Corporate issuance saw $2.6B come to market via 3 issues headlined by US Bancorp $1.3B 10 year note and TD Amertrade $800M 10 year senior notes. This puts monthly issuance at $58.8B.
Looking Ahead
05.30 (UK) Weekly John Lewis LFL sales data
05:30 (EU) ECB allotment in 7-Day Main Refinancing Tender (prior €14.8B with 38 bids recd)
05:30 (HU) Hungary Debt Agency (AKK) to sell 3-month Bills
05:30 (PL) Poland to sell Bonds
05:30 (DE) Germany to sell €4.0B in 2019 Schatz
06:00 (TR) Turkey to sell 11% 2022 Bonds
06:45 (US) Daily Libor Fixing
07:00 (DE) German Chancellor Merkel at G20 Womens’ Summit
07:45 (US) Weekly Goldman Economist Chain Store Sales
08:00 (HU) Hungary Central Bank (NBH) Interest Rate Decision: Expected to leave Base Rate unchanged at 0.90%
08:15 (UK) Baltic Dry Bulk Index
08:55 (US) Weekly Redbook Sales
09:00 (US) Feb FHFA House Price Index M/M: 0.4%e v 0.0% prior
09:00 (US) Feb S&P / Case-Shiller 20-City M/M: 0.73%e v 0.86% prior; Y/Y: 5.77%e v 5.73% prior; House Price Index (HPI): No est v 192.81 prior
09:00 (US) Feb S&P / Case-Shiller (overall) HPI Y/Y: No est v 5.87% prior, House Price Index (HPI): No est v 185.51 prior
09:00 (BE) Belgium Apr Business Confidence: No est v -1.6 prior
09:00 (EU) Weekly ECB Forex Reserves
09:00 (HU) Hungary Central Bank Gov Matolcsy post rate decision statement
09:00 (RU) Russia weekly OFZ bond auction announcement
09:30 (BR) Brazil Mar Current Account: +$0.5Be v -$0.9B prior; Foreign Direct Investment (FDI): $7.0Be v $5.3B prior
10:00 (US) Mar New Home Sales: 584Ke v 592K prior
10:00 (US) Apr Consumer Confidence: 122.5e v 125.6 prior
10:00 (US) Apr Richmond Fed Manufacturing Index: 16e v 22 prior
11:30 (US) Treasury to sell 4-week and 52-week Bills
11:30 (NO) Norway Central Bank ( Norges) Dep Gov Nicolaisen speaks in Oslo
12:30 (DE) German Chancellor Merkel with China Foreign Min Yang Jiechi
13:00 (US) Treasury to sell 2-Year Notes
15:00 (AR) Argentina Mar Trade Balance: -$0.4Be v -$0.1B prior
15:00 (AR) Argentina Feb Economic Activity Index (Monthly GDP) M/M: No est v -0.5% prior; Y/Y: 0.0%e v +1.1% prior
16:30 (US) Weekly API Oil Inventories
Trade Idea: EUR/JPY – Stand aside
EUR/JPY - 120.07
Recent wave: wave v of (C) ended at 94.12 and major correction in wave A has ended at 149.79
Trend: Near term down
New strategy :
Stand aside
Position: -
Target: -
Stop:-
Despite yesterday’s rally to 120.88, the subsequent retreat suggests consolidation would be seen and pullback to 119.50-60 cannot be ruled out, however, reckon downside would be limited to 118.92 support and bring another rebound later. Only break of said resistance at 120.88 would signal the rise from 114.85 low has resumed and extend further gain to 121.00, then towards 121.80-85 but resistance at 122.26 should remain intact.
In view of this, would not chase this rise here and would be prudent to stand aside in the meantime. Below 118.92 support would defer and suggest a temporary top is formed, bring weakness to 118.50, however, downside should be limited to 118.00-10 and previous resistance at 117.82 (now support) should hold and bring another rise later.
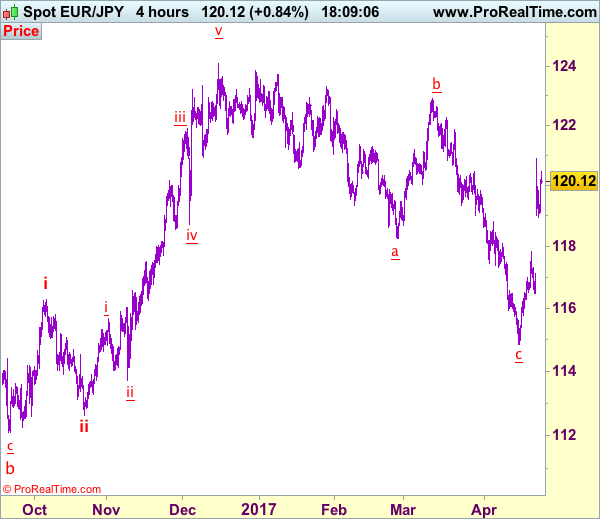
Our latest preferred count is that wave (ii) is ABC-X-ABC which ended at 123.33 and wave (iii) is unfolding with wave iii ended at 100.77, followed by wave iv at 111.57 and wave v as well as the wave (iii) has ended at 97.04, followed by wave (iv) at 111.43 and wave (v) has ended at 94.12 which is also the end of the larger degree v, this also implied the major wave (C) has also ended there, hence major correction has commenced from there with (A) leg unfolding in its lower degree wave c which has possibly ended at 145.69. Under this count, A-B-C wave (B) has commenced with A leg ended at 136.23, wave B at 143.79 and wave C has possibly ended at 149.79.
Our larger degree count is that the decline from 139.26 is wave (C) and is sub-divided into a diagonal triangle i-ii-iii-iv-v with wave i - 105.44, wave ii- 123.33, wave iii - 97.03, wave iv - 111.43, followed by the final wave v as well as the end of wave (C) at 94.12, this also mark the bottom of larger degree wave B. Under this count, major rise in wave C has commenced as an impulsive wave with minor wave III ended at 145.69, wave V is still in progress for further gain to 150.00. Having said that, this so-called wave V could well be the first leg of larger degree 5-waver wave C and this wave C should bring at least a retest of wave A top at 169.97 (July 2008).
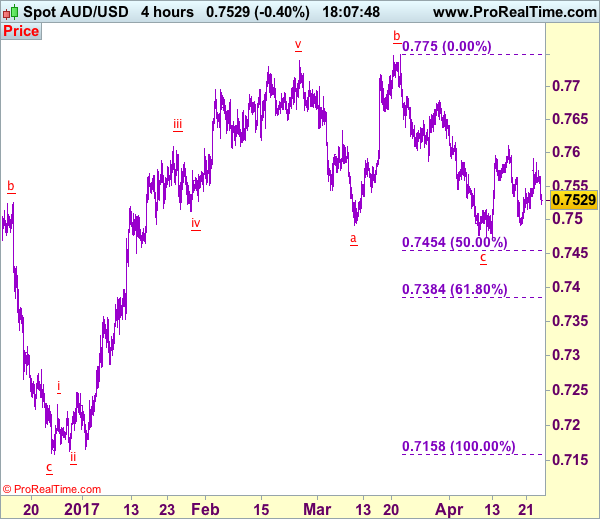
Trade Idea: AUD/USD – Stand aside
AUD/USD – 0.7534
Recent wave: Wave 5 ended at 1.1081 and major correction has commenced for fall to 0.7000 and then towards 0.6500-10
Trend: Near term down
New strategy :
Stand aside
Position: -
Target: -
Stop:-
Despite yesterday’s initial strong rebound to 0.7592, the subsequent retreat has retained our view that further consolidation would take place and weakness towards 0.7491 cannot be ruled out, however, break of support at 0.7473 is needed to signal recent decline from 0.7750 has resumed and extend weakness to 0.7450-55 (50% Fibonacci retracement of 0.7158-0.7750) but reckon downside would be limited to 0.7380-85 (61.8% Fibonacci retracement), risk from there is seen for a rebound later.
On the upside, expect recovery to be limited to 0.7565-70 and said resistance at 0.7592 should hold. Only break of said resistance at 0.7611 would signal low has been formed at 0.7473, bring a stronger rebound to 0.7650 but resistance at 0.7680 should hold from here, price should falter below 0.7700-10, bring another decline later. As near term outlook is still mixed, would be prudent to stand aside in the meantime.
On the 4-hour chart, the move from 0.8066 is the wave 5 with i: 0.8860, ii: 0.8315, wave iii is an extended move ended at 1.0183, iv: 0.9706 and wave v has ended at 1.1081 (also the top of entire wave 5). The subsequent selloff is the major correction which is unfolding as ABC-X-ABC and 2nd A leg has ended at 0.8848, followed by a-b-c wave B which ended at 0.9758, hence, 2nd C wave is now in progress and indicated downside target at 0.7000 and 0.6950 had been met, so further fall to 0.6710-20 cannot be ruled out.
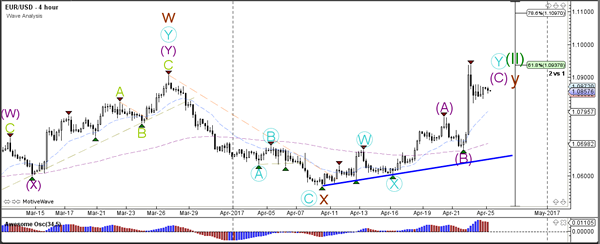
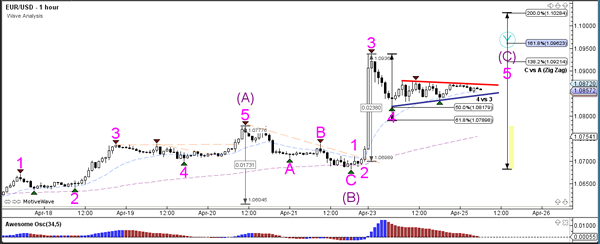
EUR/USD Edges Up, Markets Eye ECB Policy Meeting
The euro has edged higher in the Tuesday session, as the pair trades at the 1.09 line. On the release front, it's another quiet day in the Eurozone, with no major events. In the US, we'll get a look at two key events. CB Consumer Confidence is expected to improve to 123.7, while New Home Sales is forecast to edge lower to 590 thousand.
The markets breathed a collective sigh of relief late Sunday, as opinion polls accurately forecast the outcome of the French presidential election. The field of 11 candidates in the first round was pared to just 2 candidates. The winners? Centrist Emmanuel Macron and far-right Marie Le Pen. Macron garnered 24% of the vote and Le Pen 22%. The runoff vote takes place on May 7 and French voters couldn't have a clearer choice as they head back to the polls on Sunday. Macron served as a minister under President Francois Hollande. He favors deregulation and is a staunch support of the European Union. Le Pen, who heads the National Front, has campaigned on a 'France first' platform, vowing to curb immigration and take France out of the eurozone. Hollande and Francois Fillon, who ran in the first round, have thrown their support behind Macron and asked voters to reject 'extremism'. Macron is a heavy favorite to win the second round and become president, with polls giving him a comfortable lead of above 60%.Since opinion polls were accurate ahead of the first round of voting, the markets appear to relying on the current polls as well, meaning that a Macron victory has been priced in. Unless this sentiment drastically changes during the week, the election will be a non-event for the market. At the same time, nothing is a sure thing in politics, as underscored by the Brexit vote and the election of Donald Trump, two events which stunned the markets and triggered strong market movement.
Donald Trump has plenty on his plate, but he will have to put in some overtime this week to avoid a shutdown of the federal government on Saturday. Congress must pass a spending bill which will fund the government until October, but the bill requires the backing of 60 senators. This means that the Republicans (who control 52 seats) will need the support of 8 Democrats. This has led to bipartisan negotiations, and it's reasonable to expect that these talks could go down to the wire, as both sides try to stick to their positions and try not to blink first. The last shutdown was in 2013, lasting 17 days. Another shutdown would be embarrassing for Trump, as it would start on his 100th day in office and would cast doubts on his ability to push his budget and tax plan through Congress.