Sample Category Title
EUR/USD Mid-Day Outlook
Daily Pivots: (S1) 1.0823; (P) 1.0863 (R1) 1.0906; More....
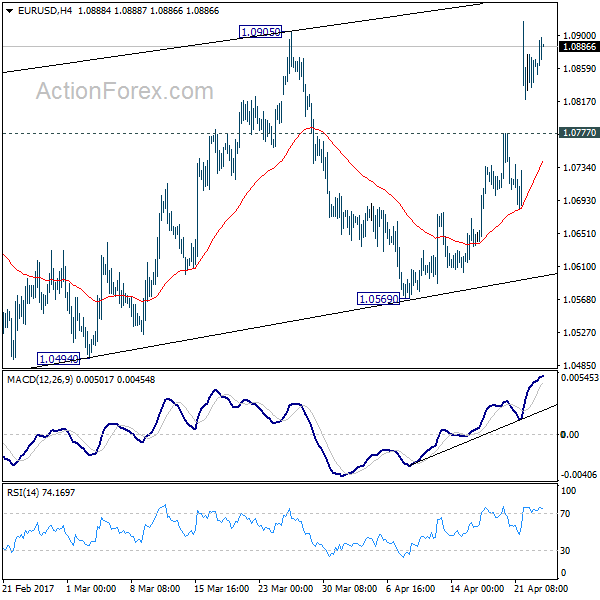
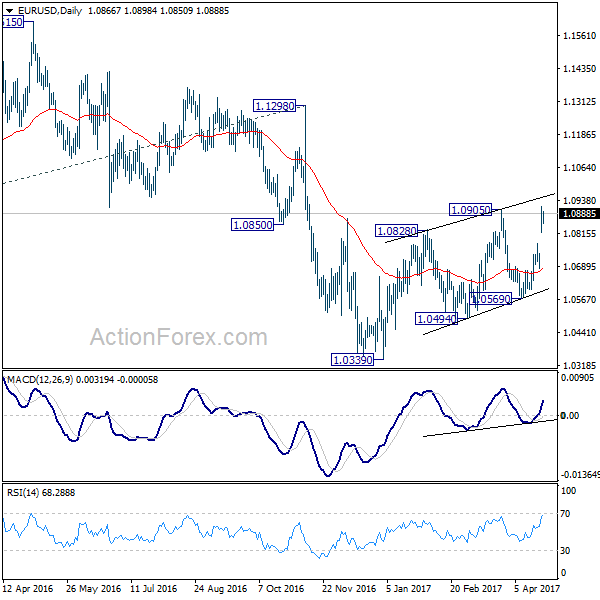
Intraday bias in EUR/USD remains on the upside with 1.0777 minor support intact. Rise form 1.0339 is in progress and would extend higher towards 1.1298 resistance. But still, such rally is seen as a corrective move. Hence, we'd pay attention to topping signal above 1.0905 and below 1.1298 key resistance. On the downside, below 1.0777 minor support will turn bias to the downside for 1.0569 support first.
In the bigger picture, as long as 1.1298 key resistance holds, whole down trend from 1.6039 (2008 high) is still expected to continue. Break of 1.0339 low will send EUR/USD through parity to 61.8% projection of 1.3993 to 1.0461 from 1.1298 at 0.9115. However, considering bullish convergence condition in weekly MACD, break of 1.1298 will indicate term reversal. this would also be supported by sustained trading above 55 week EMA.
GBP/USD Mid-Day Outlook
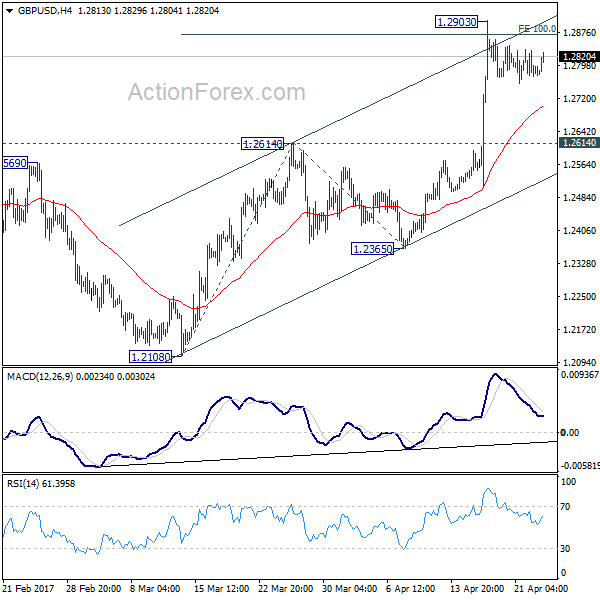
Daily Pivots: (S1) 1.2763; (P) 1.2800; (R1) 1.2828; More...
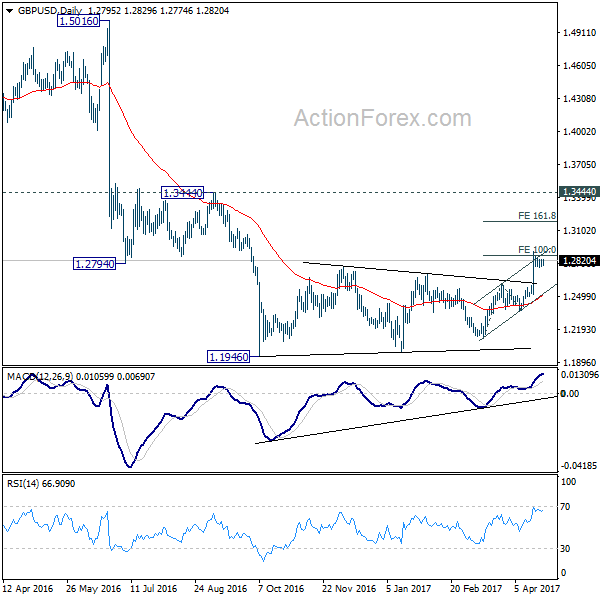
Intraday bias in GBP/USD remains neutral for consolidation below 1.2903. As long as 1.2614 resistance turned support holds, further rally is expected. Firm break of 100% projection of 1.2108 to 1.2614 from 1.2365 at 1.2871 will target 161.8% retracement at 1.3184. Still, price actions from 1.1946 are seen as a correction. Hence we'd expect strong resistance below 1.3444 to bring larger down trend resumption. On the downside, break of 1.2614 resistance turned support will turn bias back to the downside for 1.2365 support first.
In the bigger picture, fall from 1.7190 is seen as part of the down trend from 2.1161. There is no sign of medium term reversal yet. Sustained trading below 61.8% projection of 2.1161 to 1.3503 from 1.7190 at 1.2457 will target 100% projection at 0.9532. Overall, break of 1.3444 resistance is needed to confirm medium term bottoming. Otherwise, outlook will remain bearish.
USD/CHF Mid-Day Outlook
Daily Pivots: (S1) 0.9908; (P) 0.9943; (R1) 0.9993; More.....
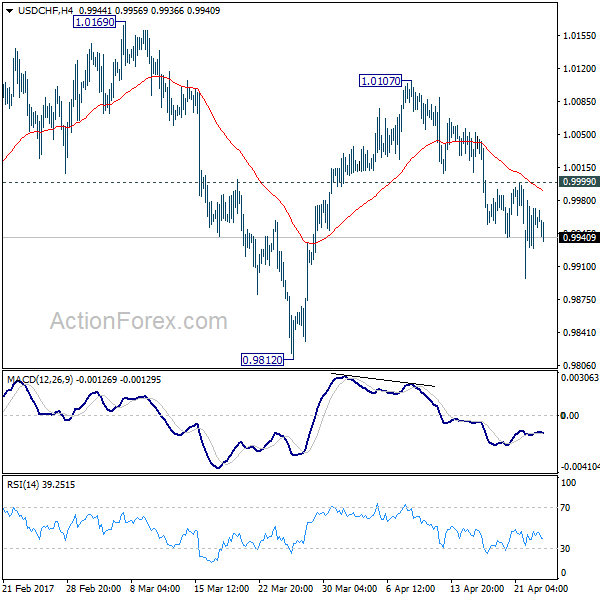
Downside momentum in USD/CHF is a bit unconvincing as seen in 4 hour MACD. But with 0.9999 minor resistance intact, deeper fall is still expected. Current decline from 1.0107 will extend to 0.9812 support and below. Fall from 1.0342 is seen as a correction. Hence, we'll look for bottoming signal below 0.9812. Meanwhile, on the upside, above 0.9999 minor resistance will turn bias back to the upside for 1.0107 resistance instead.
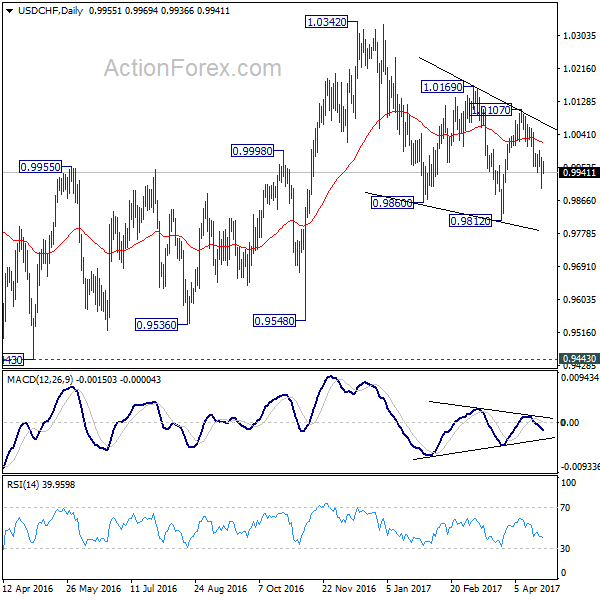
In the bigger picture, we're still maintaining that firm break of 1.0342 key resistance is needed to confirm underlying bullish momentum in the cross. However, the corrective nature of the fall from 1.0342 is starting to give the medium term outlook a bullish favor. Hence, in stead of looking for topping signal around 1.0342, we'd now pay closer attention to upside acceleration as USD/CHF approaches this level again.
USD/JPY Mid-Day Outlook
Daily Pivots: (S1) 109.42; (P) 110.00; (R1) 110.34; More....
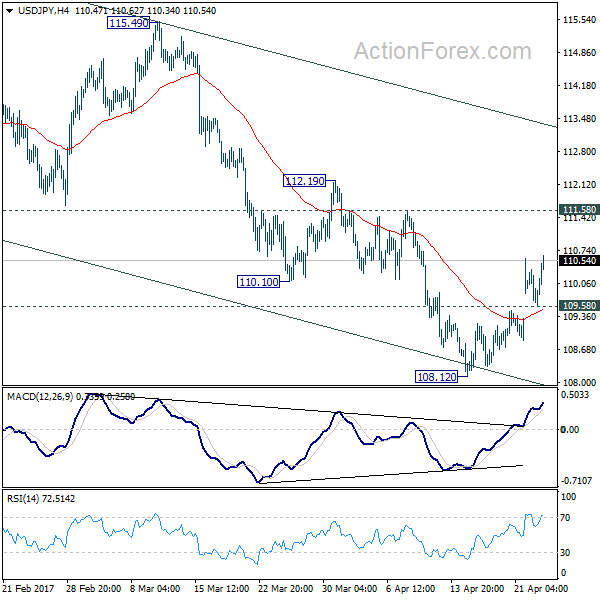
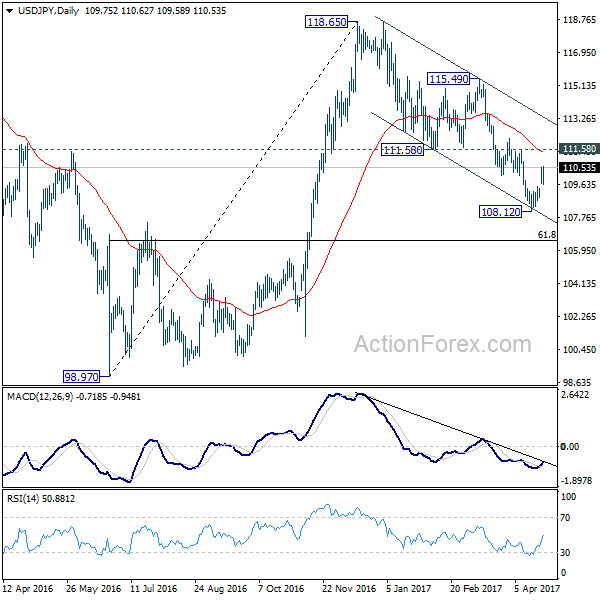
USD/JPY's rise from 108.12 resumes after brief retreat as reaches as high as 110.62 so far. Intraday bias remains on the upside for 111.58 support turned resistance. Considering bullish convergence in 4 hour MACD, sustained break of 111.58 will argue that fall from 118.65 is merely a corrective move and has completed. Outlook will then be turned bullish for 115.49 resistance and above. Meanwhile, below 109.58 minor support will turn bias to the downside and extend the whole decline from 118.65 to 61.8% retracement of 98.97 to 118.65 at 106.48.
In the bigger picture, price actions from 125.85 high are seen as a corrective pattern. Current development suggests that it's not completed yet and is extending. In case of deeper decline, downside should be contained by 61.8% retracement of 75.56 to 125.85 at 94.77 to bring rebound. Rise from 75.56 is still expected to resume later after the correction from 125.85 completes.
USDJPY: Bullish, Continues To Retain Recovery Threats
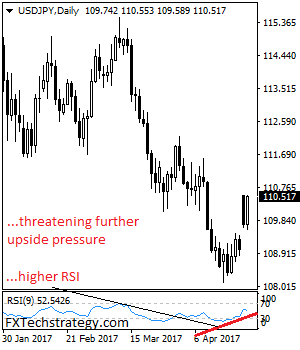
USDJPY: The pair now faces bullish risk following its gap higher on Monday. On the downside, support comes in at the 110.00 level where a break if seen will aim at the 109.50 level. A cut through here will turn focus to the 109.00 level and possibly lower towards the 108.50 level. On the upside, resistance resides at the 111.00 level. Further out, we envisage a possible move towards the 111.50 level. Further out, resistance resides at the 112.00 level with a turn above here aiming at the 112.50 level. On the whole, USDJPY looks to recover further higher.
Risk-off, Macron-on
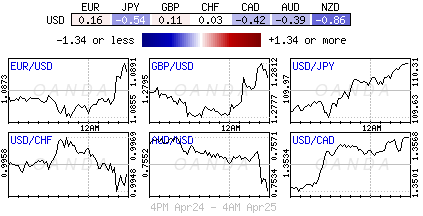
The Macron-inspired risk-on rally has bolstered investor risk sentiment, with the hunt for risk elevating world stocks to record highs during Tuesday's trading session. Asian equities marched to a near two-year high on Tuesday amid the risk-on trading mood and the bullish momentum supporting European stocks. With the perceived market-friendly Macron first-round French presidential victory somewhat dissolving risks associated with Frexit, the evident relief may support Asian, European and American markets moving forward.
Wall Street could receive another welcome boost this afternoon as some investors remain cautiously optimistic over Trump's planned big tax reform and tax reduction announcement on Wednesday. While global markets may be praised for their patience over Trump's proposed fiscal policies, a sharp correction could be on the table if the alleged phenomenal tax cuts and infrastructure spending falls well below expectations.
Euro hovering below 1.0900
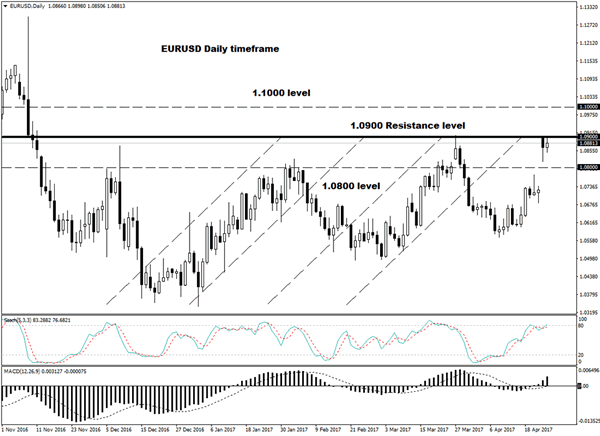
The Macron relief has inspired Euro bulls to antagonize the 1.0900 resistance during Tuesday's trading session. With the results of the first round of the French presidential elections reducing some Frexit-associated risks, the Euro found itself back in fashion. Although the EURUSD remains bullish on the daily charts, there is still a risk of prices coming under renewed selling pressure, as anxiety heightens ahead of the second round of the French presidential elections on 7 May.
Investors may direct their attention towards the pending ECB meeting on Thursday which is expected to conclude with policy measures left unchanged. Markets may observe the recent French presidential election results triggering a change in Mario Draghi's rhetoric, with some signs of hawks potentially supporting the Euro further. From a technical standpoint, EURUSD bulls may secure their dominance as prices are able to close above 1.0900 with the next level of interest around 1.1000. In an alternative scenario, a break below 1.0800 could entice sellers to send the pair back to 1.0750.
Dollar bulls seek inspiration
The Greenback lost its attitude during early trading on Tuesday and could find itself under renewed selling pressure if Trump's big tax reform and tax reduction announcement on Wednesday fails to provide investors with any additional clarity. The sheer lack of detail that markets have been offered over the proposed fiscal plans have challenged the Trump rally, as the growing threat of fiscal spending failing to meet the market expectations exposes the Dollar to further losses.
From a technical standpoint, weakness below 99.00 on the Dollar Index could open a path towards 98.80 and 98.50 respectively. In an alternative scenario, a decisive breakout above 99.50 could open the path back towards the 100.00 psychological level.
Commodity spotlight – WTI Oil
Oil markets may be destined for further punishment as the persistent oversupply woes inhibit investor attraction towards the commodity. Although OPEC has maintained their optimism over the supply cuts stabilizing the saturated oil markets, the big elephant in the room, known as US Shale, continues to obstruct the cartel's valiant efforts to trim the global glut. With sentiment towards oil bearish amid the oversupply concerns, a further downside may be expected with bears eyeing $48. From a technical standpoint, previous support around $50 could transform into a dynamic resistance that encourages a decline towards $49 and $48 respectively.
Trade Idea: GBP/USD – Buy at 1.2710
GBP/USD – 1.2826
Recent wave: Wave V of larger degree wave (III) has ended at 1.1986 and major correction has commenced from there for gain to 1.3000 and 1.3140-50
Trend: Near term up
Original strategy :
Buy at 1.2710, Target: 1.2910, Stop: 1.2650
Position: -
Target: -
Stop: -
New strategy :
Buy at 1.2710, Target: 1.2910, Stop: 1.2650
Position: -
Target: -
Stop:-
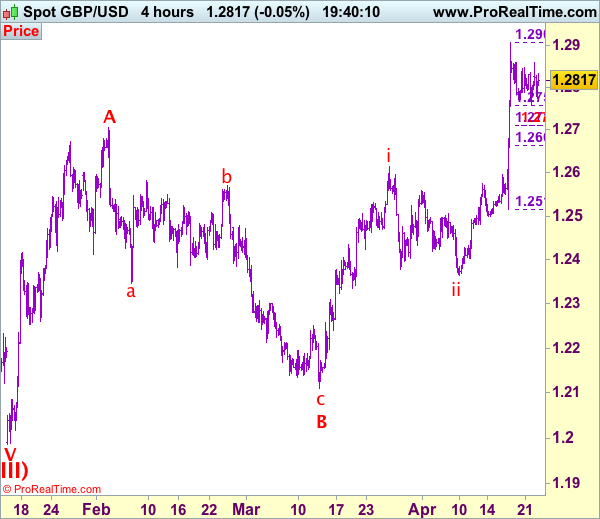
Although cable has rebounded again and test of indicated minor resistance at 1.2859 is likely, break there is needed to the pullback from 1.2906 has ended instead, bring further gain to 1.2870, then retest of 1.2906. If said resistance continues to hold, then further consolidation would take place and risk of another corrective fall to 1.2757 (38.2% Fibonacci retracement of 1.2515-1.2906) remains, however, reckon 1.2710 (50% Fibonacci retracement as well as 100% projection of a leg from1.2906) would limit downside and bring another rise later. We are keeping our view that the wave c as well as larger degree wave B has ended at 1.2109, hence impulsive wave C has commenced from there with wave i of C ended at 1.2616, follow by a correction to 1.2365 (end of wave ii) and wave iii rally is unfolding, hence further gain to 1.2940-50 and possibly psychological resistance at 1.3000 would be seen, however, near term overbought condition should limit upside to 1.3050-60.
Our preferred count on the daily chart is that cable's rebound from 1.3500 (wave (A) trough) is unfolding as a wave (B) with A ended at 1.7043, followed by triangle wave B and wave C as well as wave (B) has ended at 1.7192, the subsequent selloff is the larger degree wave (C) which is still unfolding with minor wave (III) of larger degree wave 3 ended at 1.1986, hence wave (IV) correction is in progress which could either be a triangle wave (IV) of a complex formation but upside should be limited to 1.3500 and price should falter well below 1.4000, bring another decline in wave (V) of 3 for weakness to 1.1500, then 1.1200.
On the downside, whilst initial pullback to 1.2750-55 is likely, reckon downside would be limited and 1.2700-10 (50% Fibonacci retracement of 1.2515-1.2906) should contain weakness and bring another rally later. Below 1.2690-00 would defer and risk correction to 1.2660-65 but another previous resistance at 1.2616 (wave i top) should remain intact.
CBR Rate Decision Preview: Cutting Further
- We expect the CBR to cut the key rate by 25bp to 9.50% on 28 April, as inflation approaches its target and inflation expectations fall further.
- Yet, we do not exclude a 50bp cut, as the RUB's enduring strengthening on high carry becomes a headache for Russia's economic authorities.
- We expect the CBR to continue cautious monetary easing, hitting 8.50% by end-2017.
Assessment and outlook
This Friday (28 April) at 12:30 CET, Russia's central bank (the CBR) is due to announce its monetary policy decision. We expect the CBR to cut the key rate by 25bp to 9.50%, as does consensus, although we do not exclude a 50bp cut to restrain the RUB's excessive strengthening. CBR governor Elvira Nabiullina signalled last week that rate cuts of 25 and 50 basis points may be discussed at the meeting as inflation hit 4.1% y/y as of 17 April. In March 2017, the decline in inflation expectations resumed and the real rate remained elevated.
Russia's Ministry of Finance's (Minfin) FX purchases do not seem to be restraining the RUB's excessive strengthening, or bothering the CBR with the risk of a sudden increase in inflation expectations. As Minfin estimates oil and gas revenues have deviated from the budget assumption by RUB65bn in April (RUB92bn in March 2017), it is currently buying daily FX of RUB3.5bn (approximately USD61m per day) versus RUB3.2bn in March 2017. Thus, in total, Minfin plans to buy FX for RUB70bn between 7 April and 5 May. This is not currently having a significant impact on the markets. Thus, a more dovish than expected CBR could help to put the brakes on the RUB.
We continue to expect the CBR to deliver 25bp in cuts at the meetings in 2017, as the crude oil price is set to increase moderately, lowering inflation expectations and balancing the oil price in RUB. We continue to expect the real rate to stay over 3.0% in 2017, attracting carry traders and oiling current long positions in RUB. We expect the key rate to be cut to 8.50% by end-2017.
We do not expect a strong reaction in RUB after the meeting if the CBR does not deliver any surprise and its consistency holds. If the CBR cuts more than 25bp, the RUB's weakening would be temporary, as lower rates in Russia have traditionally attracted flows through expectations of better economic prospects spurring demand for both local stocks and debt.
Trade Idea: GBP/JPY – Stand aside
GBP/JPY - 141.50
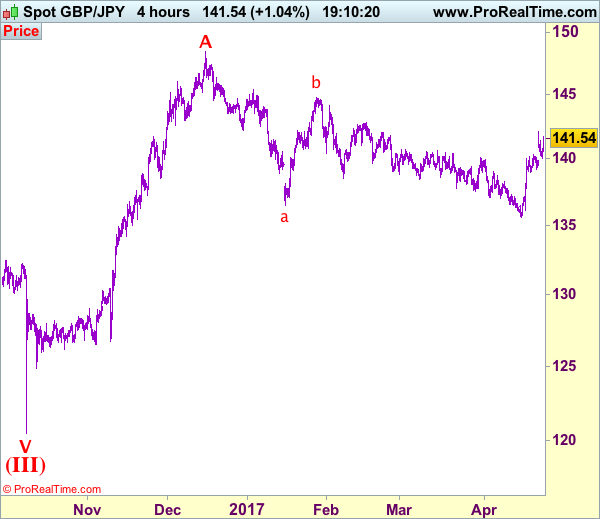
Recent wave: Medium term low formed at 120.50 and (A)-(B)-(C) major correction has commenced with (A) leg ended at 148.45, hence wave (B) is unfolding for retreat to 131.00-10.
Trend: Near term up
New strategy :
Stand aside
Position: -
Target: -
Stop:-
Although sterling has rebounded again after finding support at 140.10 and near term upside risk remains for gain to 142.00, break of resistance at 142.10 is needed to confirm recent upmove from 135.60 low has resumed and extend further gain to 142.50, then towards 142.90-00 which is likely to hold from here due to near term overbought condition.
In view of this, would not chase this rise here and would be prudent to stand aside for now. Below 140.80-85 would prolong consolidation and risk weakness to 140.30-40 but said support at 140.10 should contain downside. Only break there would suggest a temporary top is formed, bring correction to 139.50-60 but price should stay well above support at 139.20 (Friday’s low), bring another rise later.
Our preferred count is that larger degree wave V with circle is unfolding from 251.12 with wave (I) 219.34, (II): 241.38 and wave (III) is subdivided into 1: 192.60, 2: 215.89 (23 Jul 2008) and wave 3 ended at 118.87 earlier in 2009. The correction from there to 162.60 is wave 4 which itself is a double three and is labeled as first a-b-c ended at 151.53, followed by wave x at 139.03, 2nd a ended at 162.60, 2nd b at 146.75 and 2nd c leg of wave 4 ended at 163.00. Therefore, the decline from 163.00 to 116.85 is now treated as wave 5 which also marked the end of larger degree wave (III), hence wave (IV) major correction has commenced for retracement of the wave (III) from 241.38 and upside target at 183.95-00 (50% Fibonacci retracement of the wave (II) from 241.38) had been met, a drop below 160.00 would suggest wave (IV) has ended at 195.85, bring decline in wave (V) for initial weakness to 130 (already met) and 120.
Loonie Goes To War
Yesterday's price action across the various asset classes would suggest that the French presidential elections are no longer an issue for markets.
The EUR, French government bonds (OAT's) and European equities closed sharply higher Monday after centrist candidate Emmanuel Macron secured the top spot in the first round of French presidential elections on the weekend.
For the time being, at least until the second round vote on May 7, the markets focus turns to Trumps Tax agenda, the possibility of the U.S government shutting down, North Korea's saber rattling and a simmering U.S/Canada trade war.
Fresh dollar selling is expected to emerge for the mighty ‘buck' if tomorrow's looming tax proposal from Trump skimps on details and finally, U.S earnings season swings into high gear.
1. Asia stocks near two-year high, Europe sees green
Global equity markers appear to be still lingering in the glow of relief after the French election result. In Japan, the Nikkei rallied more than +1% to a three-week high, while the broader Topix and South Korea's Kospi each rose +1.1%.
In Taiwan, the Taiex jumped +1.3%, while the Philippines benchmark soared +1.7%.
Note: Australia and New Zealand were closed for Anzac Day.
On Monday in China, indexes posted their worst day this year amid signs Beijing will tolerate further market volatility as regulators clamp down on shadow banking and speculative trading. However, in the overnight session there was some relief, the Shanghai Composite rose +0.2% after falling -1.4% in the previous session.
In Hong Kong, the Hang Seng rallied +1.2%, while the Hang Seng China Enterprises Index jumped +1.7%, the most in a month.
In Europe, equity indices are trading mixed across the board after a raft of corporate earnings pre-market, and as market participants further digest Sunday's first-round French election results. Banking stocks are trading generally lower in the Eurostoxx, while energy stocks are trading higher as oil prices trade higher intraday in the FTSE 100.
U.S equities are set to open in the black (+0.1%).
Indices: Stoxx50 +0.2% at 3,581, FTSE +0.2% at 7,282, DAX flat at 12,457, CAC-40 +0.2% at 5,277, IBEX-35 -0.3% at 10,734, FTSE MIB +0.2% at 20,728, SMI +0.5% at 8,753, S&P 500 Futures +0.1%.
2. Oil edges up after six straight sessions of losses, gold prices stable
Oil prices recovered some ground overnight, but the market remains under pressure as traders lose confidence that pledged output cuts by OPEC and non-OPEC members would rein in oversupply.
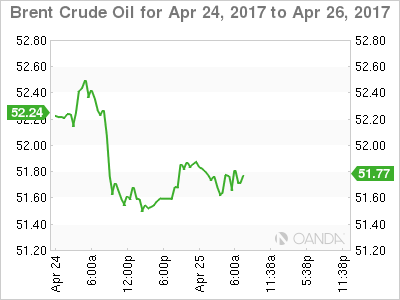
Brent crude futures rose +14c, or +0.27%, to +$51.74 a barrel, while U.S West Texas Intermediate (WTI) crude futures have added +14c, or +0.3%, but remains below the psychological $50 mark pierced late last week, at +$49.37 a barrel.
To many, OPEC and other non-OPEC producers continue to struggle to clear oversupply, given that oil supplies remain at or near record highs despite last Novembers record cuts.
The ‘bulls' believe that OPEC will be forced to renew, and possibly deepen this agreement in the coming weeks if they wish to keep prices well above $50 per barrel.
Russia said yesterday that its oil output could climb to the highest rate in three decades if OPEC and non-OPEC producers do not extend a supply reduction deal beyond June 30.
Note: On the weekend, a panel made up of OPEC and other producers has recommended an extension of output cuts by another six-months from June.
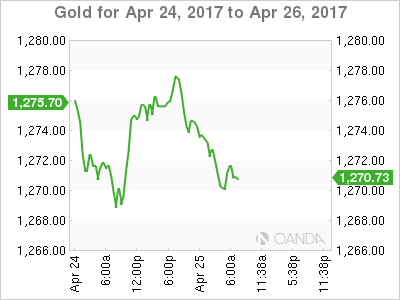
Gold prices (-0.2% at +$1,272.67 per ounce) have eased overnight as investor sentiment remains skewed towards riskier assets in the wake of the French election results. However, saber rattling from Korean is limiting the safe-haven's losses.
3. Global yields back up
A percentage of the risk premium that had been priced into the fixed income market this year has been taken off now that Macron has won the first round voting in the French presidential election and solidified his prospects of becoming the country's next leader.
U.S Treasury prices are heading for a fifth day of declines, with yields on 10-year notes climbing +1 bps to +2.29% overnight after rising +3 bps yesterday.
The yield on French 10-year notes (OAT's) dropped -1 bps +0.82%, after tumbling -11 bps Monday. German 10-year Bunds added +2 bps to +0.34%.
The spread between 10-year French OAT's and German bunds widened +2 bps to +51 bps after dropping -20 bps on the French election results.
4. Canada – Protectionism moving from theme to reality
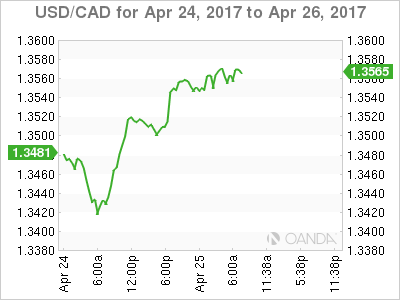
The CAD or ‘loonie' has dropped -0.4% (C$1.3551) to a new four month low as Trump intensified a decades old trade dispute with Canada, slapping tariffs of up to +24% on imported softwood lumber that is typically used to build single family homes. Canada is the U.S's second largest 'two-way' trading partner.
The EUR (€1.0892) remains within striking distance of its five-month high print (€1.0933) after the results of the French first-round Presidential election. The single unit continues to benefit from growing confidence that the market-friendly Macron would beat Le Pen to become the next French president on May 7.
Note: The Eurozone money market is pricing an ECB rate hike in 2018 in the aftermath of the French first-round. ECB's Draghi is not expected to send any strong new signals on monetary policy at its Thursday meeting ahead of the second round of the French presidential election.
Elsewhere, improved risk appetite is supporting Asian EM currency pairs. The USD is down -0.8% vs. KRW, -0.6% vs. MYR and -0.3% vs. INR.
However, the USD could bounce on Trump's looming tax plan while tensions involving North Korea could quell demand for EM currencies.
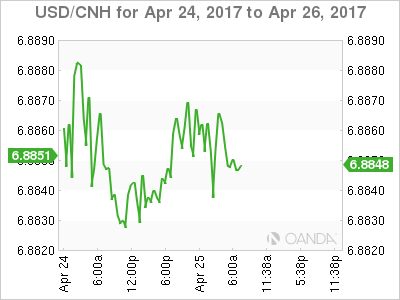
5. China unemployment rate falls below +4%
Data overnight showed that China's urban unemployment rate fell below +4% for the first time in years. This could be considered a hopeful sign that slower economic growth is not creating the massive unemployment that Beijing had feared.
The social security ministry said that +3.34m new jobs were created in Q1 and that the registered urban unemployment rate was +3.97%.
Note: China has kept employment generally stable even as economic growth has slowed to a 26-year low and the government shuts down out-dated industrial capacity.