Sample Category Title
Technical Outlook: AUDUSD- Near-Term Structure Weakens On Return Below 200SMA
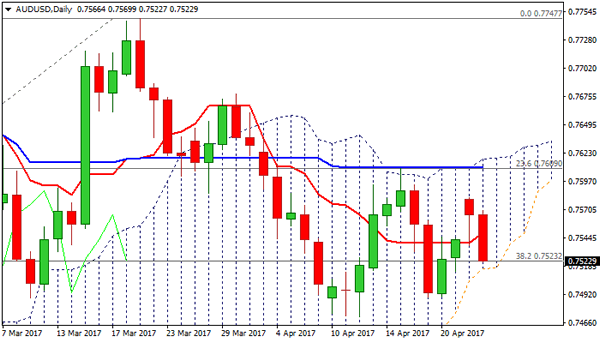
The Aussie was sharply lower on Tuesday and filled Monday's gap, after breaking back below 200SMA (0.7549).
Formation of Hanging Man yesterday generated bearish signal that resulted in bearish acceleration that so far retraced nearly 61.8% of 0.7490/0.7582 upleg.
Near-term technicals returned to bearish mode, shifting risk lower and pressuring next key supports at 0.7523/16 (100SMA / daily cloud base) loss of which is needed to confirm an end of recovery phase from 0.7490.
Upticks should be capped by 200SMA (also top of hourly cloud) and daily close below here will be seen as bearish signal to maintain downside pressure.
Res: 0.7541, 0.7549, 0.7569, 0.7582
Sup: 0.7516, 0.7490, 0.7471, 0.7453
Markets Await US Trade Tariff And Tax Cut Details
FX markets quick to target CAD and MX after Trump's action on Canadian wood
US President Donald Trump had been talking about placing tariffs on Canadian timber and dairy forever; however no announcement (if any) was expected until next week. But overnight Trump unexpectedly imposed a tariff of up to 24% on Canadian wood exports. This seems to be a response to Canada's long-standing taxes on US daily imports, which the Trump administration views as unfair.
The trade dispute escalations highlight simmering discontent regarding NAFTA and it meant the FX markets were quick to target CAD and MXN. With Trump nearing his first 100 days with little of the “winning” promised, he will be quick to score cheap points with his core political base. Renewal of protectionist sentiment will likely upset upcoming NAFTA renegotiations, keeping NAFTA FX trades under selling pressure. In addition, the focus on dairy prices will highlight NZD issues.
Markets had been lulled into a false sense of security after Trump's retreating from harsh China rhetoric and broader legislative failures. However, this policy action is a clear illustration of the ease in which he can enact punitive trade policy. CAD came under significant selling pressure as news of the action hit the wires. We remain constructive on USDCAD, which has rallied above its falling trend line for December, targeting a range high at 1.3600.
US budget deficit back under the spotlight
On Tuesday, financial markets continued to digest the result of the first round of the French election but the focus is slowly shifting towards the US as Trump announced he will unveil his “phenomenal” tax reform and put it protectionist trade policy back on the drawing board. Nevertheless the dollar index was mostly trading sideways this morning, suggesting that the market is very suspicious regarding Trump's announcement. In fact, it seems that the market is not even buying his stories anymore and would rather wait for concrete actions.
We are very suspicious that Trump's tax cut reform will pass the Congress as it will make the US deficit to balloon. In addition, the timing couldn't be worse as US budget deficit has become the new hot topic recently as the government is running out of money, meaning that a government shutdown is looming. There is little chance that the Trump administration will get the Congress to sign its tax cut reform, while at the same time getting it to sign off another spending bill. Trump is indeed in a deadlock.
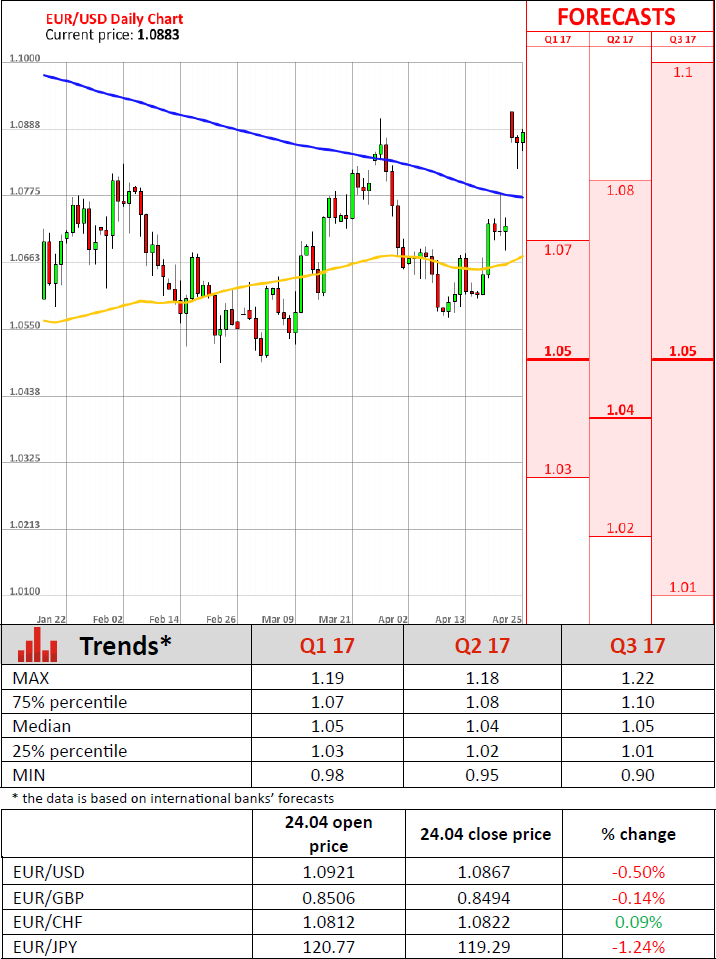
In such an environment, we should continue to see some inflow in the single currency. The shift towards riskier asset should continue, even though the market is converging towards a new port-French-first-round-election equilibrium for now. Against this backdrop, we remain dollar negative dollar, waiting for further clarity on the US outlook and more specifically US budget story. The yellow metal was down another 0.50% today, while the Japanese yen slid 0.60% with USD/JPY rising to 110.40. After breaking successfully its 200dma to the upside, EUR/USD is now testing the key resistance at 1.0865 (Fibonacci 38.2% on August 2015-Januray 2016 debasement). A break of the latter would open the road towards 1.12 (Trump pre-election level). The ongoing French election will remain a hurdle for the single currency in the short-term.
As volatility drops, investors will demand EM FX
The most interesting result of the French election vote was the collapse of volatility indicators globally. The VIX index declined -19% from 15.30 while EURUSD one-month implied volatility fell to 8.20 from 13.45. The JP Morgan G7 volatility index fell to 8.03, a level not seen since November 2014. With volatility declining, a critical input in Emerging Markets investing is satisfied.
Looking forward to the next 2-3 months we are seeing clear sailing for EM investing. While developed markets are marginally rising, they remain significantly overvalued with corporate earning failing to warrant extended prices (INDU trailing 12-month PE at 20.81 and dividend yields 2.35 are both running well above historical averages). Given weak earnings, we doubt a mad rush from cash/EM in to European/US stocks, however there remains value in EM corporate. We concede that President Trump's renewed protectionism is concerning but given his lightening quick attention span, it is unlikely to remain a dominant policy objective (considering his healthcare and tax reform priorities).
We would avoid ZAR, TRY and MXN due to idiosyncratic risks but suspect yield chasers will migrate into high yielding EM. Finally, those that point to once historical accurate “sell in May” as a trading rationale, well there is not much to say there. Traders should watch today's US housing data, consumer confidence and manufacturing survey for the general direction of the US economy (and potential repricing for the Fed rate path).
Global Equities Up, Oil & Yen Weaken
Following the somewhat centrist victory in the first round of the French Presidential Elections global markets appear to be have gained some risk appetite back with Asian equities reaching a near 2 year high on Tuesday. The election also helped lift EUR and put downward pressure on safe-haven instruments. It is therefore likely that European equities will have a strong start this morning.
French Polls show Emmanuel Macron defeating anti-euro nationalist Marine Le Pen by as much as 30 percentage points in the second round of the French presidential election on May 7th.
Markets are likely to see additional impetus with President Trump promising an announcement on US Tax Reforms on Wednesday.
EUR was holding steady at $1.0885, retaining most of Monday’s 1.3 percent gain where EUR posted its strongest one-day performance in nearly a year; lifting EUR to a near 6 month high.
EUR gains had weighed on the dollar index, which touched a four-week low overnight. The index was marginally higher at 99.134, failing to make up most of Monday’s 0.9 percent loss.
USD advanced 0.4 percent to 110.32 JPY extending Monday’s 0.5 percent jump as investors sold off the “safe-haven” JPY.
Oil recovered marginally, following a week of losses, although gains were restricted by concerns that purported output cuts may not affect the current oversupply in global markets.
Gold recovered from last week’s lows of 7095 trading up to 1278.06 in early trading before retracing back to 1270.28.
GOLD Trading In A Temporary Correction
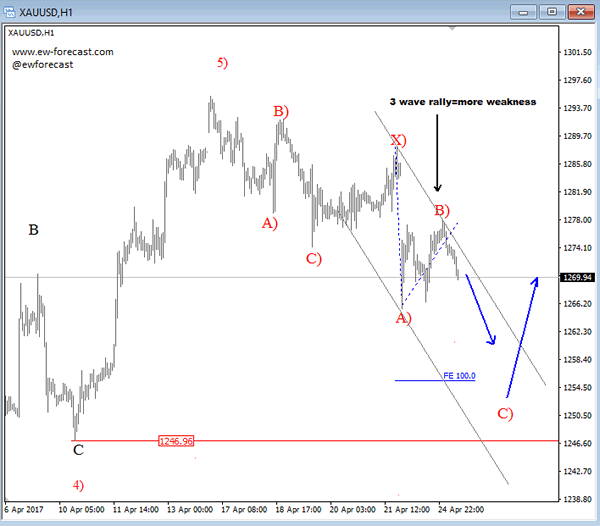
Metals are in a pullback for the last week or so which is seen as a temporary retracement and reason is a substructure of a decline which is clearly slow, choppy and overlapping on hourly chart, therefore it represents a correction within uptrend. We see one leg missing; wave C) to complete a seven leg decline, ideally at 1246-1255 zone.
GOLD, 1H
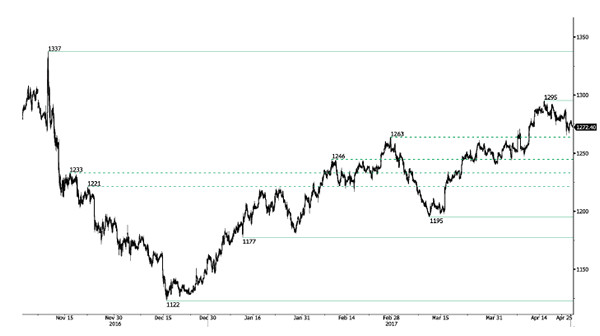
GOLD Bearish Consolidation, SILVER Weakening, CRUDE OIL Continued Decline.
GOLD Bearish consolidation.
Gold has faded near the hourly resistance at 1295 (18/04/2017 high), suggesting a pickup in selling pressures. Support can be located at 1265 (intraday low).
In the long-term, the technical structure suggests that there is a growing upside momentum. A break of 1392 (17/03/2014) is necessary ton confirm it, A major support can be found at 1045 (05/02/2010 low).
SILVER Weakening.
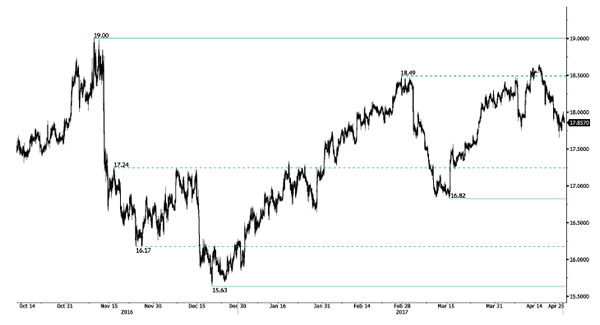
Silver has broken strong support at 18.16 (rising trendline) indicating further downside risk. Hourly support is given at 17.65 (intraday low) then 16.82 (15/03/2017 low). Strong resistance is given at a distance at 19.00 (09/11/2017 high).
In the long-term, the death cross indicates that further downsides are very likely. Resistance is located at 25.11 (28/08/2013 high). Strong support can be found at 11.75 (20/04/2009).
CRUDE OIL Continued decline.
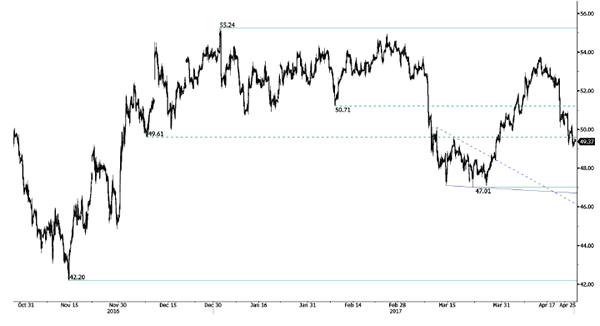
Crude oil has declined sharply, breaking the support at 50.71, yet now has paused. Support now lies at 49.63 (08/12/2017 low). Resistance for a short-term bounce can be found at 50.71 (old support) and 53.70 (12/04/2017 high).
In the long-term, crude oil has recovered after its sharp decline last year. However, we consider that further weakness are very likely. Strong support lies at 24.82 (13/11/2002) while resistance can now be found at 55.24 (03/01/2017 high).
EUR/JPY Consolidating Around 120.00, EUR/GBP Ready For Further Decline, EUR/CHF Slight Short-Term Bullish Momentum.
EUR/JPY Consolidating around 120.00.
EUR/JPY is back around 120.00. Key resistance stands at 123.31 (27/01/0217 high). Major support is given at 114.90 (18/04/2017low). Expected to see short-term bearish pressures.
In the longer term, the technical structure validates a medium-term succession of lower highs and lower lows. As a result, the resistance at 149.78 (08/12/2014 high) has likely marked the end of the rise that started in July 2012. Strong support at 94.12 (24/07/2012 low) looks nonetheless far away.

EUR/GBP Ready for further decline.
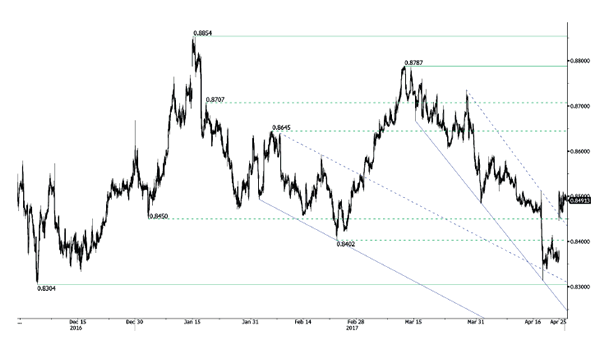
EUR/GBP's sharp rebound has now paused after unsuccessfully challenged its key support at 0.8304. Resistances for a temporary rebound are given by 0.8510 (intraday high). The short-term technical structure is negative as long as the resistance at 0.8596 holds. Expected to show renewed weakness.
In the long-term, the pair has largely recovered from recent lows in 2015. The technical structure suggests a growing upside momentum. The pair is trading above from its 200 DMA. Strong resistance can be found at 0.9500 psychological level.
EUR/CHF Slight short-term bullish momentum.
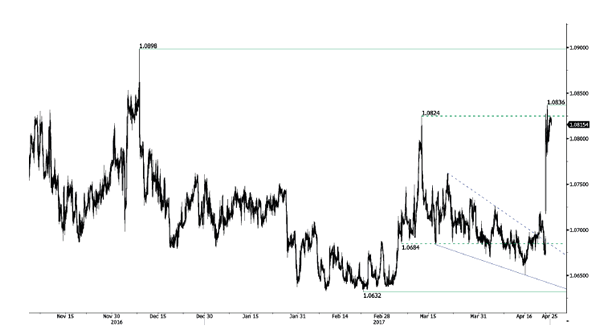
EUR/CHF continues to push higher, yet very slightly. However, despite the sharp increase and the bullish breakout which is very likely psychological, we believe that the medium-term pattern suggests us to see at some point renewed bearish pressures towards key support that can be found at 1.0623 (24/06/2016 low).
In the longer term, the technical structure is mixed. Resistance can be found at 1.1200 (04/02/2015 high). Yet,the ECB's QE programme is likely to cause persistent selling pressures on the euro, which should weigh on EUR/CHF. Supports can be found at 1.0184 (28/01/2015 low) and 1.0082 (27/01/2015 low).
USD/CHF Continued Weakness, USD/CAD Pushing Higher, AUD/USD Failing To Find Demand.
USD/CHF Continued weakness.
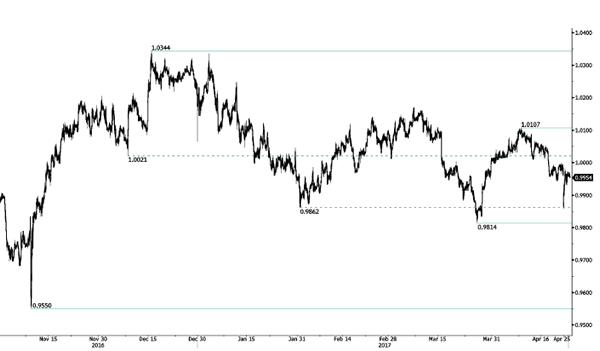
USD/CHF keeps on declining despite strong volatility. The short-term technical structure is negative as long as prices remain below the hourly resistance at 1.0171 (07/03/2017). Monitor strong support given at 0.9814 (27/03/2017 low).
In the long-term, the pair is still trading in range since 2011 despite some turmoil when the SNB unpegged the CHF. Key support can be found 0.8986 (30/01/2015 low). The technical structure favours nonetheless a long term bullish bias since the unpeg in January 2015.
USD/CAD Pushing higher.
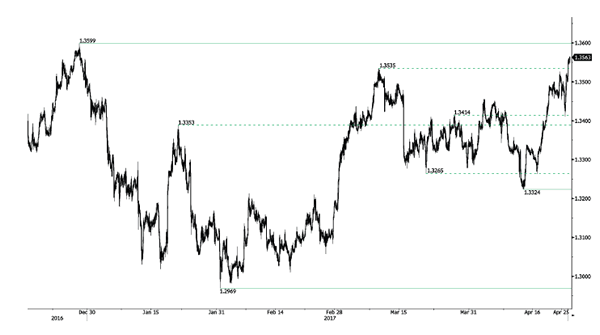
USD/CAD keeps on pushing higher. The pair is now consolidating. There is still a strong upside momentum. Resistance given at 1.3535 (09/03/2017 high) has been broken. Hourly support can be found at 1.3411 (24/04/2017 high) then 1.3353 (20/01/2017 high).
In the longer term, there is a golden cross with the 50 dma crossing the 200 dma indicating further upside pressures. Strong resistance is given at 1.4690 (22/01/2016 high). Long-term support can be found at 1.2461 (16/03/2015 low).
AUD/USD Failing to find demand.
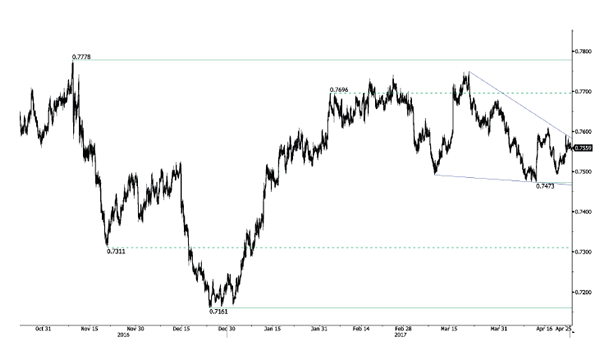
AUD/USD is still trying to bounce off strong support at 0.7473 (12/04/2017 low). However, as long as prices remain below the resistance at 0.7608 (17/04/2017 high), the short-term technical structure is negative. Key resistance stands at 0.7681 (30/03/2017 high).
In the long-term, we are waiting for further signs that the current downtrend is ending. Key supports stand at 0.6009 (31/10/2008 low) . A break of the key resistance at 0.8295 (15/01/2015 high) is needed to invalidate our long-term bearish view.
EUR/USD Consolidating After French Election First Round Rally, GBP/USD Consolidating Above Former Resistance At 1.2775. USD/JPY Increasing Demand.
EUR/USD Consolidating after French Election first round rally.
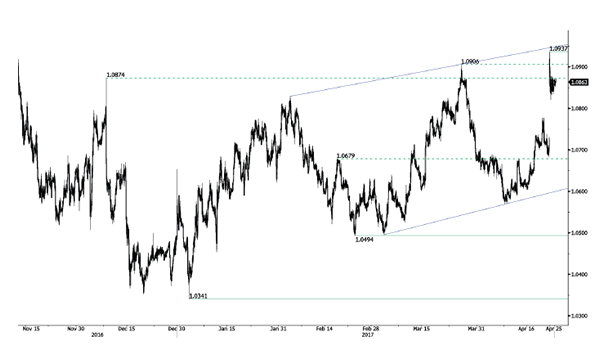
EUR/USD is pushing higher. Hourly support can be found at 1.0682 (21/04/2017 base) then 1.0576 (11.04.2017 low). Stronger support can be found at 1.0494 (22/02/2017 low). Resistance given at 1.0937 (24/03/2017 high) has been broken,
In the longer term, the death cross late October indicated a further bearish bias. The pair has broken key support given at 1.0458 (16/03/2015 low). Key resistance holds at 1.1714 (24/08/2015 high). Expected to head towards parity.
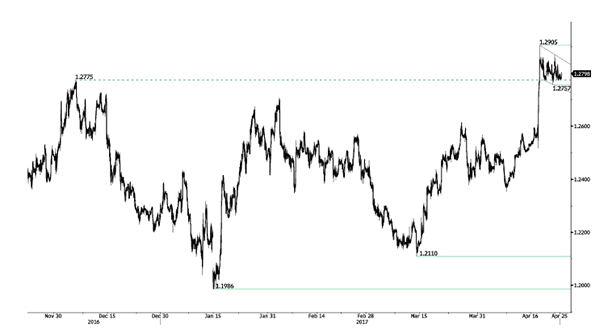
GBP/USD Consolidating above former resistance at 1.2775.
GBP/USD is consolidating lower after sharp bullish rally. Resistance stands at 1.2905 (18/04/2017 low). The pair is standing in a shortterm bearish momentum monitoring hourly support at 1.2757 (21/04/2017 low) as a break would confirm a weakening short-term bullish momentum. Hourly resistance is located at 1.2905 (18/04/2017 reaction high).
The long-term technical pattern is even more negative since the Brexit vote has paved the way for further decline. Long-term support given at 1.0520 (01/03/85) represents a decent target. Long-term resistance is given at 1.5018 (24/06/2015) and would indicate a long-term reversal in the negative trend. Yet, it is very unlikely at the moment.
USD/JPY Increasing demand.
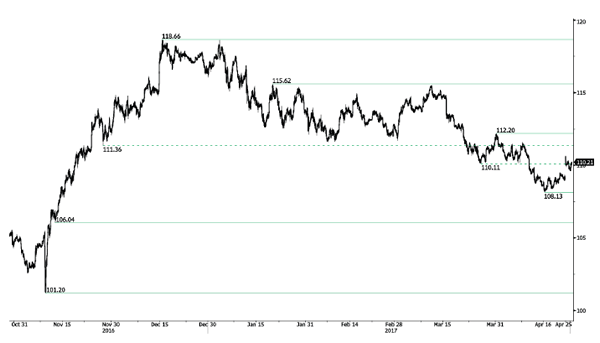
USD/JPY is drifting higher. Hourly resistance is given at 110.64 (23/04/2017 high). Stronger resistance can be found at 112.20 (31/03/2017 high). Closest support can be located at 108.13 (17/04/2017 low). Other key supports lie at a distant 106.04 (11/11/2016 low). Expected to show continued bullish pressures.
We favor a long-term bearish bias. Support is now given at 96.57 (10/08/2013 low). A gradual rise towards the major resistance at 135.15 (01/02/2002 high) seems absolutely unlikely. Expected to decline further support at 93.79 (13/06/2013 low).
German Ifo Business Climate Index Beats Experts’ Forecasts
'The German economy is growing strongly.' - Clemens Fuest, CESIfo
Group The mood of German companies improved unexpectedly in April, as the Ifo German Business Climate Index surged to 112.9, while experts expected that it would remain unchanged. Thus, the released figure hit a new record high in about six years, updating the previous month's record. Positive sentiment was registered in all four major sectors. Namely, in the retailing sector the Index reached its highest level since September 2015. In the construction sector assessments of the current business situation also hit a new record high. Similarly, estimates of the situation in the wholesale sector reached its highest value since 1991. Finally, manufacturers, especially from the electrical goods sector, also expected their production to rise. Such optimistic outlook is most likely based on a strong performance of the German economy in the Q1. The latest data on jobless claims showed that unemployment rate was equal to 3.9% and, thus, remained stable since November 2016. Nevertheless, inflation growth remained subdued, with the March inflation rate falling to 1.6%, the lowest in four months. It should be noted that April's survey was conducted prior to the first round of the French presidential election. Therefore, the Index did not reflect German businesses' reaction to the first-round election outcome.
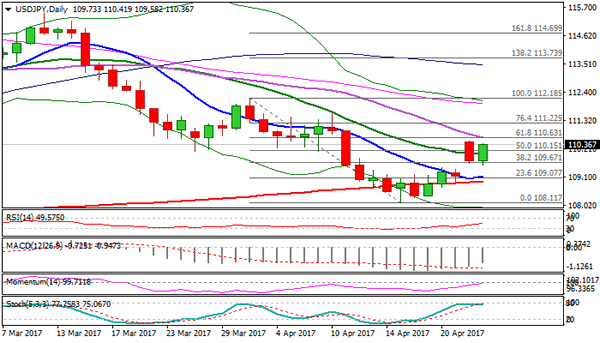
Technical Outlook: USDJPY – Renewed Strength Is Attempting At Strong 110.48/63 Barriers
The pair regained strength on Tuesday and returned above 110.00 barrier, following rejection of strong Monday's rally at 110.51 (capped by falling daily Kijun-sen) and subsequent fall.
Weakness from 110.51peak found support at 109.58 that prevented the pair of filling Monday's gap and signaling an end of 108.11/110.51 correction.
Strong resistance zone between 110.48 and 110.63 (daily Kijun-sen / Fibo 61.8% of 112.18/108.11) is under pressure and break here would signal fresh upside for possible attack at strong 111.36 barrier (top of thick weekly Ichimoku cloud.
Failure to break higher would signal extended consolidation and keep downside risk in play.
Res: 110.48, 110.63, 111.00, 110.36
Sup: 110.00, 109.58, 109.31, 109.13