
Sample Category Title
Trade Idea : EUR/USD – Stand aside
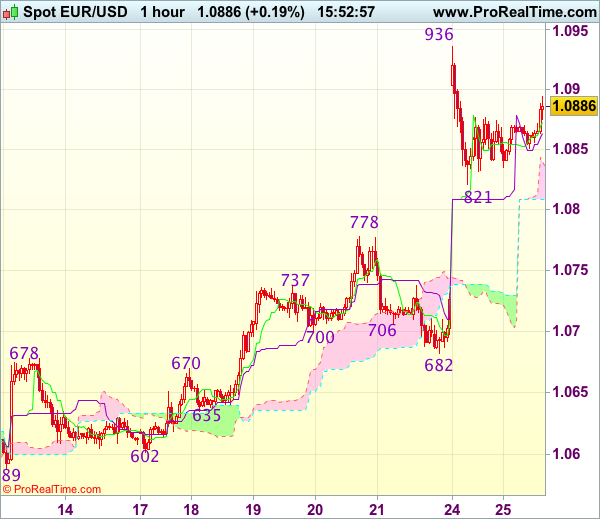
EUR/USD - 1.0887
Most recent candlesticks pattern : N/A
Trend : Near term up
Tenkan-Sen level : 1.0873
Kijun-Sen level : 1.0864
Ichimoku cloud top : 1.0835
Ichimoku cloud bottom : 1.0809
New strategy :
Stand aside
Position : -
Target : -
Stop : -
Euro’s retreat after rising to 1.0936 yesterday suggests consolidation below this level would be seen but reckon downside would be limited to 1.0850 and support at 1.0821 should hold, bring another rise later, above 1.0936 resistance would signal recent erratic upmove from 1.0340 has resumed and extend gain to 1.0975-80 and possibly towards 1.1000 which is likely to hold from here due to loss of momentum.
In view of this, would not chase this rise here and would be prudent to stand aside in the meantime. Below 1.0850 would bring test of said support at 1.0821 but break there is needed to signal top has possibly been formed, then fall to previous resistance at 1.0778 (now support) would follow, break there would add credence to this view and extend weakness to 1.0750.
Technical Outlook: GBPUSD Extended Consolidation Is Awaiting For Direction Signal
Near-term action remains unchanged and holding within 1.2770/1.2859 consolidation range under last week's fresh multi-month high at 1.2904.
Strong support has formed at 1.2770 (consolidation range floor, also former high of 06 Dec) where repeated downside attempts were contained.
The downside is reinforced by 1.2755 (Friday's spike low/Fibo 38.2% of 1.2513/1.2904 upleg), however, risk of deeper pullback remains in play as slow stochastic is turning down on daily chart, after reversing from overbought territory.
Firm break below 1.2770/55 supports would risk extension to 1.2700 (rising daily Tenkan-sen).
Otherwise, extended consolidation would look for bullish signal for renewed attempt at 1.2904 and possible extension towards 1.3000 barrier as overall structure is bullish.
Res: 1.2838, 1.2859, 1.2904, 1.2986
Sup: 1.2770, 1.2755, 1.2700, 1.2663
Trade Idea : USD/JPY – Stand aside
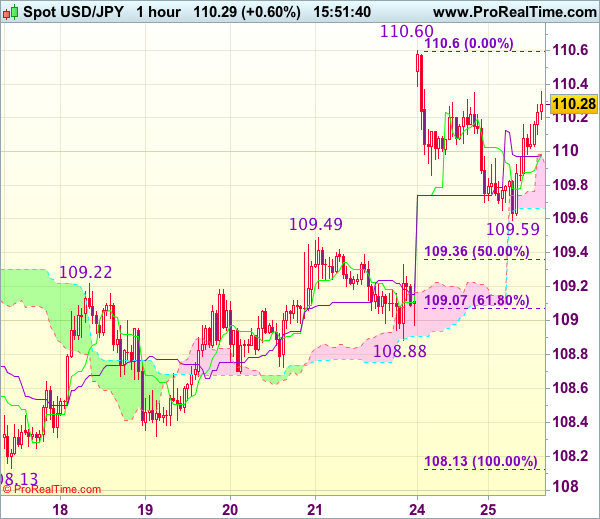
USD/JPY - 110.30
Most recent candlesticks pattern : N/A
Trend : Near term up
Tenkan-Sen level : 109.98
Kijun-Sen level : 109.98
Ichimoku cloud top : 109.98
Ichimoku cloud bottom : 109.66
Original strategy :
Buy at 109.30, Target: 110.30, Stop: 108.95
Position : -
Target : -
Stop : -
New strategy :
Stand aside
Position : -
Target : -
Stop : -
Although the greenback found good support at 109.59 and has rebounded, break of yesterday’s high at 110.60 is needed to signal recent upmove from 108.13 low has resumed and may extend further gain to 110.90-00, however, near term overbought condition should prevent sharp move beyond 111.25-30 and price should falter well below resistance at 111.58, risk from there is seen for a retreat later.
In view of this, would not chase this rise here and would be prudent to stand aside in the meantime. Below 109.90-95 would risk another retreat to 109.59 but break of previous resistance at 109.49 is needed to signal top is formed instead, bring correction of recent rise to 109.05-10 (61.8% Fibonacci retracement of 108.13-110.60).
Technical Outlook: EURUSD – Bullish Signals Above 200SMA
The Euro pauses after Monday's surge to fresh 5 ½ month high at 1.0916, consolidating around the mid-point of Monday's 1.0819/1.0916 range. Monday's close above 200SMA is bullish signal, along with long-tailed daily candle, formed on strong downside rejection at 1.0819 (weekly Kijun-sen).
Dip-buying scenario for fresh upside attempts will remain favored while the price holds above 200SMA.
Daily Tenkan-sen / Kijun-sen cross, formed after yesterday's rally, underpins.
Near-term focus is on 1.0916 high and weekly 55SMA at 1.0934, break of which would expose psychological 1.1000 barrier, also weekly 100SMA.
Further bullish acceleration may extend towards weekly cloud base at 1.1067.
Negative scenario requires break below 1.0835/19 (200SMA / weekly Kijun-sen) to signal stronger downside action.
Res: 1.0887, 1.0916, 1.0934, 1.1000
Sup: 1.0849, 1.0836, 1.0819, 1.0777
Markets In A Party Mode, Will The ECB Stop The Music?
The positive momentum driven by the outcome of the first round of voting in the French presidential elections extended into its second day. It now appears that investors are confident that Macron will be France’s next president and will win the battle on 7 May easily. Investors who lost confidence in pollsters after they failed to predict the outcomes of the U.S. elections and Brexit vote are all of a sudden viewing them as credible sources of information again. As a result, the French CAC rallied more than 4% to hit its highest levels since 2008, French bond yields declined sharply and the Euro jumped to a five-month high.
The importance of this one single event was reflected in asset classes across the globe, but whether this rally will have legs depends on how big Macron wins. Macron would need to win by a margin of more than 60% in the second round to unite a divided country and ensure that the spread of populism ends in France.
With concerns over the French election diminishing, traders will shift their attention towards monetary policy. While no changes to asset purchases or interest rates are expected during Thursday’s ECB meeting, Mario Draghi’s tone is what’s going to guide the Euro. Leading economic indicators have seen a fair improvement within the Eurozone, but inflation levels that have slipped to 1.5% in March from 2% in February are likely to keep Mr. Draghi on the defensive. I don’t expect much from this meeting, other than a reiteration of past statements, which is likely to cap Euro gains for now. Any hint of normalizing policy will push Euro above 1.10. However, I think this scenario is highly unlikely.
Before the ECB meets on Thursday, Trump is due to deliver a “big announcement” on tax reforms. I’m becoming little concerned over the President’s big announcements, especially since we haven’t seen any major legislative achievement so far and he will be marking his 100th day in the White House this Saturday. I believe that a repeat of the healthcare reform failure will end up sending the Euro above 1.10 without the need of ECB’s support.
Currencies: Dollar Hardly Profits As Sentiment Remains Risk-On
Sunrise Market Commentary
- Rates: Frexit no longer discounted; neutral ahead of ECB?
Yesterday's trading session suggests that the French presidential elections are no longer an issue for markets. In the run-up to Thursday's ECB meeting, we think the Bund will find some support. The US Note future remains strong despite upcoming supply and despite hints on a near-term announcement of Trump's tax reform plan. - Currencies: Dollar hardly profits as sentiment remains risk-on
EUR/USD and USD/JPY made a one-off rebound after the French election. However, especially the performance of USD/JPY was mediocre as the pair struggles to hold north of 110. Today, the focus turns to the US data and US politics. Will the Trump administration be able to cut taxes sufficiently to give the dollar interest rate support?
The Sunrise Headlines
- US equities managed to hold on to opening gains and closed more than 1% higher. Overnight, Asian risk sentiment remains positive with main bourses nearly 1% in the green.
- President Donald Trump has ordered White House aides to draft a tax plan that slashes the corporate tax rate to 15%, even if that means a loss of revenue, according to people familiar with the directive.
- The Trump administration will impose new tariffs on imports of Canadian softwood lumber after concluding that Canada subsidises the industry in a way that hurts the US. USD/CAD surged from 1.34 to 1.3550.
- US President Trump indicated an openness to delaying his push to secure funds for his promised border wall with Mexico, potentially eliminating a sticking point as lawmakers worked to avoid a looming government shutdown.
- Macron led Le Pen by at least 20 percentage points in three polls ahead of France's May 7 election. Ifop's daily survey showed him with a 60%-40% advantage, OpinionWay put it at 61%-39%, and Elabe put it at 64%-36%.
- The Home Office is trying to discourage EU nationals from applying for permanent residence in the UK to avoid being deluged by applications after the triggering of the Article 50 Brexit clause.
- Today's eco calendar contains US consumer confidence and Richmond Fed Manufacturing index. Germany, the Netherlands and the US supply the bond market. The ECB publishes its bank lending survey.
Currencies: Dollar Hardly Profits As Sentiment Remains Risk-On
Dollar remains in the defensive despite risk rally
On Monday, a (one-off) repositioning on the outcome of the French presidential election initially triggered good gains in the EUR/USD and USD/JPY. However, both cross rates soon found a new ST equilibrium and held tight ranges for the remainder of the session. EUR/USD held close to the 1.0850 pivot. USD/JPY initially drifted sideways in the low 110 area, but closed the session on a weak footing as US bond yields failed to maintain an earlier rise, despite a strong equity performance.
Overnight, Asian equities make more gains. Global markets are pondering the impact of President Trump's tax proposals and a spending bill that the needs to be approved soon to avoid a government shutdown. For now, it nurtures the global risk-on rally, but he rise in core bond yields remains modest. The yen weakens slightly after yesterday evening's set back. USD/JPY is again trading in the 110 area. EUR/USD is holding near 1.0865. The Canadian dollar declined against the USD (see headlines). USD/CAD trades at 1.3550, nearing the key 1.36 technical resistance.
Today, EMU calendar only contains second tier data. The US calendar is more important. US New Home sales rose a strong 6.1% M/M in February. After February's strong gains, we expect small additional gains for March. US Consumer confidence surged in March to a 16-year high and rose stronger than other measures of confidence. Consensus sees a slight drop to 122.5 from 125.6. Given the recent outperformance and the weak headline payrolls, we see some downside risks, but without compromising the strong underlying confidence. The Richmond Fed survey is expected to have dropped to 16 from 22. We have no reasons to distance ourselves from consensus.US consumer confidence has the most potential to move FX market. However, unless there is a sharp deviation from consensus, the reaction of the dollar should only be of intra-day significance. The USD reaction might be a bit more pronounced in case of a negative compared to a positive surprise.
Yesterday, the dollar hardly profited from the risk-on rebound as it was driven by a non-US event ( the French election result). The focus will now turn more to the US with markets keeping a close eye on the Trump tax proposals and on the approval of the spending bill in Congress. If a shutdown is avoided, it might support a risk rally and give the dollar some interest rate support. However, the dollar wasn't in good shape of late. So, we assume more consolidation in both EUR/USD and USD/JPY till there is more clarity on the US tax proposals and/or on the budget bill. A new failure to implement a workable fiscal policy would weigh on the dollar.
From a technical point of view, USD/JPY broke below the 110 key support. We downgraded our USD/JPY assessment to bearish. Next key support (62% retracement) comes in at 107.18. Yesterday's ‘rebound' suggested that a bottoming out process might be in store. However, the pair needs to regain the 112.20 level (neckline ST double bottom) to really improve the technical picture. EUR/USD extensively tested the topside of the MT range (1.0874/1.0906 area) late March, but the test was rejected and EUR/USD returned lower in the 1.0875/1.05 range. The move met support in the 1.06 area and the pair again tested the range top after the French election. We look out how this test turns out, but we are not convinced of a sustained break higher. If EUR/USD would regain the 1.10 barrier, next resistance comes in in the 1.1145/1.13 area (US pre/post-election swings).
EUR/USD holding near the recent highs. USD remains in the defensive
EUR/GBP
Euro strength supports EUR/GBP
Sterling trading was driven by the impact of the French election result on global markets yesterday. The euro jumped higher across the board. EUR/GBP filled offers north of 0.85 early in Asia, but the EUR/GBP rally stalled, as was the case for EUR/USD. The pair settled in a relatively tight range in the upper half of the 0.84 big figure. The price swings in cable were limited. The pair hovered around the 1.28 pivot. The CBI total orders trends were slightly softer than expected at 4 (from 8 in March). The report suggests softer growth at the start of Q2, but the impact on sterling was limited. EUR/GBP closed the session at 0.8493. Cable finished the day at 1.2796.
Today, the eco calendar contains the monthly UK budget data. These data are usually only of second tier importance for sterling trading, at best. Of late sterling held strong. For now Brexit uncertainty is a bit off the radar for sterling trading as there will probably be few concrete developments before UK election on June 8. At the same time, the UK eco data were good enough for investors not to add to sterling shorts or even reduce stale short positions. Yesterday's EUR/GBP rebound was a euro move. The price moves in cable suggested that sentiment on sterling remains rather constructive for now.
We had a neutral short-term bias on EUR/GBP. Early last week, EUR/GBP dropped below the bottom of the EUR/GBP 0.84 support, improving the sterling picture. The pair came within reach of the key 0.8305 support (Dec low), but no real test occurred. After yesterday's rebound, the range bottom looks better protected. Longer term, Brexit-complications remain a potential negative for sterling. Of late, this was not the focus of sterling trading. Nevertheless on technical considerations, we are inclined to reconsider a cautious EUR/GBP buyon- dips approach.
EUR/GBP: jumps on French election. 0.83 range bottom looks safe for now
EURUSD May Be In For A Reversal
On the 4h chart of EUR/USD, we can see that price made a sharp structure from around the 1.0604 region which is now viewed as wave C) of Y. That said this whole correction since December of last year that is in motion is known as a double zig-zag, which may be trading in final stages as we already see sub-wave C) unfolding a minor five wave move within itself. As such a reversal to the downside may be around the corner, ideally around the Fibonacci ratio of 100.0
EURUSD, 4H
The ECB’s Bank Lending Survey Is Due For Release
Market movers today
The ECB's Bank Lending Survey is due for release. The latestreport from January showed that loan growth continued to be supported by increasing demand across all loan categories, while creditst andards (i.e. banks' internal guidelines or loan approval criteria) for loans to enterprises tightened somewhatin net terms due to banks' lower willingness to tolerate risk.
Rate decision in Hungary. We expect the National Bank of Hungary (NBH) to keep its base rate unchanged at 0.9% today. The inflation rate rose to 2.9% y/y in February, near the central bank target of 3%. However, the rise in inflation so far is driven mainly by a base effect of energy prices, and thus no imminent pressure for higher interestrates.
In the US, Conference Board for April is due. The indicator is at very high levels and although we do notexpect to see a significant decline, we would also not be surprised to see a small decline given the historically high levels. In general, we have seen a divergence between 'hard' and 'soft ' data in recent months, when soft data has been strong and hard data weak. Softdata indicates growth in the region of 1.5-2.0%, while the Fed At lanta GDP nowcastshows growth in Q1 of 0.5% q/q AR.
In Sweden, unemployment figures are due . For more on the Scandi region, see p.2.
Selected market news
The very strong risk relief rally in Europe yesterday post the firstround of the French presidential election continued in the US session with Dow Jones and S&P500 closing 1% higher, and markets in Asia are also trading higher this morning. In fixed income markets, yields on German government bonds rose some 9-11bp across the curve while the 5Y OAT -Bund spread tightened 25bp and is now back at a level last observed at the end of last year, meaning any French political risk premium is gone.
The election outcome was in line with prior opinion polls, and yesterday's strong risk rally could indicate thatinvestors were caught on the wrong foot and/or markets now see Macron winning the presidency as a done deal. New polls released yesterday confirmed a solid 60% to 40% lead for Macron versus Le Pen in the second run-off on 7 May, and comments in the media also suggest that most political commentators see Macron winning in the second round.
However, while the risk rally could continue in the coming days, we still see a risk of volatility rising again driven by profit taking and risk reduction going into the second round on 7 May. Moreover, our equity strategy team still holds the view thatequity markets will soon be back focusing on growth.
With political uncertainty related to the French presidential election cleared (for now at least ), focus is likely to turn to the US, where President Trump has announced that he will present his tax plans on Wednesday. According to the media, Trump will call for cutting taxes for individuals and lowering the corporate rate to 15%. Moreover, the Trump administration yesterday said it will impose new tariffs on imports of Canadian softwood lumber. This marks the latestexample of the new administration taking a tougher stance on trade practices that the US considers unfair. Last and not least , the mostrecent government funding bill expires on Friday 28 April. If both chambers fail to approve a new funding bill before midnight on Friday 28 April, the government would run out of money to pay its bill and a shutdown would begin.
Market Update – Asian Session: Trump Keeps The Pressure On North Korea
Asia Mid-Session Market Update: Trump keeps the pressure on North Korea, defers on border wall funding;  CAD under pressure as US protectionism looks north
US Session Highlights
(US) Mar Chicago Fed National Activity Index: 0.08 v 0.50e
(US) APR DALLAS FED MANUFACTURING ACTIVITY: 16.8 V 17.0E; New order growth rate: 5.1 v 3.2 prior
US and EU stocks were given a boost of confidence today after yesterday's first round of French presidential elections put mainstream candidate (and likely eventual winner) Macron into the second round. Investors returned to risk in a big way, sending the Dow to jump 176 points at the open. Financials were the outperforming sector for the S&P, gaining 2.27%. Fixed income continued to pay the price, as the 10-yield rose back above 2.30%.
US markets on close: Dow +1.1%, S&P500 +1.1%, Nasdaq +1.2%
Best Sector in S&P500: Financials
Worst Sector in S&P500: Real Estate
Biggest gainers: BCR +19.5%; HAS +5.7%; XLNX +3.0%
Biggest losers: BDX -4.4%; KIM -2.9%; MU -2.8%
At the close: VIX 10.8 (-3.8pts); Treasuries: 2-yr 1.23% (+4.5bps), 10-yr 2.27% (+3.7bps), 30-yr 2.93% (+3.2bps)
US movers afterhours
UIS Reports Q1 $0.30 v $0.11 y/y, R$664.5M v $626Me (1 est)- Affirms FY17 R$2.65-2.75B v $2.70Be, FCF $130-170M (prior R$2.65-2.75B, FCF $130-170M); +12.6% afterhours
LLNW Reports Q1 $0.02 v $0.00e, R$44.7M v $43.4Me; +11.6% afterhours
HUM Pre-announces Q1 $2.75 v $2.43e, R$13.5B v $13.6Be; Raises FY17 guidance; +2.8% afterhours
WHR Reports Q1 $2.50 v $2.67e, R$4.79B v $4.76Be; Cuts FY17 GAAP guidance; -1.8% afterhours
ABX Reports Q1 $0.14 v $0.24e, R$1.99B v $2.18Be; -3.6% afterhours
ESRX Reports Q1 $1.33 v $1.32e, R$24.7B v $25.0Be; discloses Anthem intends to move its business when the current contract expires in 2019; -14.9% afterhours
Politics
(US) Pres Trump believes he can get funding for the border wall either now or in Sept - One America News Network
Key economic data
(JP) JAPAN MAR PPI SERVICES Y/Y: 0.8% V 0.7%E
(KR) South Korea Mar Consumer Confidence: 101.2 v 96.7 prior (6-month high)
Asia Session Notable Observations, Speakers and Press
Asian indices continued to trend higher, tracking outsized rally on Wall St on the heels of market-friendly French presidential elections Round 1 results. Hang Seng is up nearly 1% with banks leading the way, while Nikkei225 remains supported by softer JPY. Japanese Telecoms are particularly soft on speculation of discounting due to competition in the sector, and industrials are performing strongly. Australia is on holiday for Anzac day.
In FX, EUR and AUD were rangebound against the greenback, while NZD retreated below $0.70. Kiwi weakness partially attributed to trade protectionism stateside, as US Commerce Ministry determined that Canada softwood lumber exporters get subsidies, applying a 20% tariff, also warning it may put an import tax on Canadian dairy products. USD/CAD spiked up over 50pips above 1.3550 - highest level since late December on the protectionist posturing, just as Canada govt ministers Freeland (Foreign Affairs) and Carr (Natural Resources) condemn "unfair and punitive" dutes on softwood lumber.
US political risk of govt shutdown was dialed down to a simmer, with US President Trump claiming he could wait on funding the southern border wall to avert an impasse with Congress. Geopolitics on the Korean peninsula remain tense however as US administration officials will hold a session with the full Senate abouth the North Korea threat on Wednesday.
China
(CN) China said to have indicted former Stats Bureau head Wang on bribery - Chinese press
(CN) China issues plan for medium and long term auto sector development
Japan
(JP) Japan Fin Min Aso: Economy has prospered due to benefits of free trade
(JP) BOJ Dep Gov Iwata: Doing internal simulations of exit from QE; Too early to discuss exit externally
Korea
(US) President Trump has called on the UN Security Council to be prepared to impose additional sanctions against North Korea’s nuclear and ballistic missile programs; Says now is the time to solve the problem of North Korea - financial press
(KR) South Korea Nuclear Envoy Chief: Discussed with US, Japan counterparts ways to gain cooperation from China and Russia on North Korea
Asian Equity Indices/Futures (00:00ET)
Nikkei +0.8%, Hang Seng +0.9%, Shanghai Composite +0.4%, ASX200 closed, Kospi +0.5%
Equity Futures: S&P500 +0.1%; Nasdaq +0.1%, Dax +0.2%, FTSE100 +0.3%
FX ranges/Commodities/Fixed Income (00:00ET)
EUR 1.0850-1.0870; JPY 109.60-110.20; AUD 0.7550-0.7570; NZD 0.6985-0.7015
June Gold -0.2% at 1,275/oz; June Crude Oil +0.5% at $49.46/brl; July Copper +0.7% at $2.58/lb
SPDR Gold Trust ETF daily holdings rise 1.5 tonnes to 860.2 tonnes; 2nd straight increase
Goldman Sachs continues to expect pressure in Gold prices with 3-month target of $1,200/oz; Medium term target remains at $1,250/oz - press
(CN) PBOC SETS YUAN MID POINT AT 6.8833 V 6.8673 PRIOR; Weakest Yuan fix since Apr 18th; biggest margin of weakness since Mar 7th
(CN) PBOC to inject combined CNY80B v CNY30B prior in 7-day, 14-day and 28-day reverse repos, 6th straight injection
Asia equities / Notables / movers by sector
Japan
JSR (4185) +0.9%; FY16/17 results
NEC (6701) +3.8%; FY16/17 results
Lixil (5938) -4.3%; FY16/17 results
Kose (4922) +1.2%; FY16/17 results
NTT Docomo (9437) -2.1%; FY17 results speculation
Mazda (7261) +1.8%' FY17 result speculation
Hong Kong
AAG Energy (2686) -1.6%; Q1 results
Northeast Electric Development (42) +0.9%; Q1 results
Korea
Korea Zinc (010130) +2.3%; Q1 results
SK Innovation (096770) +3.0%; Q1 results
SK Hynix (000660) -0.8%; Q1 results
Aussie Trading Lower In The Morning Session
For the 24 hours to 23:00 GMT, the AUD rose 0.19% against the USD and closed at 0.7567.
On the economic front, in China, Australia's largest trading partner, the leading economic index rose 0.9% on a monthly basis in March. In the previous month, the index had climbed by a revised 1.3%.
LME Copper prices rose 0.2% or $11.0/MT to $5612.0/MT. Aluminium prices declined 0.2% or $4.5/MT to $1928.0/MT.
In the Asian session, at GMT0300, the pair is trading at 0.7559, with the AUD trading 0.11% lower against the USD from yesterday's close.
The pair is expected to find support at 0.7541, and a fall through could take it to the next support level of 0.7522. The pair is expected to find its first resistance at 0.7581, and a rise through could take it to the next resistance level of 0.7602.
Moving ahead, traders would keep a close watch on a speech by the Reserve Bank of Australia's (RBA) Governor, Philip Lowe along with the release of Australia's consumer price index for 1Q, both due tomorrow.
The currency pair is trading between its 20 Hr and 50 Hr moving averages.
