Sample Category Title
Foreign Exchange Market Commentary: EUR/USD, USD/JPY, GBP/USD,AUDUSD, GBPCAD, GOLD, WTI CRUDE, DJIA, FTSE100, DAX
EUR/USD
The Euro welcomed the victory of centrist candidate Emmanuel Macron on the first round of French presidential election and gapped higher around two hundred pips against the dollar on Monday's market opening. EURUSD surged on relief from fears of Frexit scenario on victory of anti-EU candidate Marine Le Pen. Macron took 23.8% of the votes on the first round of election while Le Pen was the second with 21.7% votes and these two candidates are going to the final round.
Polls show strong advantage of Macron and expect his victory by 20 percentage points.
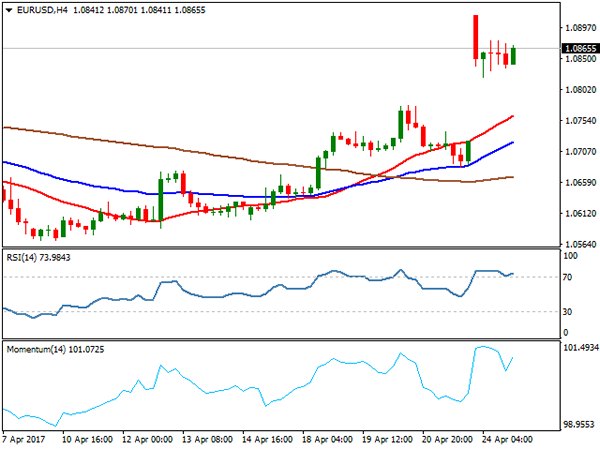
The Euro surged to fresh 5 ½ month high against dollar at 1.0916 in early Monday's trading but eased back around hundred pips and stayed within 1.0820/77 consolidation during the most of Monday's trading.
The pair remained supported by 200SMA at 1.0835, as probe below was short-lived and contained by weekly Kijun-sen line at 1.0820.
Firm bearish setup of daily studies continues to support, as freshly-formed daily Tenkan-sen / Kijun-sen bull-cross underpinning.
Close above 200SMA is needveled to maintain immediate bullish bias for fresh upside, as regain of 1.0916 high would signal extension towards psychological 1.1000 barrier.
Conversely, close below 200Sma would signal deeper correction, the picture is exected to remain bullishly aligned while today's gap remains unfilled.
Support: 1.0835, 1.0820, 1.0777, 1.0752
Resistance: 1.0877, 1.0916, 1.0950, 1.1000
USD/JPY
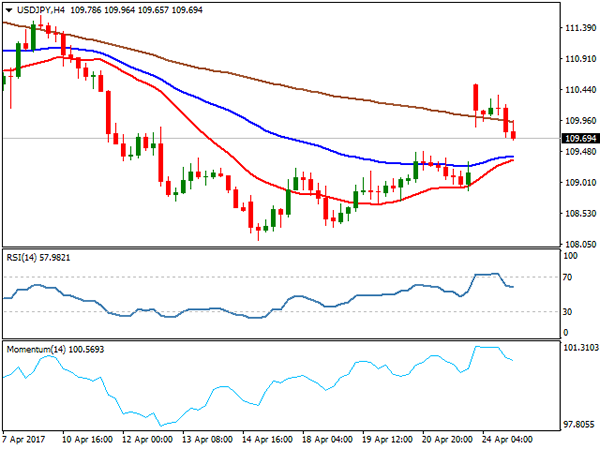
USDJPY pair opened with gap higher on Monday, boosted by fresh risk appetite that prompted traders out of safe haven yen longs and pushed the dollar higher. Fresh strength spiked at 110.52, where rally was capped by falling Kijun-sen and reversed below cracked psychological 110.00 level. Near-term bias is turning higher after pivotal barriers at 110.00/25 were dented, however, daily close above these levels (reinforced by 20SMA) is needed to generate stronger bullish signal for extended recovery from 108.11 low and possible full retracement of 111.57/108.11 descend.
Dips from fresh high at 110.52 were so far contained by strong supports at 109.84/70 (top of thick 4-hr chart / 4-hr Tenkan-sen) and while these supports hold, fresh upside attempts will remain in play.
Otherwise, break lower would risk further easing and filling Monday's gap that would weaken near-term structure again and risk further downside.
Next key support lies at 108.92 (200SMA), guarding 108.11 (Apr 17 low).
Support: 109.70, 109.43, 108.92, 108.71
Resistance: 110.00, 110.25, 110.52, 110.76
GBP/USD
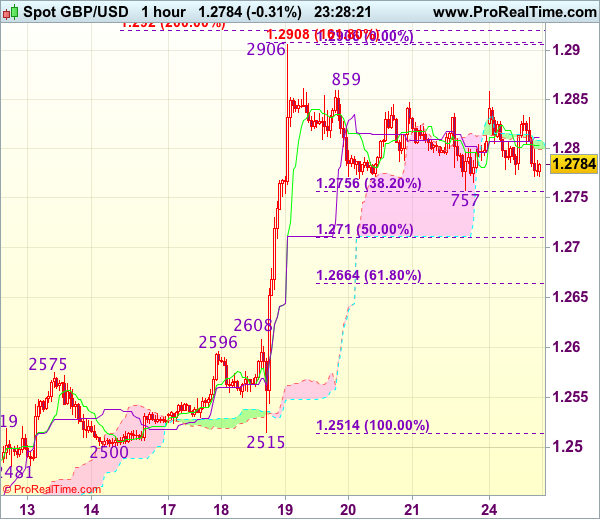
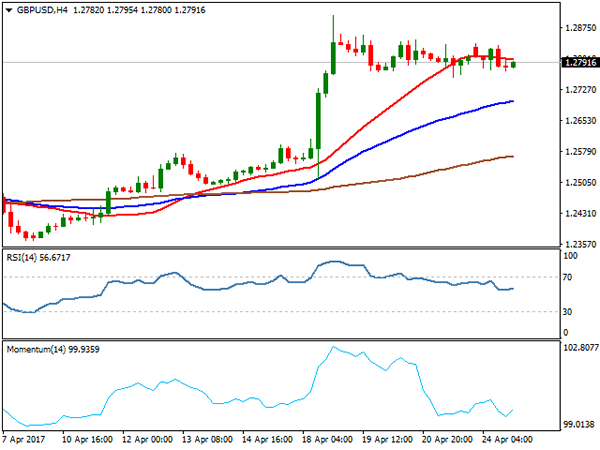
GBPUSD remained in red on Monday, despite being dragged by Euro's rally to the session high at 1.2837, as gains proved to be short-lived. However, the pair remains within near-term consolidation range between 1.2859 and 1.2775, where easing from last week's multi-month high at 1.2905 was contained by Fibonacci 38.2% retracement of 1.2814/1.2905 rally.
No clear direction is seen while the pair holds within consolidation range, however, risk of deeper pullback exists on bearish signal generated on reversal of daily RSI / slow stochastic from overbought territory.
Firm break below 1.2755 handle would risk extension to 1.2700 support, reinforced by rising daily Tenkan-sen line and 1.2663 (Fibonacci 61.8% retracement of 1.2814/1.2905 upleg). To neutralize downside risk and shift near-term focus higher, sustained break above 1.2859 pivot is needed.
Support: 1.2770, 1.2755, 1.2700, 1.2653
Resistance: 1.2837, 1.2859, 1.2905, 3000
AUDUSD
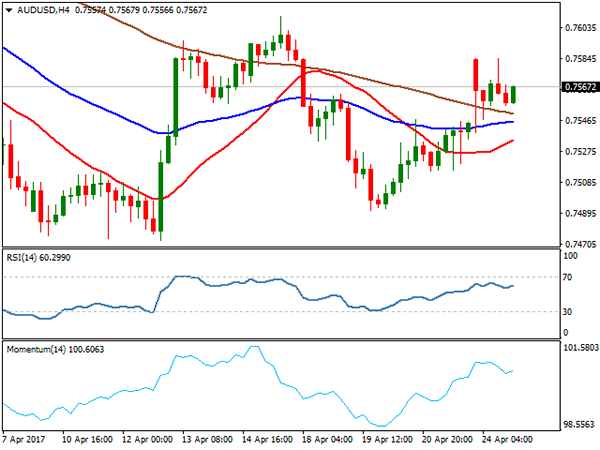
The AUDUSD pair is on track for daily close in red after spiking to 0.7584 on gap-higher opening, but was unable to hold gains despite repeated attempt towards the daily high.
However, overall structure is expected to remain biased higher on daily close above 200SMA at 0.7550, which was taken out on Monday's gap-higher opening.
While the price is holding above 0.7550, fresh upside attempts could be anticipated, with break above day's high at 0.7584, needed to open key near-term barrier at 0.7610 (top of thick daily Ichimoku cloud, reinforced by Kijun-sen line) also former high of Apr17.
Alternatively, loss of strong supports at 0.7550/41 (200SMA / daily Tenkan-sen) would weaken near-term structure and signal recovery stall.
Support: 0.7550, 0.7537, 0.7518, 0.7491
Resistance: 0.7565, 0.7584, 0.7596, 0.7610
GBPCAD
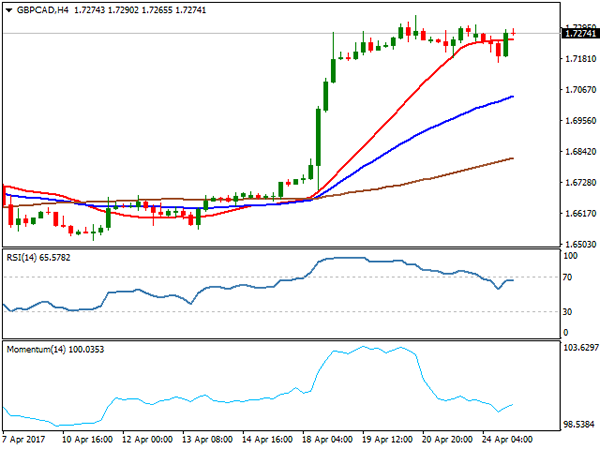
The GBPCAD cross remains firm and consolidating under last week's fresh high at 1.7340 (the highest since mid-Sep 2016), with long-tailed candles of past two days, signalling strong downside rejections and continuing to underpin the action.
Strong bulls on daily chart are supportive for further upside and ignoring for now overbought conditions. The pair may extend to 1.7524/42 (highs of Sep 11 / July 31 2016 respectively) on fresh bullish acceleration through recent high at 1.7340, however, risk of corrective easing should be anticipated, despite lack of firmer bearish signals for now.
Broken weekly Ichimoku cloud base offers solid support at 1.7078, which is expected to ideally contain corrective dips.
Support: 1.7200, 1.7167, 1.7145, 1.7078
Resistance: 1.7306, 1.7340, 1.7436, 1.7524
GOLD
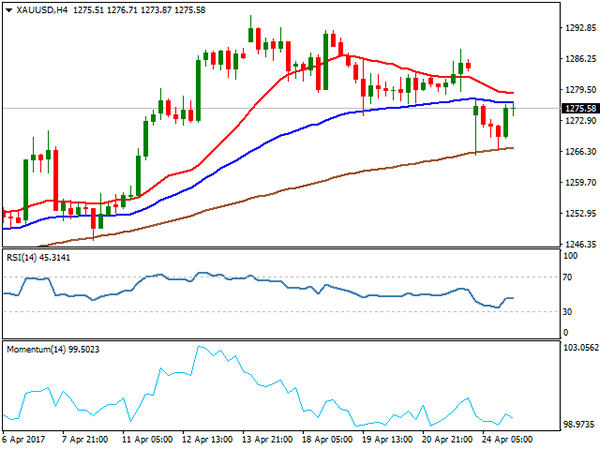
Spot Gold opened with gap-lower on Monday, pressured by renewed risk appetite that moved traders' bets from safe haven instruments to riskier assets. Gold price spiked to $1265 low on Monday (rising 20SMA), after opening lower for $10, but managed to recover most of day's losses on return to $1275, former strong support (Fibonacci 38.2% of $1239/$1295 rally, reinforced by rising daily Tenkan-sen line).
Long-tailed Monday's daily candle that signalled downside rejection and swift recovery, underpins near-term action which needs close above $1275 zone for fresh bullish signal and attempts to fill Monday's gap.
Such scenario would turn near-term focus higher and signal an end of corrective phase from $1295 peak.
Otherwise, downside is expected to remain vulnerable while the price holds below $1275 pivot.
Support: 1272, 1265, 1261, 1258
Resistance: 1277, 1284, 1288, 1292
WTI CRUDE OIL
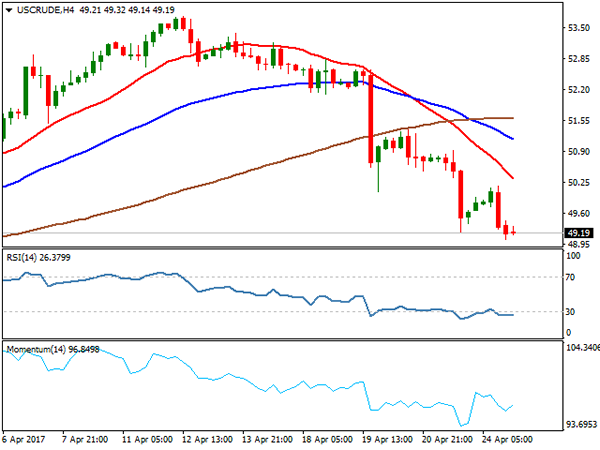
WTI crude oil extended losses further on Monday, being in red for the sixth consecutive day, as investors are not sure whether OPEC would seek to extend the current deal to curb global supply amid rising levels of U.S. shale oil production. Oil price fell to fresh nearly one-month low at $49.05 on Monday, coming ticks ahead of strong support at $48.99 (200SMA), after strong bearish signal was generated on last Friday's break and close below psychological $50.00 support.
Long bearish candle of last week weighs heavily at near-tem action for final break below 200SMA ($48.99) and weekly Kijun-sen line at $48.70 that would open way towards key support – higher base at $47.07.
Meantime, corrective attempts could be expected on oversold daily slow stochastic, with solid barriers at $50.40 (broken daily Kijun-sen) and $50.74 (daily Ichimoku cloud base) expected to cap.
Support: 49.05, 48.99, 48.70, 48.37
Resistance: 50.00, 50.17, 50.40, 50.74
DJIA
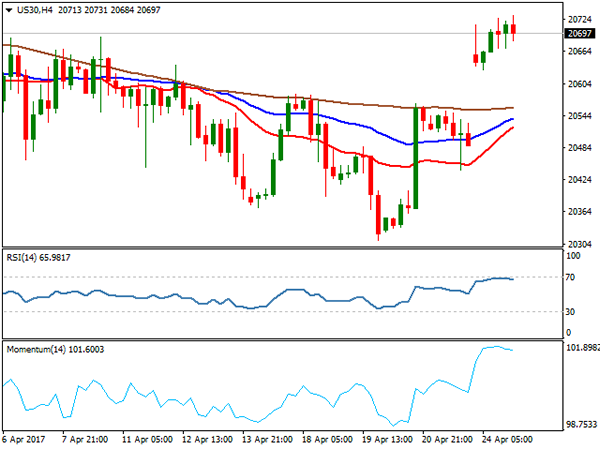
Stocks were higher on Monday on renewed demand for risk assets and dragged Dow Jones index higher to eventually break above 20SMA (currently at 20552) which capped the action of past five days.
Gap-higher opening on Monday and subsequent bullish acceleration is pressuring key barrier at 20738 (top of thick daily Ichimoku cloud, also 50% of entire 21160/20310 pullback) to signal further recovery on close above the cloud.
Technical studies show daily MA's turning into full bullish setup and fresh momentum seen on break above the midline that favors further recovery.
However, hesitation at strong 20738 barrier could be expected as slow stochastic entered overbought zone on daily chart. Daily 55SMA which holds Monday's action at 20630 marks initial support, with extended dips to be contained above 20SMA to keep fresh bulls in play.
Support: 20669, 20630, 20552, 20442
Resistance: 20738, 20835, 20916, 20959
FTSE100
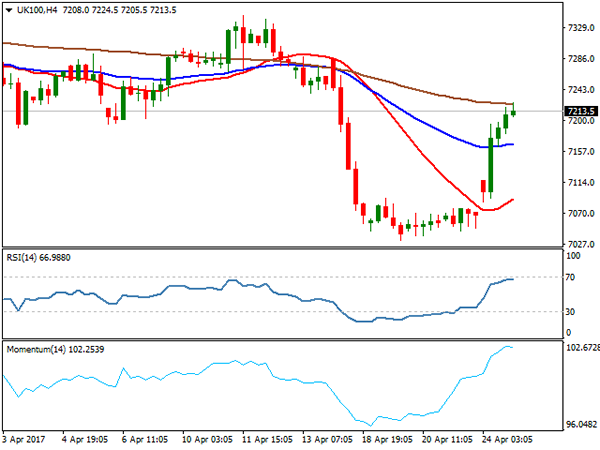
FTSE index rallied strongly on Monday and retraced 76.4% of last week's sharp fall, on biggest one-day gain since Mar 1. Strong bullish acceleration that was sparked week's opening with gap higher, penetrated into daily Ichimoku cloud and closed above cloud base. Fresh bullish sentiment that was established on today's strong recovery rally is eyeing immediate barrier at 7238 (daily Kijun-sen), break of which would open way towards daily cloud top at 7273 and signal full retracement of 7285/7032 fall, sparked by announcement of early election in the UK.
Technical studies on daily chart are supportive, as RSI and slow stochastic reversed from oversold territory and show a plenty of room at the upside.
Broken daily Tenkan-sen ant 7189 and 100 SMA at 7149 offers solid supports which are expected to keep the downside protected.
Support: 7189, 7149, 7129, 7086
Resistance: 7224, 7238, 7273, 7285
DAX
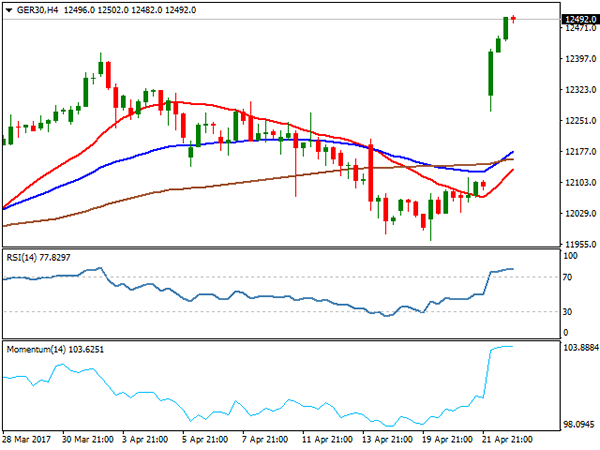
DAX surged after opening with over 200 points gap-higher on Monday and hit fresh all-time high at 12502. Strong rally in stocks came on relief on victory of Emmanuel Macron on the first round of French election that neutralized persisting fears in the markets of further destabilization of the EU on Frexit scenario. Monday's rally marked the biggest one-day f=gains since Mar 1, as the price spiked to fresh record high and entered into uncharted territory.
Firm bullish structure of technical studies on larger timeframes and today's close above former record high at 12410, suggest further advance that is also expected to be driven by fresh bullish sentiment. Dax will be looking for projected level at 12581 and 12687 (Fibonacci 1382% and 161.8% projection of the upleg from 11962), with shallow corrective dips expected to hold above 12300 handle.
Support: 12400, 12300, 12232, 12168
Resistance: 12502, 1581, 12687, 12858
Market Morning Briefing: Anxiety Over The French Elections Fading
STOCKS
Results of the first round of French elections have brought in hopes to the investors throughout the world except China. Macron would face off with Le Pen for the second round on 7th May but the stocks could see some upside before that. .
Dow (20763.89, +1.05%) has risen well from levels above 20400 but could test immediate resistance near 21050-21200 levels from where a short dip is possible.
Dax (12454.98, +3.37%) opened with a gap up and shot up to close at the day's high of 12454 yesterday breaking above the apr'15 high of 12391. There is a fair chance of testing 12540 today before a pause is seen.
Shanghai (3132.93, + 0.11%) is the only weak performer amongst the other Asian indices. It has broken below the weekly support trend lines and for now only the 3-day support near 3100-3080 is visible which gives some hope of recovery in the medium term. Else an initiation of a sharp fall is possible for the longer term.
Nikkei (19034.74. +0.84%) has been pulled up buy a weaker Yen since the last 2-sessions. Either the index moves up to test 19800 before coming off from there or comes off immediately from current levels. We prefer some more upside while the global indices are moving up on the favored French election results.
Nifty (9217.95, +1.08%) has some scope of testing 9300-9400 levels before seeing a sharp corrective fall from there. A rise yesterday has proved the support near 9100 to be holding well for now. In case this continues, we could see an attempt to rise towards 9300 in the near term.
COMMODITIES
Gold (1275) moved little during the session as it closed near the midpoint of our expected range of 1260-1305. As stated before, the sideways consolidation is expected to continue. We have been expecting 1260 for gold to hold for some time as buyers are taking every dip as a further opportunity for buying. 1301 could be a level where the price action has to be checked to assess the chances of further bounce to 1328 to 1350 levels.
Silver (17.87) had also moved lower till 17.54 but managed to close above its crucial support of 17.60-70 levels. Immediate trading range could be 17.60-18.35. We think that the corrective phase could be restricted till 17.60-70 levels due to near term oversold condition.
Copper (2.54) has been stuck in the range of 2.50-2.67. A close below 2.50 could open up 2.48 and 2.45 levels respectively. Only above 2.67, higher resistances of 2.72 -80 can come into consideration.
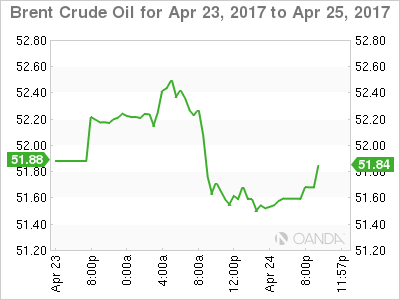
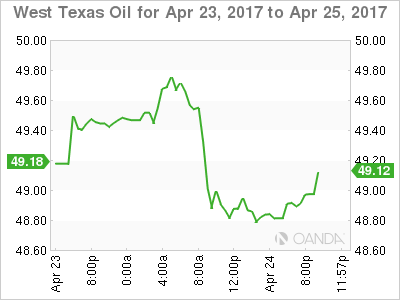
Brent (51.90) and WTI (50.27) both had moved lower in line with our expectation. They are within their trading ranges of 50.09-52.15 and 50.25-51.70 respectively. Brent may consolidate within these levels for few more sessions though the possibility of a decline towards supports can't be ruled out. A close below 50.20 could drag WTI towards 48.36 levels. We will remain bearish while Brent and WTI are trading below 53.60 and 51.70 levels respectively.
FOREX
Anxiety over the French elections fading, the focus now turns to the Trump's plans to be unfolded tomorrow, 25th April. The impact of the Trump-plans can move Dollar sharply in the near term.
Dollar Index (99.13) is trading quietly near the very significant support of 98.90-50 (modified) from where it can still bounce very sharply. The chances of a major reversal from the current levels must be considered despite the prevailing downtrend. As discussed yesterday, the initial signs of a larger degree correction coming to an end are visible, though pending confirmation.
Euro (1.0851) is stable at the higher levels but the maximum upside may be limited to 1.0930-50, though even these levels may not be revisited in the near term. A gradual decline to 1.0700 or lower looks the more likely option.
Pound (1.2779) has been one of the most stable majors in the last few sessions and it may continue its sideways consolidation in the range of 1.2750-1.2900 with a bearish bias. The chances of a retest of 1.2600 in the coming days can't be ruled out.
Dollar-Yen (110.04) has been struggling around the resistance of 110.10 in line with our expectations but the demand near the immediate support of 109.40-25 has brightened the chances of seeing 111.50-112.00 in the next 2-4 sessions.
Aussie (0.7557) remains absolute quiet as the Australian markets are closed today. Expect the sideways trading in 0.7450-0.7600 to continue for the next week.
Dollar-Rupee (64.44) keeps oscillating in the range of 64.20-70. Immediate minor support comes at 64.40 from where it may bounce back to 64.60 once again but the broader oscillation in the range of 64.20-70 is expected to continue.
INTEREST RATES
Sharp rise in the German yields seen in the last 2-sessions on the Fresnch election reulsts. The 5Yr (-0.35%) and the 30Yr (1.07%) is up from -0.33% and 1.06% respectively while the 10Yr (0.334% is down from 0.3525. There is some more room on the upside for the yields to rise before testing the medium term resistance levels. Near term looks bullish.
The UK yields have fallen slightly yesterday but overall look bullish for the near term. The 5Yr (0.50%), 10yr (1.06%) and the 20YR (1.61%) are down from 0.552%, 1.111% and 1.655 respectively.
The German-US 2Yr (-1.93%) and the 10Yr (-1.94%) have broken above crucial resistances to move up sharply in the medium term. We will have to see if the resistance near 1.10 on Euro is able to bring down the yield spreads in the near term.
The Trade After The Fear Trade
The euro peaked early and faded as we anticipated in yesterday's IMT, we look at what's next. The euro was the top performer Monday while the Japanese yen lagged. Australia and New Zealand are on holiday Tuesday.There are currently 8 Premium Trades in progress; 4 in FX, 2 in indices and 2 in commodities.
The question we're asking ourselves now is whether the French election result was a one-day event or the start of something more durable. The close in EUR/USD was 1.0866, that's the best since November.
What's worrisome is that all the euro charts have eaten into the opening gaps. That's a technical red flag. It suggests a quick squeeze or a fast money trade rather than a sea change in sentiment. At the same time, some consolidation is normal.
Ultimately, the market is more political than it's been in a generation. At the moment, the political temperature is cooling off but it can shift quickly. Ignoring politics, the eurozone economy is showing some bright spots and EUR/USD is at a deeply depressed level. Like sterling, it won't take much to get it moving to the upside. Will the ECB and Eurozone CPI later magnify or break momentum?
The election is also a reminder of the factor that fear plays in trading. Markets are an amazing method of price discovery but add a bit of fear into the equation and prices quickly disconnect from reality. The current era of political shifts will lead to many bouts of fear and not all of them will be unjustified but if we look back at Brexit, Trump and the French election, the fears have been exaggerated at times in each case.
Oil Trickles Lower As Gold Recovers
Oil continued its downward grind overnight as gold recovered some of its losses as President Trump’s first 100-days draws to a close.
OIL
Oil continued its bullish unwind overnight, with both Brent and WTI spot contracts down just over 0.50%. Rising shale production and uncertainty over the OPEC deal extension being quoted as reasons for the fall. We continue to feel the primary cause is excessive short –term long positioning unwinding. In other words, the issues mentioned are known unknowns.
Nevertheless, in the bigger picture, both reasons are relevant. These should ensure any meaningful rallies in oil will be capped until the late May decision date.
Both Brent spot and WTI spot have closed opened in Asia near the previous session’s lows. Brent spot trades at 51.70 with support nearby at 51.30 and then its 200-day average at 50.80 followed by the 50.00 level. Resistance sits at 52.50 and 53.50.
WTI spot trades at 49.00, just above its 200-day average at 48.65, a break opening up a move to 47.00. Resistance sits at 50.00 and 51.00 a barrel.
GOLD
Gold recovered some of its post-election sell-off overnight to open roughly mid-range at 1278 this morning in Asia. With the election fading from memory rapidly the market now turns its attentions to President Trump’s legislative agenda.
Although news of a 15% corporate tax rate will no doubt be warmly received, the worries over a potential U.S. government shutdown seem to be taking precedence in traders’ minds. This has probably been gently supportive of gold overnight. We expect this issue to be more of a storm in a teacup given the soothing noises from Republican leaders this week.
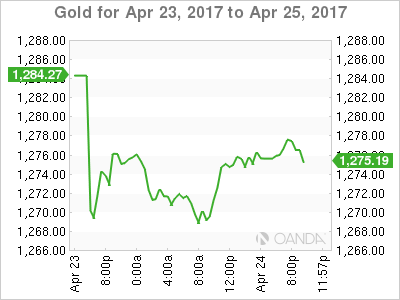
Gold itself, however, is still not a rosy picture technically with the potential of a decent downside correction if and when uncertainty fades. Gold has resistance at 1290 and then 1296, having failed in this area numerous times last week. Below, support lies at 1265.50 and then the 200-day average at 1254.80. A daily close below 1240 would signal a much larger correction could be on the way.
Calm Equals Risk On
Post-election Calm equals Risk on
Global equities rejoiced over the French election results overnight as Macron takes a step closer to investiture with the market considering him a lock for securing the French Presidency. With the market pricing in an amiable scenario for risk assets in the second round, investors should continue to feed off this.
But there remains a dark shadow hanging over the market as traders contended with the plethora of current and anticipated Trump headlines. In what is expected to be a huge week for the President, investor focus remains on international tensions with North Korea; the tax reform plan slated for this Wednesday, and a possible government shutdown entering weeks' end.
On currency markets, after yesterday's early morning moves most G-10, markets were entangled in a middling range trade overnight while EM FX outperformed on the back of the French election relief rally.
Australian Dollar
With the French election results hitting expectations, most G-10 reactions have been pretty tame overnight. Risk sentiment responded favorably, and with Iron ore off its lows, support above 75 should hold in the near term in this environment. However as US interest rates are eventually expected to rise and with the RBA sounding oh so dovish in the latest minutes, it's hard to envision any serious attempt at the topside .77 resistance level anytime soon.
While keeping an eye on the most recent risk headlines, local traders are turning their attention to tomorrow's national CPI which is expected to nudge up on higher energy prices.However, the chronically tepid core reading all but guarantees a sidelined RBA for 2017.
After the RBA highlighted domestic concerns in the latest minutes, a downside miss on this data could cause the AUD to dive as the market immediately priced in the potential for an outright dovish Governor Lowe.
Euro
Traders are in the midst of hatching their medium term Euro trades, and we've seen real demand for EUR crosses overnight. And while the Euro certainly has room to move higher interim, for the most part, dealers are waiting for the Fed and ECB to make the airways before re-engaging the EURUSD trade.
One could argue that with the election risk fading, the ECB will be afforded more wiggle for a more advancing policy stance but with global risk still fragile and European political risk still smoldering, the ECB will in all likeliness, reiterate their continued robust accommodation policies.
As for the upcoming FOMC, with so much priced out of the Fed policy, the only real surprise in my view, can be a more hawkish lean the market expects.
While the long EURUSD trade looks clear sailing, there are still the Central Banks to juggle so the no brainer EURO higher trade is far from a sure thing.
Japanese Yen
Post-French election calm is manifesting itself into a global risk rally that has the USDJPY well supported above 109 near term after it appeared to be basing below that level last week. Apparently, global equities are reveling in the election relief rally and provided risk momentum remains intact; this should continue to provide a near-term boost for USDJPY. However, I suspect the recent run of soft US economic data, lessening expectations for a Fed hike in June and East Asian geopolitical risk will continue to keep the USDJPY bulls level headed.
Spot Gold Prices Steady after French Election
Spot gold is unchanged in the Monday session. In North American trade, the price of one ounce gold is $1275.49. However, gold futures have lost ground as investors have dumped safe-haven assets following the first round of the French presidential election. On the release front, there are no economic indicators out of the US. On Tuesday, the US releases two key indicators - CB Consumer Confidence and New Home Sales.
Investors cheered the results of the French election on Sunday, which sent stock markets higher but weighed on gold futures. The first round featured 11 candidates, and the election whittled the field down to just 2 candidates - centrist Emmanuel Macron and far-right Marie Le Pen. Macron garnered 24% of the vote and Le Pen 22%, which was what most polls leading up to the election predicted. Investors breathed a sigh of relief, as the nightmarish scenario of a runoff between two extreme candidates, Marie Le Pen on the right and far-left candidate Jean-Luc Mélenchon, was averted. The runoff vote between Macron and Le Pen is slated for May 7, and French voters will have a clear choice between Macron, who served as an economic minister and is pro-business, and Le Pen, who is running on a populist, anti-EU platform.
With the US economy performing well, despite some recent hiccups, the markets are expecting interest rates to continue rising in 2017. The Fed has broadly hinted that it will gradually raise rates this year, but it's unclear how many times Janet Yellen will press the rate trigger. Most analysts are expecting two more moves this year, but there have been calls from some Fed policymakers for three more hikes. However, soft retail sales and CPI numbers in March are likely to make the Fed more dovish, and on Tuesday, the Atlanta and New York Federal Reserve lowered their outlook for US economic growth for the first quarter. The Fed can point to a labor market that is close to capacity as well as strong consumer confidence, but surprisingly, this has not translated into stronger consumer spending, a key driver of economic growth. The Fed is unlikely to make a move in May, but June is a strong possibility. However, the odds of a June move are showing a surprising amount of volatility, and the latest CME Group reading shows the likelihood a 1/4 point hike have jumped to 58%, up from 51% earlier this week.
Elliott Wave Trade Ideas Performance Update
We bought sterling against yen early last week at 139.10 and although the pair did rise again to 140.35, as the pair then retreated again, we exited the position with small profit at 139.55, however, the pound found renewed buying interest at 139.20 and rallied in line with our bullish expectations and jumped to as high as 142.10 today (exceeded our upside target).
We entered a long position in USD/CAD at 1.3430 and a short position in EUR/GBP at 0.8475 and both positions are still holding at the moment.
No position was entered among other currency pairs.
In short, 3 positions were entered with total profit of 45 points and the positions are listed below.
20 Apr : GBP/JPY - Long at 139.10, exited at 139.55 (+ 45 points)
24 Apr : USD/CAD - Long ar 1.3430,
24 Apr : EUR/GBP - Short at 0.8475,
| AUD EUR/JPY EUR/GBP CAD GBP GBPJPY
Jan - 15 -275 - 35 -120
Feb + 140 -17 - 40 +11
Mar - 20 +115 +132 - 19
Apr + 30 - 40 + 45
May
Jun
Jul
Aug
Sep
Oct
Nov
Dec
Y-T-D + 135 - 177 + 57 - 2 +45
Candlesticks and Ichimoku Trade Ideas Performance Update
After seeing the rebound from 108.13 to 109.22 early last week, we took the view that a temporary low has been formed at 108.13 and bought the pair at 108.45, dollar did find renewed buying interest at 108.32 and has rallied in line with our bullish expectation, our upside target at 109.45 was met (with 100 points profit) as dollar rose to as high as 109.50 on Friday.
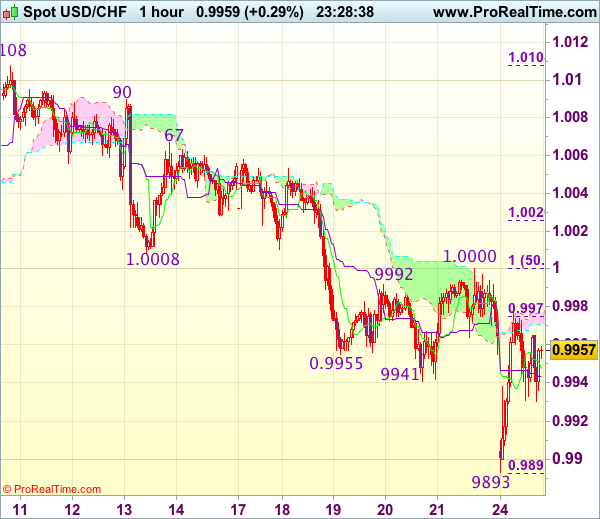
We sold dollar against Swiss franc last week after seeing the break of 1.0008 and a short position was entered at 1.0000, however, as dollar found support at 0.9941 and recovered, we exited the position at 0.9950 as we saw a possible risk of another rebound, price then bounced back to 1.0000 before dropping again earlier today to a low as 0.9893.
A long position was entered in EUR/USD at 1.0690 late Friday, the single currency found renewed buying interest at 1.0682 and rallied from there accordingly, the pair opened sharply higher today and largely exceeded our upside target at 1.0790 as price surged to as high as 1.0936.
In short, 3 positions were entered among all 4 currency pairs with total profit of 250 points and the positions are listed below:
19 Apr : USD/JPY - Long at 108.45, exited at 109.45 (+ 100 points)
19 Apr : USD/CHF - Short at 1.0000, exited at 0.9950 (+ 50 points)
21 Apr : EUR/USD - Long at 1.0690, exited at 1.0790 (+ 100 points)
| JPY EUR CHF GBP
Jan + 167 - 85 - 10 + 50
Feb + 200 +150 +93 - 59
Mar -23 -70 -23 - 35
Apr + 65 + 90 + 50 - 40
May
Jun
Jul
Aug
Sep
Oct
Nov
Dec
Y-T-D + 408 + 80 +110 -84
Trade Idea Wrap-up: USD/CHF – Stand aside
USD/CHF - 0.9957
Most recent candlesticks pattern : N/A
Trend : Near term down
Tenkan-Sen level : 0.9948
Kijun-Sen level : 0.9944
Ichimoku cloud top : 0.9977
Ichimoku cloud bottom : 0.9971
New strategy :
Stand aside
Position : -
Target : -
Stop : -
The greenback met renewed selling interest at 1.0000 on Friday and dropped again to as low as 0.9893 earlier today, having said that, the subsequent rebound from there suggests consolidation above this level would be seen and another bounce to 0.9980-85 cannot be ruled out, however, reckon 1.0000 (said resistance and 50% Fibonacci retracement of 1.0108-0.9893) would limit upside and bring another decline later. Below said support at 0.9893 would extend the fall from 1.0108 top to 0.9865-70 (2 times extension of 1.0108-1.0008 measuring from 1.0067) but support at 0.9831 would hold, bring rebound later.
In view of this, would be prudent to stand aside in the meantime. Above previous support at 1.0008 would suggest low is formed instead, bring rebound to 1.0025-30 (61.8% Fibonacci retracement of 1.0108-0.9893) but price should falter below resistance at 1.0067.
Trade Idea Wrap-up: GBP/USD – Buy at 1.2710
GBP/USD - 1.2784
Most recent candlesticks pattern : N/A
Trend : Near term up
Tenkan-Sen level : 1.2803
Kijun-Sen level : 1.2812
Ichimoku cloud top : 1.2808
Ichimoku cloud bottom : 1.2799
Original strategy :
Buy at 1.2710, Target: 1.2850, Stop: 1.2675
Position : -
Target : -
Stop : -
New strategy :
Buy at 1.2710, Target: 1.2850, Stop: 1.2675
Position : -
Target : -
Stop : -
Although cable recovered initially to 1.2858, as price has retreated again again after faltering below resistance at 1.2859, suggesting further consolidation would be seen and another test of Friday’s low at 1.2757 cannot be ruled out, however, reckon downside should be limited to 1.2700-10 (50% Fibonacci retracement of 1.2515-1.2906) and bring another rally, break of 1.2759 would signal the pullback from 1.2906 has ended, bring retest of this level, break there would extend recent upmove to 1.2920-30 (2 times extension of 1.2365-1.2575 measuring from 1.2500), then 1.2950 but loss of near term upward momentum should prevent sharp move beyond 1.2990-00 (1.236 times projection of 1.2109-1.2616 measuring from 1.2365 and psychological resistance).
In view of this, would not chase this rise here and would be prudent to buy cable on subsequent pullback as downside should be limited to 1.2710 (50% Fibonacci retracement of 1.2515-1.2906), bring another rise. Below 1.2700 would defer and signal top has been formed, risk correction to 1.2660-65 (61.8% Fibonacci retracement of 1.2515-1.2906) and price should stay well above 1.2608-16 (previous resistance now support).