
Sample Category Title
Trade Idea Wrap-up: EUR/USD – Stand aside
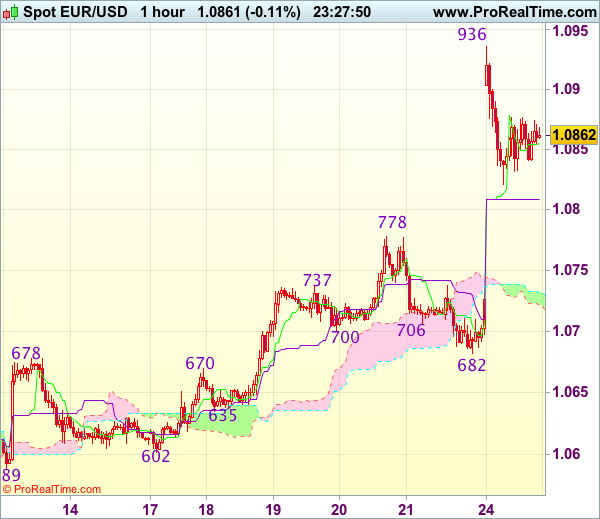
EUR/USD - 1.0863
Most recent candlesticks pattern : N/A
Trend : Near term up
Tenkan-Sen level : 1.0855
Kijun-Sen level : 1.0809
Ichimoku cloud top : 1.0732
Ichimoku cloud bottom : 1.0722
New strategy :
Stand aside
Position : -
Target : -
Stop : -
The single currency did find renewed buying interest at 1.0682 (we recommended to buy at 1.0690 and a long position was entered there) and the pair opened sharply higher today, indicated upside target at 1.0790 was met as price surged to as high as 1.0936 before retreating, suggesting consolidation below this level would be seen and pullback to the Kijun-Sen (now at 1.0809) cannot be ruled out, however, reckon previous resistance at 1.0778 would contain downside and bring another rise later. Above 1.0900-05 would bring retest of 1.0936 but break there is needed to extend recent rise to 1.0975-80 and possibly towards 1.1000.
In view of this, would not chase this rise here and would be prudent to stand aside in the meantime. Below previous resistance at 1.0778 (now support) would defer and risk weakness to the Ichimoku cloud (now at 1.0733-39) but support at 1.0682 should remain intact, bring rebound later.
Trade Idea Wrap-up: USD/JPY – Buy at 109.30
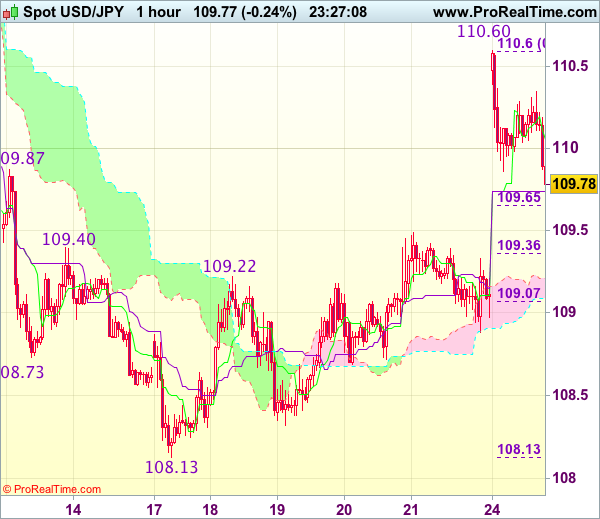
USD/JPY - 109.78
Most recent candlesticks pattern : N/A
Trend : Near term up
Tenkan-Sen level : 110.06
Kijun-Sen level : 109.74
Ichimoku cloud top : 109.21
Ichimoku cloud bottom : 109.09
Original strategy :
Buy at 109.50, Target: 110.50, Stop: 109.15
Position : -
Target : -
Stop : -
New strategy :
Buy at 109.30, Target: 110.30, Stop: 108.95
Position : -
Target : -
Stop : -
Although the greenback opened higher today and rallied to as high as 110.60, the subsequent retreat suggests consolidation below this level would be seen and pullback to 109.60-65 (38.2% Fibonacci retracement of 108.13-110.60) cannot be ruled out, however, reckon 109.30-35 (approx. 50% Fibonacci retracement) would limit downside and bring another rise later, above 110.35 would signal the pullback from 110.60 has ended, bring retest of this level first. Looking ahead, above 110.60 would extend recent upmove to 111.00 but overbought condition should limit upside and price should falter well below resistance at 111.58.
In view of this, would not chase this rise here and would be prudent to buy dollar again on further pullback as 109.30-35 should limit downside. Below the upper Kumo (now at 109.20) would suggest an intra-day top is formed, bring weakness to the lower Kumo (now at 109.09) but break of support at 108.88 is needed to confirm.
Trade Idea: EUR/GBP – Hold short entered at 0.8475
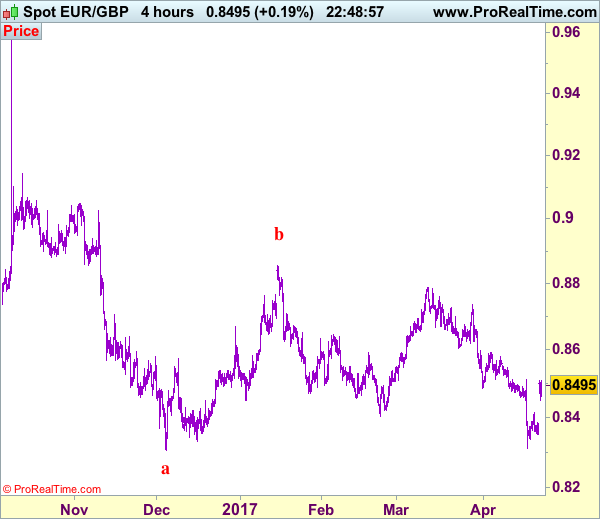
EUR/GBP - 0.8495
Recent wave: Major double three (A)-(B)-(C)-(X)-(A)-(B)-(C) is unfolding and 2nd (A) has possibly ended at 0.6936.
Trend: Near term down
Original strategy :
Sold at 0.8475, Target: 0.8325, Stop: 0.8515
Position : - Short at 0.8475
Target : - 0.8325
Stop : - 0.8515
New strategy :
Hold short entered at 0.8475, Target: 0.8325, Stop: 0.8515
Position : - Short at 0.8475
Target : - 0.8325
Stop : - 0.8515
The single currency opened higher today and has maintained a firm undertone, dampening our bearishness but as long as resistance at 0.8512 holds, prospect of another retreat remains, below 0.8450 would bring weakness to 0.8420, then 0.8400 but break of support at 0.8350-55 is needed to signal the rebound from 0.8312 (last week’s low has ended, bring retest of this level later.
In view of this, we are holding on to our short position entered at 0.8475. Only above indicated previous resistance at 0.8512 would abort and signal a temporary low is formed instead, risk a stronger rebound to 0.8545-50 but resistance at 0.8580 should remain intact.
Our preferred count is that, after forming a major top at 0.9805 (wave V), (A)-(B)-(C) correction is unfolding with (A) leg ended at 0.8400 (A: 0.8637, B: 0.9491 and 5-waver C ended at 0.8400. Wave (B) has ended at 0.9413 and impulsive wave (C) has either ended at 0.8067 or may extend one more fall to 0.8000 before prospect of another rally. Current breach of indicated resistance at 0.9043 confirms our view that the (C) leg has ended and bring stronger rebound towards 0.9150/54, then towards 0.9240/50.
Trade Idea: USD/CAD – Hold long entered at 1.3430
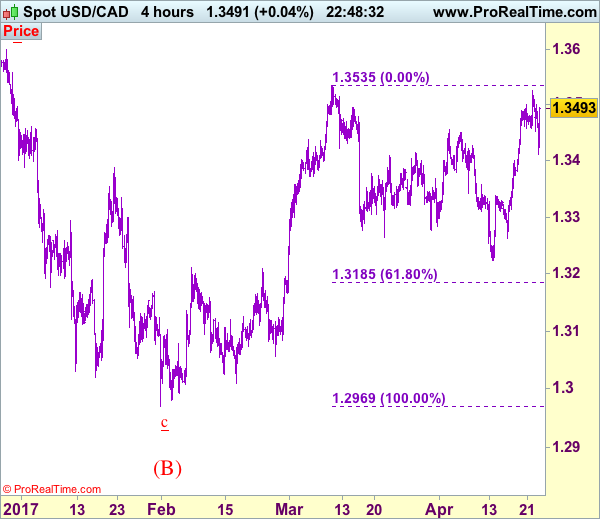
USD/CAD - 1.3493
Recent wave: Only wave v of c has ended at 0.9407 and wave C of major A-B-C correction is underway for headway to 1.4700
Trend: Near term up
Original strategy :
Bought at 1.3430, Target: 1.3590, Stop: 1.3370
Position: - Long at 1.3430
Target: - 1.3590
Stop: - 1.3370
New strategy :
Hold long entered at 1.3430, Target: 1.3590, Stop: 1.3410
Position: - Long at 1.3430
Target: - 1.3590
Stop:- 1.3410
Although the greenback retreated after rising to 1.3526 on Friday, as renewed buying interest emerged at 1.3411 and has rebounded again, retaining our bullishness for recent rise from 1.2969 to resume after consolidation, above said resistance at 1.3526 would bring retest of 1.3535, break there would extend the rise from 1.3223 towards previous chart resistance at 1.3599 later which is likely to hold from here.
In view of this, we are holding on to our long position entered at 1.3430. Below said support at 1.3411 would deepen our bullishness but only break of previous resistance at 1.3337 would abort and suggest top is possibly formed, risk weakness to 1.3300-10 but indicated support at 1.3262 should remain intact.
To recap, wave B from 1.3066 is unfolding as an a-b-c and is sub-divided as a: 1.2192, b: 1.2716 and wave c is a 5-waver with i: 1.1983, ii: 1.2506, extended wave iii with minor iii at 1.0206, wave iv ended at 1.0781 and wave v as well as wave iii has ended at 0.9931, hence the subsequent choppy trading is the wave iv which is unfolding as (a)-(b)-(c) with (a) leg of iv ended at 1.0854, followed by (b) leg at 1.0108 and (c) leg as well as the wave iv ended at 1.0674. The wave v is sub-divided by minor wave (i): 0.9980, (ii): 1.0374, (iii): 0.9446, (iv): 0.9913 and (v) as well as v has possibly ended at 0.9407, therefore, consolidation with upside bias is seen for major correction, indicated target at 1.3700 and 1.4000 had been met and further gain to 1.4700 would be seen later.
ECB Preview: ECB on Autopilot With its Monetary Policy
We expect a slightly dovish tone from Mario Draghi at this week's ECB meeting, as the main message should be that the ECB is on autopilot with its current monetary policy. Draghi has recently said 'a reassessment of the current monetary policy stance is not warranted at this stage' and we expect himto reiterate this, which should be perceived as dovish. Following the latest ECB meeting, speculation about the sequencing of the ECB's exit from the very accommodative monetary policy increased and a month ago the market priced a 10bp deposit rate hike this year. Now the pricing of the hike has been postponed to late 2018, after prominent ECB members expressed a dovish view, thereby dampening market participants' expectations. In our view, the recent dovish tone reflects the ECB's perception of the pricing of hikes as a tightening of the financial conditions, which it considered as unwarranted.
Despite the expected dovish communication at the upcoming meeting, we believe the ECB could change its forward guidance on policy rates at the meeting in June. However, there is a risk that the ECB will also take a more cautious approach at the meeting in June, as Draghi has recently said 'Before making any alterations to the components of our stance – interest rates, asset purchases and forward guidance – we still need to build suf ficient confidence that inflation will indeed converge to our aim'. We still believe the ECB will announce an extension of its EUR60bn monthly QE purchases at the September meeting and hence continue the purchase programme in 2018.
Reassessing the current monetary policy stance is not warranted
We still expect ECB to continue QE in 2018 Inflation expectations at QE announced levels Reassessing the current monetary policy stance is not warranted Recently, Draghi communicated that the ECB has not yet seen sufficient evidence to alter materially the assessment of the inflation outlook and related to this, the ECB has continually said there are no signs yet of a convincing upward trend in underlying inflation.
In the minutes from the latest ECB meeting, it was said that the linchpin for higher underlying inflation was a turnaround in wage dynamics. In our view, the ECB is very optimistic in its wage growth projection and with a lowering of the forecast we expect the ECB to announce an extension of QE purchases into 2018.
Low core inflation as long as wage growth stays low
The ECB usually forecasts higher core inflation
The ECB dampened the market's speculation on rate hikes
Core inflation is set to stay low this year
The ECB dampened the market's speculation on rate hikes The hawkish message at the latest ECB meeting resulted in the market pricing in a 10bp deposit rate hike at the end of this year. This then resulted in prominent ECB members dampening market participants' expectations with a dovish communication that postponed the pricing of the hike to late 2018.
In our view, the pricing of hikes from ECB is very premature as the inflation outlook should not be strong enough to tighten the monetary policy this year. Another argument for hiking rates could be that banks were suffering after the long period of negative policy rate but it does not seem to be the case that the ECB wants to hike just to support the banking sector.
German banks are mainly paying for ECB's negative deposit rate
Not clear that banks need support from the ECB hiking rates
Speculation that the ECB will address the repo issues
The ECB focuses on the repo issues
At the latest ECB meeting in March, Draghi said the ECB was monitoring distortions on the very short-end German yield curve and last week, the ECB published a survey on credit terms and conditions in eurodenominated securities, which said that 'the liquidity and functioning of markets for the underlying collateral… deteriorated, on balance, for nearly all types of eurodenominated collateral, although the deterioration was most pronounced for government bonds'.
This fuelled speculation that the ECB could address the repo issues at its upcoming meetings, for instance by lending out more of the collateral held by the eurosystem and/or easing the conditions.
ECB's purchase pattern one of the forces behind the repo issues
Yen Unchanged, Markets Eye BOJ Rate Statement
USD/JPY has started the week quietly, as the pair trades at the 110 level in Monday's North American session. On the release front, there are no US economic releases. Later in the day, Japan will publish SPPI, which measures inflation in the corporate sector. The US will release two key indicators on Tuesday – CB Consumer Confidence and New Home Sales.
The Bank of Japan will release its monetary policy statement on Wednesday, and is expected to maintain interest rates at -0.10%. The negative rates are part of the BoJ's ultra-loose monetary policy, which is expected to continue until inflation levels move closer to the central bank's target of around 2 percent. Japan's economy has improved in recent months, as a weak yen and stronger global demand have boosted exports and boosted the manufacturing sector. However, Japanese policymakers need to tread carefully, as Japan's trade surplus has triggered sharp criticism from the US President Trump. The weak yen has also drawn Trump's ire, as he recently called out Japan for manipulating its currency for trade purposes. Still, the most recent US Treasury Currency Report, did not name Japan as a currency manipulator. If the yen weakens and heads back towards the 120 level, the Japanese are likely to get an earful from Trump about unfair trade practices.
What's next for Janet Yellen and Co.? The Federal Reserve has broadly hinted that it will gradually raise rates in 2017, but it's unclear how many times Janet Yellen will press the rate trigger. Most analysts are expecting two more moves this year, but there have been calls from some Fed policymakers for three more hikes. However, soft retail sales and CPI numbers in March have made the Fed more dovish, and on Tuesday, the Atlanta and New York Federal Reserve lowered their outlook for US economic growth for the first quarter. The Fed can point to a labor market that is close to capacity as well as strong consumer confidence, but surprisingly, this has not translated into stronger consumer spending, a key driver of economic growth. Will the Fed raise rates in June? The CME Group shows the odds of a June hike have dropped to 50%, compared to 64% earlier in April.
Currencies: Euro Jumps, But No Follow-through Gains
Headlines
European equities gain 2% to 3% as markets welcome the second round French presidential run-off between Macron and Le Pen. The French CAC40 outperformed (+4.5%). US stock markets profit from risk-on sentiment, opening around 1% higher.
German business sentiment rose to the strongest level in almost six years. The IFO-indicator increased to 112.9 in April from a revised 112.4 in March while consensus expected a stabilization. A forward looking gauge of expectations fell to 105.2 from 105.7 though.
UK manufacturers were hit by a dip in orders this month suggesting the shine may be coming off a sector that has been given a boost from sterling weakness. The CBI's latest health check of the sector reported a slight dip in total new orders in April to a balance of +4, lower than a forecast of +5 and declining from +8 in March.
Greece's primary budget surplus - which measures the country's public finances when excluding debt repayments - hit 4.2% last year, swinging dramatically from a deficit and far outperforming a creditor target of 0.5% for 2016.
Donald Trump has ratcheted up tensions in East Asia via hastily scheduled calls to the leaders of China and Japan, as fears simmer about a looming crisis over North Korea. The timing suggests Mr Trump is preparing a response in case Pyongyang conducts a new nuclear test, amid speculation such a move could come as early as Tuesday.
Rates
Macron-Le Pen run-off triggers relief rally
European markets opened relieved this morning as the first round of the French presidential elections produced a run-off between centrist Macron and extreme-right candidate Le Pen. Macron is expected to gain a landslide victory on May 7. Core bonds lost ground, the single currency profited, equities marched more than 3% higher and peripheral spreads narrowed significantly. Trading shifted into lower gear after the repositioning (no longer discounting Frexit risk) in the opening with a lot of sideways action. German IFO business climate improved more than expected, but the forward looking "expectations" component disappointed. Markets ignored the release.
At the time of writing, the German yield curve trades 9.9 bps (10-yr) to 12.1 bps (30-yr) higher. Technically, the German 10-yr yield bounced off key support and trades back in the 0.2%-0.5% sideways range. Changes on the US yield curve vary between +4 bps (30-yr) and +6.3 bps (2-yr). Both the 5-yr yield (1.8%) and the 10-yr yield (2.3%) regained lost support levels. Upcoming supply and Trump's promise to unveil his tax reform plan in the second half of the week pushed affected US yields together with spill-over effects. On intra-EMU bond markets, 10-yr yield spread changes versus Germany narrowed 18 bps for France versus 11 bps for Belgium. Peripheral spreads declined by 14 bps to 30 bps. Italian BTP's didn't suffer from Friday's rating downgrade by Fitch (BBB; stable) or upcoming supply (Thursday). Core spreads dropped 4 to 5 bps.
The Belgian debt agency tapped the on the run 7-yr OLO 79 (€0.9B 0.2% Oct2023) and 10-yr OLO 81 (€1.6B 0.8% Jun2027) for a combined €2.5B, the maximum of the amount on offer. The auction bid cover was solid at 1.59. The debt agency now completed 53% of this year's OLO funding need (€35B).
Currencies
Euro jumps, but no follow-through gains
(European) markets succeeded a one-off risk-on repositioning after the marketfriendly outcome of the French presidential election. EUR/USD and USD/JPY started the session with good gains compared to Friday's close. However, both cross rates almost immediately found a new ST equilibrium and held tight ranges for the remainder of the session. EUR/USD holds close to the 1.0850 pivot. USD/JPY is drifting sideways in the low 110 area.
Overnight, a pro-Europe risk-on trade started after the market-friendly outcome of the French presidential election. Equities, core yields and the euro jumped higher early in Asia. The safe haven yen was sold. However, except for Japan, most regional equities lost a big part of the early gains. China even showed substantial losses. EUR/USD jumped temporary north of 1.09, but returned to the 1.0865 area at the start in Europe. A similar reaction occurred in USD/JPY with the pair changing in hands in the low 110 area.
European investors evidently also adapted positions in the wake of the French election. German bond yields rose up to 10 bps and European equities jumped sharply higher with the CAC rising more than 4%. The FX market found some kind of short-term equilibrium after the initial uptick in EUR/USD and USD/JPY overnight. The interest rate differentials between the US and Europe narrowed a few bps at the start of trading, but the changes were modest (about 5 bps). EUR/USD settled in a tight range close to and mostly slightly above 1.0850. USD/JPY hovered sideways in the low 110 area. So, there was no follow-through price action on the overnight FX moves. The German IFO business confidence was slightly stronger than expected, but without impact on the major FX cross rates.
US markets joined the risk-on rebound from Europe, but the price swings in the dollar remained very limited. EUR/USD is trading in the 1.0865/70 area and USD/JPY is changing hands at around 110.20. At least for now, the election is no game-changer for trading in the major USD cross rates.
EUR/GBP off the recent lows on euro strength
Sterling trading was also mostly driven by the impact of the French election result on global markets. The euro jumped higher across the board. EUR/GBP filled offers north of 0.85 early in Asia and the 0.85 level was revisited at the start in Europe. The EUR/GBP rally stalled, as was the case for EUR/USD, and the pair settled in a relatively tight range in the upper half of the 0.84 big figure. The price swings in cable were very limited. The pair hovered around the 1.28 pivot, showing no real directional trend. The CBI total orders trends printed slightly softer than expected at 4 (from 8 on March). The report suggests a further softening of growth at the start of Q2, but the impact on sterling trading is limited. EUR/GBP is currently trading in the 0.8495/0.85 area. Cable drifted back south of 1.28 (currently 1.2785). There is still no clear story for sterling trading. However, key support around 0.83 looks safe for now thanks to the euro rally.
Elliott Wave Analysis: EURCAD Trading In Final Wave Five; A Reversal May Be Near
EURCAD may have just found a base of wave iv) around the 1.4560 region, from where a sharp bounce followed. This bounce may now be sub-wave v) of five, with still more upside to go. But beware, we are following a five wave impulse to the upside, and next reversal may unfold as a higher degree three wave decline.
EURCAD, 1H
Summary of the French Election Results
As widely expected, the French presidential elections were broadly in line with what pre-election polls suggested. Emmanuel Macron, leader of the new centrist and pro-EU En Marche! party, came out on top, earning an estimated 23.7% of first-round votes. His opponent in the runoff vote will be Marine Le Pen, leader of the far-right, anti-EU/euro Front Nationale party, who earned 21.7% of the popular vote.
The election outcome is a blow to France's established political order. Yesterday's election was the first time that neither of the two mainstream parties of the left and right had made it to the second round of voting in almost 60 years.
Market reaction was swift, with the euro appreciating just under 2% against the U.S. dollar in the immediate aftermath of the vote, but has since given up more than a quarter of that gain. The spread between French and German bunds have eased, and French equities (CAC 40 Index) have surged more than 4% at the time of writing.
Attention now turns to the second round of voting, set for May 7th 2017, for which pre-election polls have been consistently suggesting a Macron victory by a wide margin (Macron, 64% vs. Le Pen, 37%).
Key Implications
With the chance of a populist run-off election between parties on the far left and far right no longer in the cards and low odds of anti-euro and EU candidate Le Pen beating Macron in the second round of voting, markets have responded by pricing in the firming economic recovery in the Eurozone. Stronger economic growth in the Eurozone implies continued absorption of economic slack, and is likely leading the ECB to contemplate removing rather than enhancing monetary accommodation in the next 12 months, barring any shock that would negatively affect its inflation outlook.
With Macron's victory there is a low risk of France exiting the EU and euro. Nonetheless, the French elections remain the greatest risk to our French economic outlook. While Macron may win the Presidency, his party will have to win a lot of support in the legislative elections set for June 11 and 18th in order to secure a strong mandate. A failure to do so would partly handcuff Macron, reducing his ability to pursue what is broadly seen as a pro-business, reform agenda over his mandate.
CAC Surges as Macron and Le Pen Advance to Round 2
The CAC soared on the weekend, boosted by the results of the first round of the presidential election. The outcome showed Emmanuel Macron and Marine Le Pen advancing to the second round. The CAC is currently trading at 5291.50, up 4.7 percent since the Friday close. The rally was led by financial stocks as BNP Paribas jumped 8.45 percent, while Societe Generale climbed 9.54 percent. On the release front, there are no key French releases on the schedule. In Germany, Ifo Business Climate improved to 112.9, beating the forecast of 112.4 points.
Eurozone releases started the week on a strong note, as German business confidence levels continue to improve. Ifo Business Climate climbed to 112.9 in April, up for 112.3 a month earlier. This marked its highest level since July 2011. This excellent reading underscores a strong German economy, which has been the locomotive pulling the eurozone, which has showed stronger growth in the first quarter. Germany releases consumer confidence and Preliminary CPI on Thursday.
Stock markets across Europe cheered the French election results, pushing the euro and stocks higher over the weekend. The best news was what didn't happen in the first round, as the nightmarish scenario of a runoff between Le Pen and far-Left candidate Jean-Luc Mélenchon was averted. The first round featured 11 candidates, and the election whittled the field down to just 2 candidates - centrist Emmanuel Macron and far-right Marie Le Pen. Macron garnered 24% of the vote and Le Pen 22%, which was what most polls leading up to the election predicted. The runoff vote takes place on May 7 and French voters will have a clear choice between Macron, who served as an economic minister and is pro-business, and Le Pen, who is running on a populist, anti-EU platform. We can expect daily opinion polls to be market-movers, as was the case before the first round. Macron goes into next week's vote as a heavy favorite, and two candidates in the first round have thrown their support behind Macron - center right François Fillon and Socialist Benoit Hamon.
With the US economy performing well, despite some recent hiccups, the markets are expecting interest rates to continue rising in 2017. The Fed has broadly hinted that it will gradually raise rates this year, but it's unclear how many times Janet Yellen will press the rate trigger. Most analysts are expecting two more moves this year, but there have been calls from some Fed policymakers for three more hikes. However, soft retail sales and CPI numbers in March are likely to make the Fed more dovish, and on Tuesday, the Atlanta and New York Federal Reserve lowered their outlook for US economic growth for the first quarter. The Fed can point to a labor market that is close to capacity as well as strong consumer confidence, but surprisingly, this has not translated into stronger consumer spending, a key driver of economic growth. The Fed is unlikely to make a move in May, but June is a strong possibility. However, the odds of a June move are showing a surprising amount of volatility, and the latest CME Group reading shows the likelihood a 1/4 point hike have jumped to 58%, up from 51% earlier this week.