
Sample Category Title
Market Update – European Session: The French Presidential Election And Solidified His Prospects Of Becoming The Country’s Next Leader
Mid-Market Update: Relief rally as Macron won the 1st round voting in the French presidential election and solidified his prospects of becoming the country's next leader
Notes/Observations
France Presidential election moves to the 2nd round with Macron (Centrist) faces Le Pen (Far Right) settting the stage for a runoff that would pit Globalism vs. Nationalism
Relief rally underway as Macron solidified his prospects of becoming the country's next leader
German Apr IFO Business Climate Survey beats expectations to highest level since summer 2011 (112.9 v 112.4e)
Overnight/Weekend:
France Election Results:
Macron 23.75%; Le Pen 21.53% (both move onto 2nd round that held on Sunday, May 7th)
Macron:
Will seek to build Parliament majority as soon as Monday (Apr 24th)
Wants to relaunch European project and break with a system unable to address France's problems
Have changed French politics over the course of one year
Le Pen:
Election result is historical
Time to free French people from the arrogant elite
Calls on all patriots to back her as survival of France is at stake
Fillon:
Conceded defeat
Will vote for Macron and Le Pen would lead to failure of France
Melenchon:
Will not endorse any candidate for 2nd round
Asia:
PBOC Gov Zhou: China's 2017 GDP target is "within reach"; Financial risks were under control. Reiterated PBoC to keep pursuing a prudent and neutral monetary policy.
China Fin Min Xiao Jie: confident in reaching GDP target as global economic recovery and market sentiment were improving
China President Xi reiterates his call on all sides to exercise restraint on North Korea during a recent phone conversation with President Trump. Hoped all sides avoid doing anything to worsen tense situation on Korean peninsula
Japan Fin MIn Aso: Trade imbalances could not be fixed through FX adjustments alone. Unclear what immediate results would be from US/Japan dialogue talks, possible some results on energy and train infrastructure but no guarantees for US in any bilateral deal with Japan
Europe:
ECB's Nowotny (Austria): Any change to policy will be considered in H2. Have decided on its interest rate and bond purchases for the remainder of the year; Any changes to its policy path beyond 2017 will be considered in H2
EU to tighten guidance on Brexit bill, guidelines expected to be finalized during week of Apr 24th
IMF Members Steering Committee Statement said to exclude anti-protectionism pledge, adopted G20 language on trade. Members pledged to refrain from competitive devaluations; would not target exchange rates for competitive purposes
Germany Fin Min Schaeuble: board consensus has not changed at G20 meeting in Washington
Greece Fin Min Tsakalotossaid to be aiming for Eurogroup Finance Ministers to sign off on staff-level agreement of 2nd review of current bailout program at upcoming May 22 meeting - Fitch cuts Italy sovereign rating one notch to BBB from BBB+; outlook Stable from Negative; cites fiscal slippage and weak bank sector
Americas:
Office Management & Budget (OMB) Director Mulvaney: a short-term stopgap funding bill is more likely than a govt shutdown. White House will offer specific governing principles for its tax plans this week together with indications of what new rates would be but complete proposal won't be ready till June
Energy:
Weekly Baker Hughes US Rig Count: 857 v 847 w/w (+1.2%) (14th straight weekly rise)
Economic Data
(SG) Singapore Mar CPI M/M: 0.0% v 0.0%e; Y/Y: 0.7% v 0.7%e; CPI Core Y/Y: 1.2% v 1.2%e
(CZ) Czech Apr Business Confidence: 14.3 v 13.1 prior; Consumer Confidence: 6.0 v 6.3 prior
(TW) Taiwan Mar Industrial Production Y/Y: 3.2% v 6.0%e
(DE) Germany Apr IFO Business Climate: 112.9 v 112.4e (highest since July 2011); Current Assessment: 121.1 v 119.2, Expectations Survey: 105.2 v 105.9e
Fixed Income Issuance:
(PH) Philippines sold total PHP15B vs. PHP 15B indicated in 3-month, 6-month and 12-month Bills
(KR) South Korea Central Bank sold KRW900B v KRW 900B indicated in 3-month Monetary Stabilization Bonds (SMB); Avg yield: 1.34% v 1.34% prior
(NO) Norway sold NOK3.0B vs. NOK3.0B indicated in 6-month Bills;Avg Yield: 0.47% v 0.50% prior; Bid-to-cover: 3.55x v 2.15x prior
SPEAKERS/FIXED INCOME/FX/COMMODITIES/ERRATUM
Index snapshot (as of 10:00 GMT)
Indices [Stoxx50 +3.9% at 3,579, FTSE +1.9% at 7,246, DAX +2.9% at 12,394, CAC-40 +4.6% at 5,292, IBEX-35 +3.4% at 10,730, FTSE MIB +4.0% at 20,530, SMI +1.5% at 8,684, S&P 500 Futures +1.1%]
Market Focal Points/Key Themes: European equity indices are trading sharply higher as risk-on prevails after the first round of French elections showed Macron the front runner to be the next French President; Banking stocks trading sharply higher as a result with French banks SocGen and BNP Paribas leading the gains in large volume in the Eurostoxx; CAC 40 outperforming the board as a result; shares of LafargeHolcim the one notable laggard in the index after announcing executive changes; Banking shares Barclays and Standard Chartered leading the gains in the FTSE 100; energy, commodity and mining stocks also trading higher as copper and oil prices trade higher intraday; German IFO results beating consensus expectations adding to risk-on sentiment.
Upcoming scheduled US earnings (pre-market) include Halliburton, Hasbro, Illinois Tool Works, Kimberly-Clark, Lennox International, Nustar Energy, Precision Drilling, and TCF Financial.
Equities (as of 09:50 GMT)
Consumer Discretionary: [Jimmy Choo CHOO.UK +9.8% (to conduct review of strategic alternatives)]
Financials: [Kennedy Wilson Europe Real Estate KWE.UK +13.8% (Agrees on recommended all-share combination transaction with Kennedy-Wilson Holdings)]
Healthcare: [Koninklijke Philips PHIA.NL +3.2% (Q1 results), UCB UCB.BE -2.9% (Q1 sales)]
Industrials: [Anglo American AAL.UK +1.9% (Q1 production), Syngenta SYNN.CH +0.7% (Q1 sales)]
Materials: [LafargeHolcim LHN.CH -0.6% (confirms executive changes)]
Technology: [Computacenter CCC.UK +7.5% (Q1 sales), First Derivatives FDP.UK +1.8% (trading update)]
Telecom: [Tele2 TEL2B.SE +7.1% (Q1 results)]
Speakers
BoE's Hogg will leave central bank at end of week
German IFO Economists noted that the domestic economy was growing strongly. Brexit was not an issue pre-occupying German business at this time. Dip in Expectation Survey mainly due to industrial sector but did not signify change in sentiment in overall economy
Turkey Econ Min Zeybekci noted there were no expectations of Cabinet changes in the short term. GDP must growth at 4.5% to keep unemployment rate constant
Russia 1st Dep PM Shuvalov: Any decisions on taxes will not go into effect before 2019
Currencies
Risk appetite was the session's theme as there were no surprises in the French 1st round Presidential election. Centrist Emmanuel Macron and far-right politician Marine Le Pen now move on to a May 7th run-off vote that pits Globalism vs. Nationalism. Macron thus solidified his prospects of becoming the country's next leader. Macron has led in poll by approx. 20 points in recent weeks and thus offered encouragement for the EU
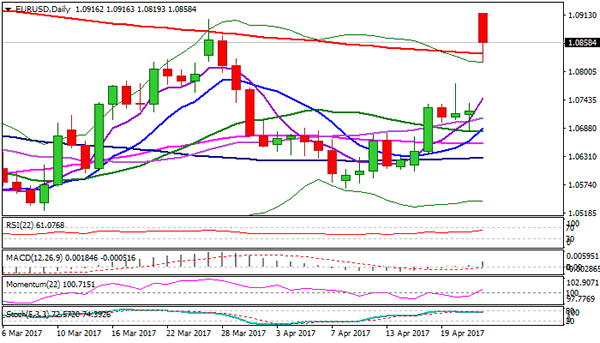
The EUR/USD surged to a 5-month high during Asia to test 1.0933 as the French Presidential results likely produced the most market-friendly outcome,. Euro zone money markets saw more chance of ECB hike in early 2018 after French vote
USD/JPY benefitted from the risk-on environment to hold abovce the 110 level in the session
Fixed Income
Bund futures trade at 161.20 down 156 ticks falling sharply following the French election results which provided no surprises as well as strong IFO readings out of Germany. A break of 160.93 lows targets 160.72 followed by 160.15. Resistance moves to 162.52 gap fill followed by 162.94.
Gilt futures trade at 127.83 down 91 ticks falling on risk on flows with continued downside targeting 127.70. A reversal eyes 128.81 followed by 129.14. Short Sterling futures trade down 1 to 4bp across the curve in steepening trade with Jun17Jun18 steepening 3bp to 12.5/13bp.
Monday's liquidity report showed Friday's excess liquidity fell to €1.561T a fall of €7B from €1.568T prior. Use of the marginal lending facility fell to €218M from €223M prior.
Corporate issuance saw no activity on Friday rounding the week off with $23.78B coming to market. Issuance is expected to pick up as earnings ramp up during the week. In Euro denominated issuance last week saw €6.2B come to market in the 2nd lowest issuance week so far this year. For the year issuance broke the €500B mark, slightly ahead of last year. For the week ahead issuance is forecasted between €10-15B.
Looking Ahead
(DE) Germany Fin Min Schaeuble speaks at Hospitality Lobby Event, Stuttgart
(DE) German Chancellor Merkel and Ivanka Trump attend G-20 Women's Summit in Berlin
05:30 (BE) Belgium Debt Agency (BDA) to sell €1.8-2.5B in 2023 and 2027 OLO Bonds
06:00 (UK) Apr CBI Industrial Trends Total Orders: 6e v 8 prior, Selling Prices: 27e v 29 prior, Business Optimism: 12e v 15 prior
06:00 (IL) Israel to sell 2019, 2020, 2021 2025, 2027 and 2047 bonds
06:45 (US) Daily Libor Fixing - 07:00 (PT) Portugal Feb Current Account: No est v €0.0B prior
07:00 (IN) India announces details of upcoming bond sale (held on Fridays)
07:25 (BR) Brazil Central Bank Weekly Economists Survey
07:30 (TR) Turkey Apr Real Sector Confidence (Seasonally adj): No est v 106.7 prior; Real Sector Confidence (unadj): No est v 108.1 prior
07:30 (TR) Turkey Apr Capacity Utilization: No est v 74.9% prior
08:00 (CL) Chile Mar PPI M/M: No est v -0.3% prior - 08:15 (UK) Baltic Dry Bulk Index
08:30 (US) Mar Chicago Fed National Activity Index: 0.50e v 0.34 prior
08:30 (CA) Canada Feb Wholesale Trade Sales M/M: -1.0%e v 3.3% prior
08:50 (FR) France Debt Agency (AFT) to sell combined €4.8-6.0B in 3-month, 6-month and 12-month BTF Bills
09:00 (CN) China Mar Conference Board Leading Economic Index: No est v 1.2 prior
09:00 (MX) Mexico Feb IGAE Economic Activity Index (Monthly GDP) Y/Y: 1.1%e v 3.0% prior
09:30 (EU) ECB announces Covered-Bond Purchases
09:35 (EU) ECB calls for bids in 7-Day Main Refinancing Tender
10:30 (US) Apr Dallas Fed Manufacturing Activity: 17.0e v 16.9 prior
11:30 (US) Treasury to sell 3-Month and 6-month Bills
11:30 (US) Fed's Kashkari (Dove dissenter) speaks at UCLA in Los Angeles
16:00 (US) Weekly Crop Progress Report
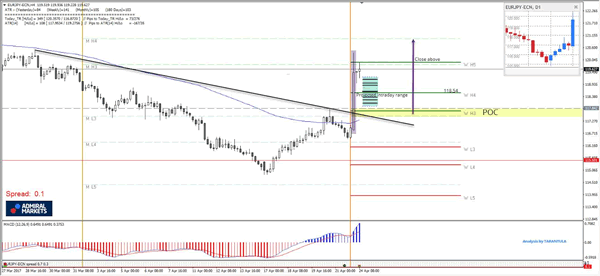
Daily Technical Analysis: EUR/JPY Huge Marubozu After French Elections
The EUR/JPY had formed a huge marubozu candle(purple highlight) on 4h time frame after it was announced that Emmanuel Macron won the first round of the French presidential elections. If you followed my Price Action Trading School, than you should know that marubozu candle appears during high momentum in the market. Equities and EUR/USD went bullish, especially CAC40 as I predicted and analysed in the blog post before the elections.
Today POC zone comes within 117.50-80 (W H3, M L3, order block, inner trend line, 78.6 fib of marubozu candle, ATR low) and if the pair retraces we should see another spike to the upside targeting 118.54 and 119.90 followed by 120.30 and 121.00 (M L4). If we don’t see a retracement to POC, than pay attention to a retest of W H4 and close above (118.54) as it could also spike the pair towards above mentioned levels.
GOLD Bearish Consolidation, SILVER Weakening, CRUDE OIL Ready For Further Downside.
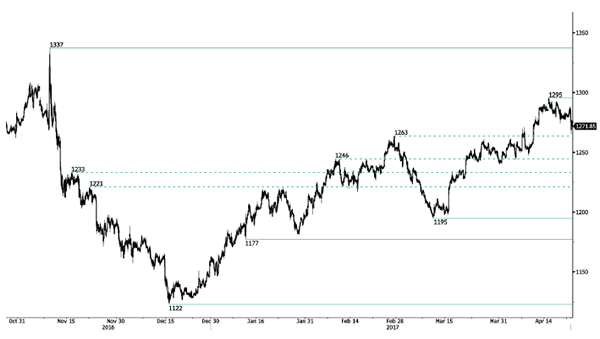
GOLD Bearish consolidation.
Gold has faded near the hourly resistance at 1295 (18/04/2017 high), suggesting a pickup in selling pressures. Support can be located at 1265 (intraday low).
In the long-term, the technical structure suggests that there is a growing upside momentum. A break of 1392 (17/03/2014) is necessary ton confirm it, A major support can be found at 1045 (05/02/2010 low).
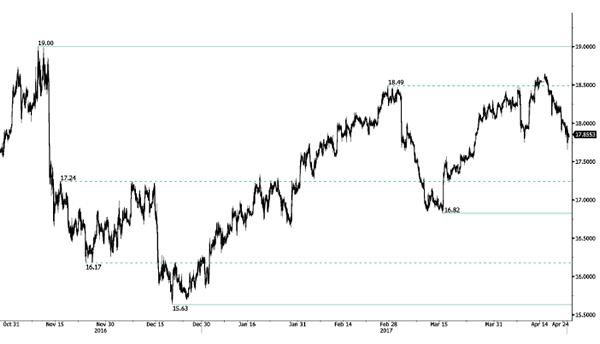
SILVER Weakening.
Silver has broken strong support at 18.16 (rising trendline) indicating further downside risk. Hourly support is given at 17.65 (intraday low) then 16.82 (15/03/2017 low). Strong resistance is given at a distance at 19.00 (09/11/2017 high).
In the long-term, the death cross indicates that further downsides are very likely. Resistance is located at 25.11 (28/08/2013 high). Strong support can be found at 11.75 (20/04/2009).
CRUDE OIL Ready for further downside.
Crude oil has declined sharply, breaking the support at 50.71, yet now has paused. Support now lies at 49.63 (08/12/2017 low). Resistance for a short-term bounce can be found at 50.71 (old support) and 53.70 (12/04/2017 high).
In the long-term, crude oil has recovered after its sharp decline last year. However, we consider that further weakness are very likely. Strong support lies at 24.82 (13/11/2002) while resistance can now be found at 55.24 (03/01/2017 high).

EUR/JPY Consolidating After Short-Term Increase, EUR/GBP Moving Sideways, EUR/CHF Bouncing Higher Very Sharply.
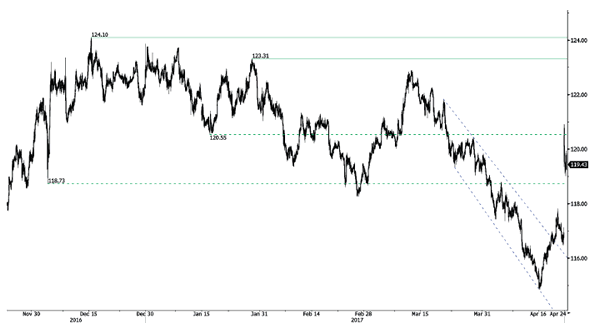
EUR/JPY Consolidating after short-term increase.
EUR/JPY has broken the resistance at 117.43 (23/11/2016 low). Other resistance stands at 122.88 (13/03/0217 high). Major support is given at 114.90 (18/04/2017low).
In the longer term, the technical structure validates a medium-term succession of lower highs and lower lows. As a result, the resistance at 149.78 (08/12/2014 high) has likely marked the end of the rise that started in July 2012. Strong support at 94.12 (24/07/2012 low) looks nonetheless far away.
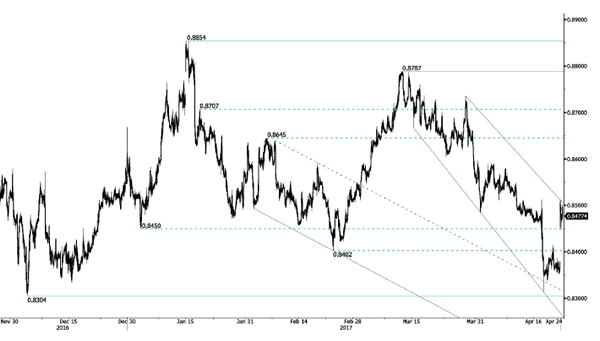
EUR/GBP Moving sideways.
EUR/GBP is now pausing after unsuccessfully challenged its key support at 0.8304. Resistances for a temporary rebound are given by 0.8500 (intraday high) and 0.8512 (18/04/2017 reaction high). The short-term technical structure is negative as long as the resistance at 0.8596 holds. Expected to show renewed weakness.
In the long-term, the pair has largely recovered from recent lows in 2015. The technical structure suggests a growing upside momentum. The pair is trading above from its 200 DMA. Strong resistance can be found at 0.9500 psychological level.
EUR/CHF Bouncing higher very sharply.
EUR/CHF has exited the downtrend channel. However, despite the bullish breakout, the medium-term pattern suggests us to see continued bearish pressures towards key support that can be found at 1.0623 (24/06/2016 low). Expected to see further decline.
In the longer term, the technical structure is mixed. Resistance can be found at 1.1200 (04/02/2015 high). Yet,the ECB's QE programme is likely to cause persistent selling pressures on the euro, which should weigh on EUR/CHF. Supports can be found at 1.0184 (28/01/2015 low) and 1.0082 (27/01/2015 low).
USD/CHF Sharp Bounce, USD/CAD Consolidating, AUD/USD Failing To Find Demand.
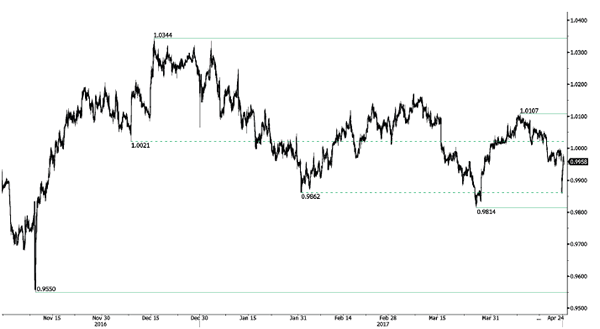
USD/CHF Sharp bounce.
USD/CHF keeps on declining despite strong volatility. The short-term technical structure is negative as long as prices remain below the hourly resistance at 1.0171 (07/03/2017). Monitor hourly support is given at 0.9955 (30/03/2017 base low) then 0.9814 (27/03/2017 low).
In the long-term, the pair is still trading in range since 2011 despite some turmoil when the SNB unpegged the CHF. Key support can be found 0.8986 (30/01/2015 low). The technical structure favours nonetheless a long term bullish bias since the unpeg in January 2015.
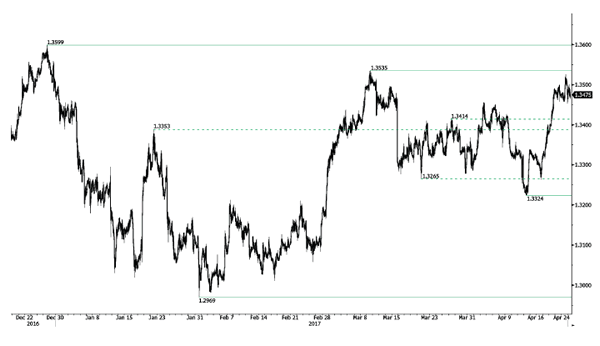
USD/CAD Consolidating.
USD/CAD has increased sharply this week. The pair is now consolidating. There is still a strong upside momentum. Resistances can now be found 1.3535 (09/03/2017 high). Hourly support can be located at 1.3456 (04/04/2017 high) then 1.3353 (20/01/2017 high).
In the longer term, there is a golden cross with the 50 dma crossing the 200 dma indicating further upside pressures. Strong resistance is given at 1.4690 (22/01/2016 high). Long-term support can be found at 1.2461 (16/03/2015 low).
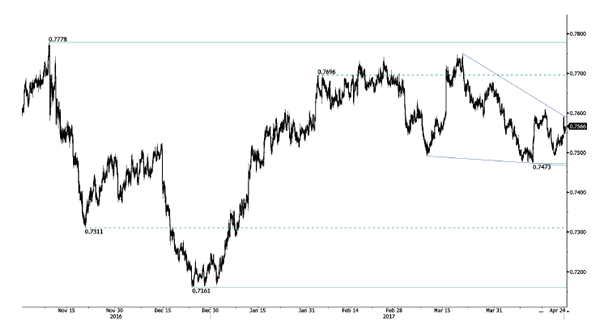
AUD/USD Failing to find demand.
AUD/USD is still trying to bounce off strong support at 0.7473 (12/04/2017 low). However, as long as prices remain below the resistance at 0.7608 (17/04/2017 high), the short-term technical structure is negative. Key resistance stands at 0.7681 (30/03/2017 high).
In the long-term, we are waiting for further signs that the current downtrend is ending. Key supports stand at 0.6009 (31/10/2008 low) . A break of the key resistance at 0.8295 (15/01/2015 high) is needed to invalidate our long-term bearish view.
EUR/USD Rally After First Round, GBP/USD Slightly Lower, USD/JPY Moving Higher.
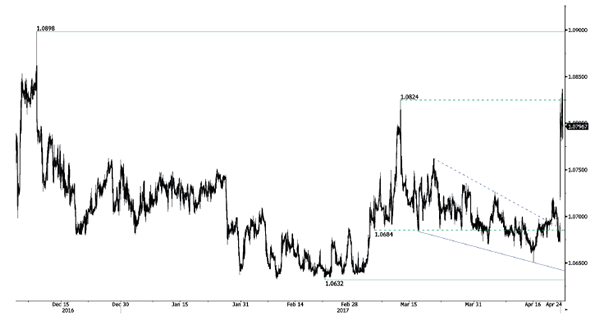
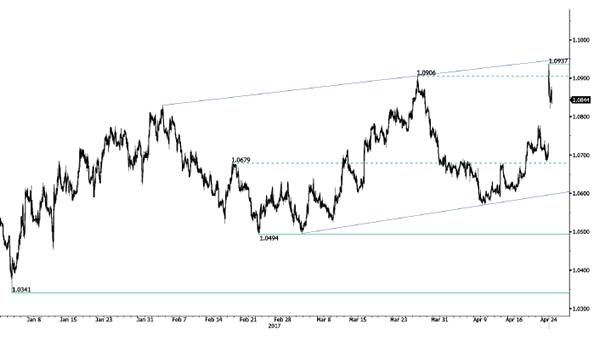
EUR/USD Rally after first round.
EUR/USD is pushing higher. Hourly support can be found at 1.0682 (21/04/2017 base) then 1.0576 (11.04.2017 low). Stronger support can be found at 1.0494 (22/02/2017 low). Resistance given at 1.0906 (27/03/2017 high) has been broken.
In the longer term, the death cross late October indicated a further bearish bias. The pair has broken key support given at 1.0458 (16/03/2015 low). Key resistance holds at 1.1714 (24/08/2015 high). Expected to head towards parity.
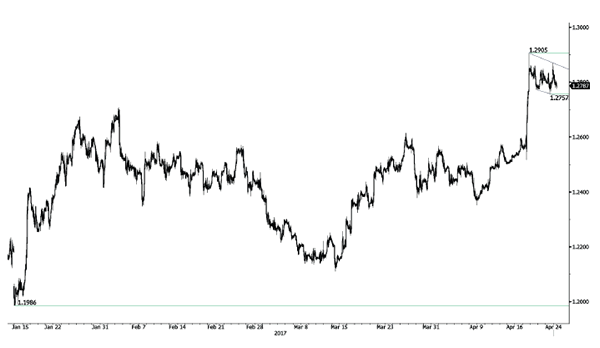
GBP/USD Slightly lower.
GBP/USD is consolidating lower after sharp bullish rally. Resistance stands at 1.2905 (18/04/2017 low). The pair is now monitoring hourly support at 1.2775 (21/04/2017 low) as a break would confirm a weakening short-term bullish momentum. Hourly resistance is located at 1.2905 (18/04/2017 reaction high).
The long-term technical pattern is even more negative since the Brexit vote has paved the way for further decline. Long-term support given at 1.0520 (01/03/85) represents a decent target. Long-term resistance is given at 1.5018 (24/06/2015) and would indicate a long-term reversal in the negative trend. Yet, it is very unlikely at the moment.
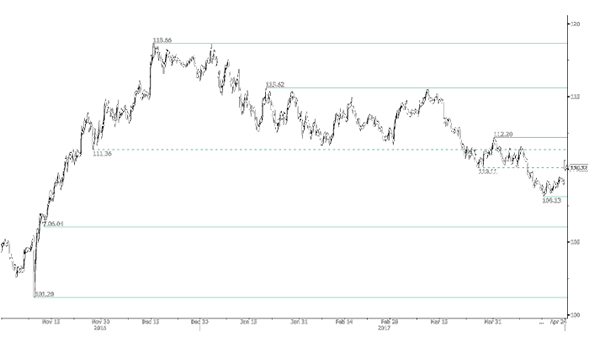
USD/JPY Moving higher.
USD/JPY has drifted higher. Hourly resistance at 109.10 (18/04/2017 high) has been broken. Other resistance can be found at 110.11, while a key resistance stands at 112.20 (31/03/2017 high). Next support can be located at 108.22 (17/04/2017 low). Other key supports lie at a distant 106.04 (11/11/2016 low).
We favor a long-term bearish bias. Support is now given at 96.57 (10/08/2013 low). A gradual rise towards the major resistance at 135.15 (01/02/2002 high) seems absolutely unlikely. Expected to decline further support at 93.79 (13/06/2013 low).
Technical Outlook: EURUSD Eases From Fresh 2017 High, Near-Term Action Expected To Stay Bullishly Aligned While Broken 200SMA Is...
The Euro eased back to 1.0820 zone after opening with nearly two-hundred pips gap higher, boosted on anticipated win of presidential candidate Macron in the first round of French election.
The single currency hit fresh high of over five-month at 1.0916, on opening on Monday and briefly extended above key short-term barrier at 1.0905 (27 Mar high).
Strong bullish sentiment that has been established is expected to keep the pair supported in the near-term, as long as today's gap remains unfilled.
Broken 200SMA is still acting as valid support at 1.0836, despite being dented overnight on extension to 1.0821 (session low), with fresh upside attempts to be expected while the latter support is holding.
The pair may hold in extended consolidation until markets fully digest recent news, but will remain bullishly aligned on positive sentiment.
Firmly bullish daily studies are also supportive for fresh attacks at 1.0916 peak and possible extension towards psychological 110.00 barrier which is sen as near-term target.
Conversely, firm break below 200SMA would weaken near-term structure and increase risk of filling today's gap and return to neutrality zone of former 1.0700/77 congestion.
Res: 1.0876, 1.0916, 1.0950, 1.1000
Sup: 1.0836, 1.0819, 1.0777, 1.0752
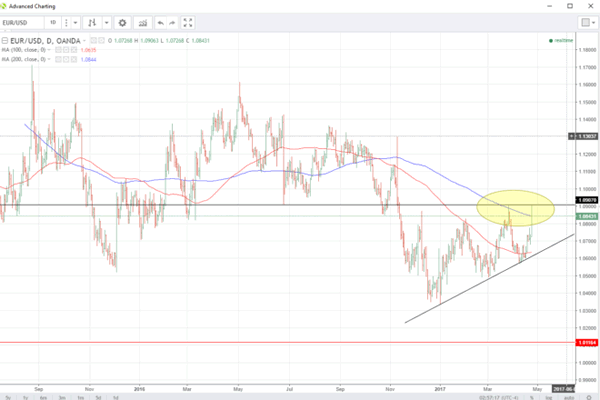
Double Top, May Cause A EURUSD Flop
Unnoticed this morning, Euro made a double top, which means USD/JPy may have better value going forward.
We won't dwell on Macron's victory yesterday as much has and will be written. The overall effect should be neutral to small bullish on European bonds, stocks and equities as he will not control the legislature after the Parliamentary elections. This will mean compromises and coalitions and almost certainly a policy agenda that will move as fast the French civil service.
Naturally, it has been a risk on day with Asia indices rallying along with Yen crosses. EUR gapped nearly 200 points higher from Friday to trade as high at 1.0907 before spending the day drifting back to 1.0850. USD/JPY gapped higher as well, trading above the 110.00 level as EUR/JPY also gapped.
The reason I keep mentioning gaps is because they're well, gaps. Have we gaps on charts everywhere thanks to the EUR/USD and USD/JPY jumping in the twilight hours of the morning. EUR/GBP, GBP/JPY, AUD/JPY/ CHF/JPY, EUR/TRY, you pretty much name it. If it has an EUR or a JPY in it has a gap on its charts this morning. Have a look at your one-minute charts, and you will see what I mean. The problem with gaps is that from a technical and purely trading perspective, they usually get filled back in. Particularly ones that happen at the market open at 2 am on a Monday in Singapore.
This is not always the case I must qualify, but it is very often the case. In Euro's case, the gap is much bigger then JPY's and potentially more damaging to Euro bulls technically as we shall see. Traders, in fact, may find the USD/JPY and XXX/JPY set-up more intriguing than EUR/USD over the next few days.
EUR/USD
Almost unnoticed this morning, EURO jumped nearly 200 points from the New York close and then spent the rest of the day drifting lower. In the process, it traced out a potential double top at 1.0907. I say potential because it will only be confirmed if we are under 1.0907 at the New York close.
This does bear watching though, especially in the context of my comments on gap filling above. The formation itself also appears to still be an ascending wedge/triangle in a greater downwards trend. This is a bearish consolidation pattern for technicians. Thus the double top could be quite significant if it holds in the bigger picture.
Euro has resistance at the 1.0907 level, but a daily close and consolidations above open the way to 1.1300 in technical terms.
Support lies at 1.0730, then the 100-day moving average at 1.0635 followed by the rising trendline at 1.0610.
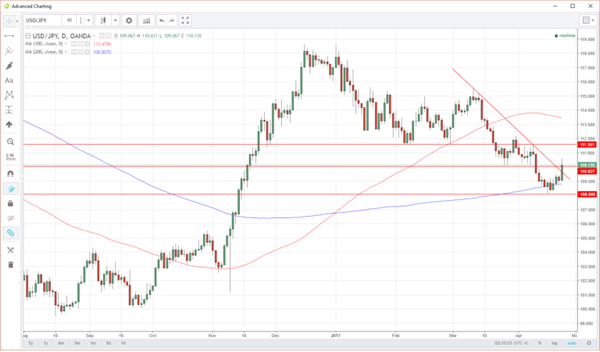
USD/JPY
In the Euro noise today, USD/JPY went about its business quietly. Gapping some 100+ points higher to 110.60, it broke some important technical levels and had consolidated above them.
Firstly its downtrend at 109.50 was taken out and then the all important pivot, 110.00. These now become support.
Resistance lies at 111.60 with the 100 DMA at 113.50. The higher they climb, the harder they fall, and with a larger gap, Euro has more potential to fall should it fill that gap up.
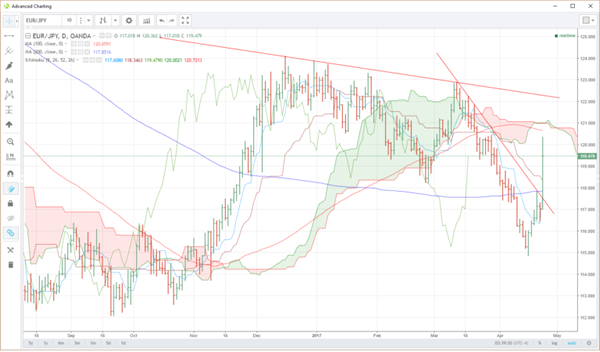
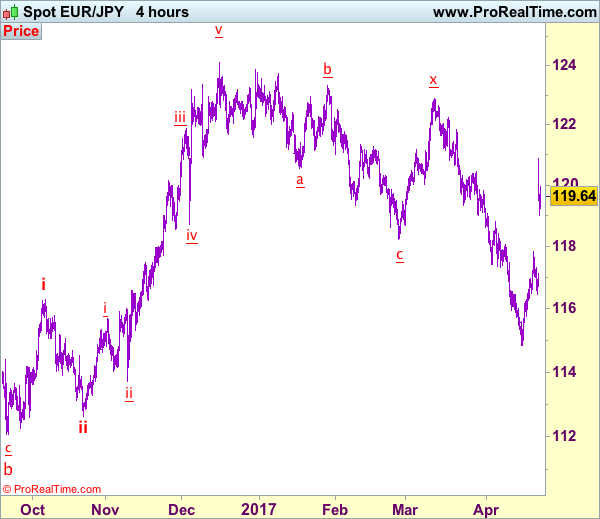
EUR/JPY
Don't let all the lines and colours scare you, concentrate on the big picture.
EURJPY has gapped from 117.10 to 120.60 this morning before retracing its way back to 119.35. Along the way, it broke its downtrend line at 117.40, and the 200-DMA at 117.85. These now become support albeit quite far away. (Hence gap filling can be a little scary)
Today's high at 120.35 is the first resistance followed by the 100-DMA at 120.65 before another resistance line at 122.25.
The Ichi moko cloud, although rather scrawny as it sits at 121.00 will also provide some resistance.
Overall the EUR/JPY has a lot more wood to chop technically than the USD/JPY.
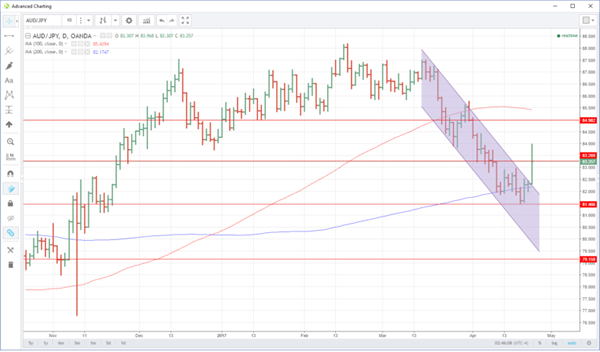
AUD/JPY
The AUD/JPY is one of the highest beta crosses to investor risk appetite, and it didn't disappoint today. Breaking out of its month-long down channel at 82.30 before proceeding straight to go, reaching a high of 83.95. 82.30 along with formerly interim resistance at 83.35 become support.
Resistance lies at 83.95, the daily high, and then the congestion region around the 85.00 level.
SUMMARY
Also, the attention has been on the EURO today, from a technical perspective, USD/JPY and the JPY crosses have all had more constructive days. The 1.0907 double top in EUR has the potential to become a very significant level now. Traders should also “mind the gaps” on many crosses and the EURO after this morning's price action.
Trade Idea: EUR/JPY – Stand aside
EUR/JPY - 119.82
Recent wave: wave v of (C) ended at 94.12 and major correction in wave A has ended at 149.79
Trend: Near term down
Original strategy:
Sold at 118.40, stopped at 119.00
Position: - Short at 118.40
Target: -
Stop: - 119.00
New strategy :
Stand aside
Position: -
Target: -
Stop:-
The single currency opened sharply higher today on risk appetite, signaling a temporary low has been formed at 114.85 early last week, hence gain to 121.00 cannot be ruled out, however, as the low at 114.85 is viewed as the 2nd wave a, upside should be limited to 121.80-85 and resistance at 122.26 should remain intact, bring another decline later.
On the downside, although the pullback from 120.88 may bring pullback to 118.95-00, reckon downside would be limited to 118.40-50 and previous resistance at 117.82 (now support) should hold and bring another rise later. Below 117.30-35 would suggest top is possibly formed instead, then test of Friday’s low at 116.46 would follow but only a break below this level would provide confirmation.
Our latest preferred count is that wave (ii) is ABC-X-ABC which ended at 123.33 and wave (iii) is unfolding with wave iii ended at 100.77, followed by wave iv at 111.57 and wave v as well as the wave (iii) has ended at 97.04, followed by wave (iv) at 111.43 and wave (v) has ended at 94.12 which is also the end of the larger degree v, this also implied the major wave (C) has also ended there, hence major correction has commenced from there with (A) leg unfolding in its lower degree wave c which has possibly ended at 145.69. Under this count, A-B-C wave (B) has commenced with A leg ended at 136.23, wave B at 143.79 and wave C has possibly ended at 149.79.
Our larger degree count is that the decline from 139.26 is wave (C) and is sub-divided into a diagonal triangle i-ii-iii-iv-v with wave i - 105.44, wave ii- 123.33, wave iii - 97.03, wave iv - 111.43, followed by the final wave v as well as the end of wave (C) at 94.12, this also mark the bottom of larger degree wave B. Under this count, major rise in wave C has commenced as an impulsive wave with minor wave III ended at 145.69, wave V is still in progress for further gain to 150.00. Having said that, this so-called wave V could well be the first leg of larger degree 5-waver wave C and this wave C should bring at least a retest of wave A top at 169.97 (July 2008).
Euro Hits 5-Month Highs As Investors Cheer French Vote
The euro rallied on Sunday after the French presidential election, which showed Emmanuel Lacron and Marine Le Pen advancing to the second round. EUR/USD has paused in the Monday session, as the pair trades quietly at 1.0870. On Sunday, the euro touched a high of 1.0934, its highest level since early November. On the release front, German Ifo Business Climate improved to 112.9, beating the forecast of 112.4 points. In the US, there are no economic releases on the schedule. On Tuesday, the US releases CB Consumer Confidence and New Home Sales.
Almost 40 million French voters went to the polls on Sunday, and for the markets, expected news was good news indeed. The first round of the presidential election featured 11 candidates, and the vote whittled the field down to just 2 candidates – centrist Emmanuel Lacron and far-right Marie Le Pen. Lacron garnered 24% of the vote and Le Pen 22%, which was what most polls leading up to the election predicted. The runoff vote takes place on May 7 and French voters will have a clear choice between Lacron, who served as an economic minister, and Le Pen, who is running on an anti-EU platform. The markets breathed a sigh of relief, as the nightmarish scenario of a runoff between Le Pen and far-Left candidate Jean-Luc Mélenchon was averted. We can expect daily opinion polls to be market-movers, as was the case before the first round. Lacron goes into next week’s vote as a heavy favorite, and two candidates in the first round have thrown their support behind Lacron – center right François Fillon and Socialist Benoit Hamon.
What’s next for Janet Yellen and Co.? The Federal Reserve has broadly hinted that it will gradually raise rates in 2017, but it’s unclear how many times Janet Yellen will press the rate trigger. Most analysts are expecting two more moves this year, but there have been calls from some Fed policymakers for three more hikes. However, soft retail sales and CPI numbers in March have made the Fed more dovish, and on Tuesday, the Atlanta and New York Federal Reserve lowered their outlook for US economic growth for the first quarter. The Fed can point to a labor market that is close to capacity as well as strong consumer confidence, but surprisingly, this has not translated into stronger consumer spending, a key driver of economic growth. Will the Fed raise rates in June? The CME Group shows the odds of a June hike have dropped to 50%, compared to 64% earlier in April.