Sample Category Title
Trade Idea: AUD/USD – Stand aside
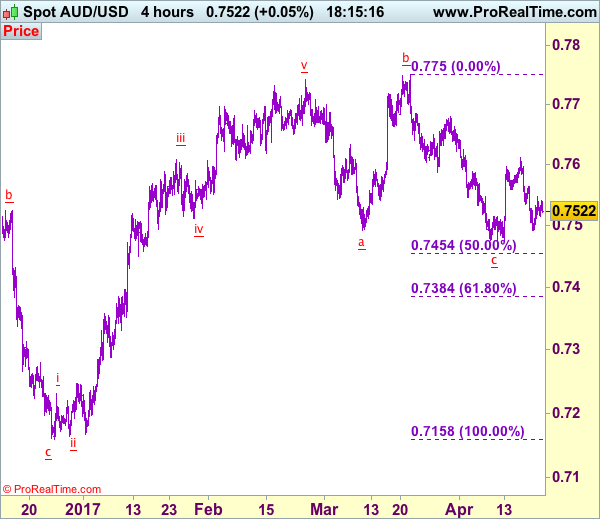
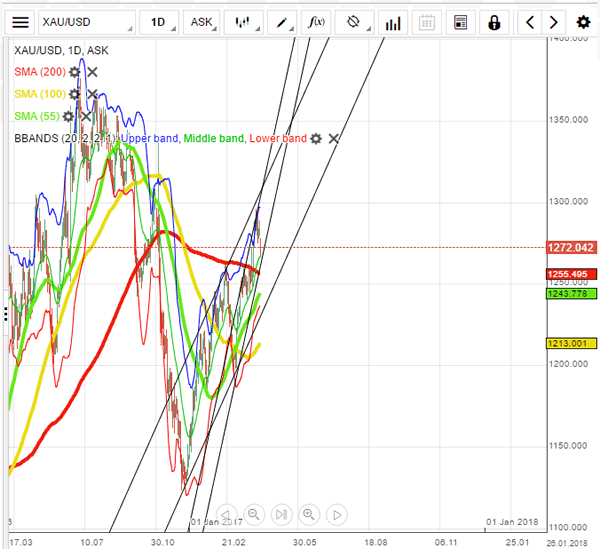
AUD/USD – 0.7580
Recent wave: Wave 5 ended at 1.1081 and major correction has commenced for fall to 0.7000 and then towards 0.6500-10
Trend: Near term down
New strategy :
Stand aside
Position: -
Target: -
Stop:-
As aussie found good support at 0.7491 and has staged a strong rebound from there, retaining our view that further consolidation above this month’s low at 0.7473 would be seen and another bounce to resistance at 0.7611 cannot be ruled out, however, break there is needed to signal the fall from 0.7750 to 0.7450-55 (50% Fibonacci retracement of 0.7158-0.7750) but reckon downside would be limited to 0.7380-85 (61.8% Fibonacci retracement), risk from there is seen for a rebound later.
On the upside, only break of said resistance at 0.7611 would signal low has been formed at 0.7473, bring a stronger rebound to 0.7650 but resistance at 0.7680 should hold from here, price should falter below 0.7700-10, bring another decline later. As near term outlook is still mixed, would be prudent to stand aside in the meantime.
On the 4-hour chart, the move from 0.8066 is the wave 5 with i: 0.8860, ii: 0.8315, wave iii is an extended move ended at 1.0183, iv: 0.9706 and wave v has ended at 1.1081 (also the top of entire wave 5). The subsequent selloff is the major correction which is unfolding as ABC-X-ABC and 2nd A leg has ended at 0.8848, followed by a-b-c wave B which ended at 0.9758, hence, 2nd C wave is now in progress and indicated downside target at 0.7000 and 0.6950 had been met, so further fall to 0.6710-20 cannot be ruled out.
EUR/USD Buoyed, Risk Rally Is On
Relief rally amid French vote
Financial markets across the planet welcomed the result of the first round of the French election, with the qualification of Le Pen and Macron for the second round. European equities rallied massively this morning with the CAC 40 jumping 3.40%. Financial stocks performed the best on Monday with Société Générale rising 8.9% and Crédit Agricole up 7.90%. Financials across Europe extended gains with Barclays, UBS and Commerzbank up 4.10%, 3.80% and 9.50% respectively.
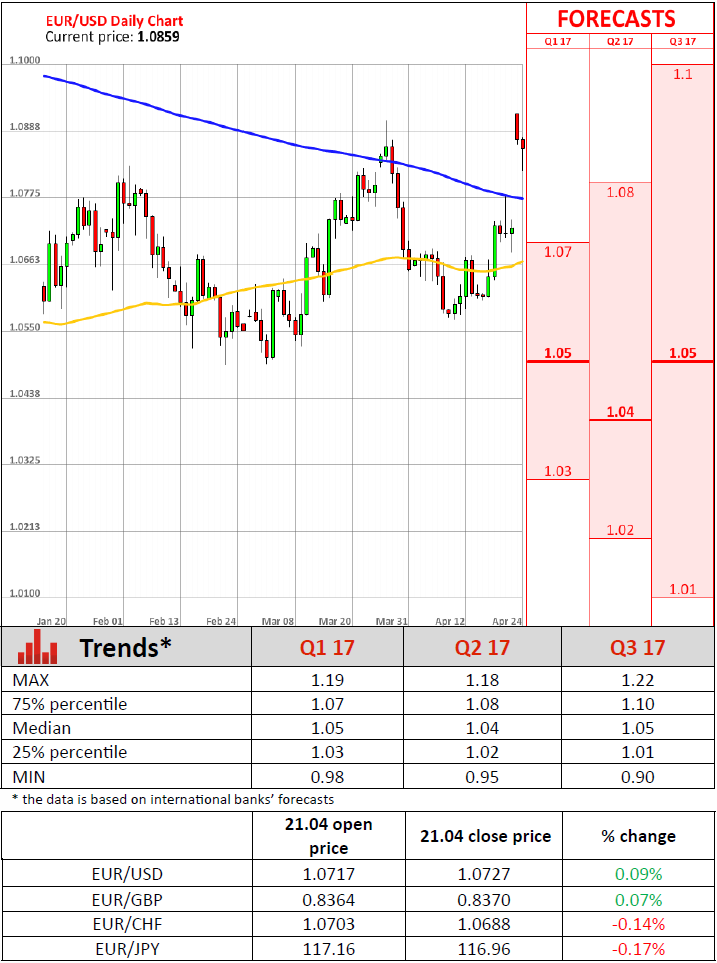
In the FX market, the euro was better bid and gapped at opening. EUR/USD opened at 1.0859 on Monday, up 1.22% compared to Friday's close (1.0728). The risk-on move triggered a sell-off in safe-haven assets, with the Japanese yen and gold falling 0.95% and 1% against the USD, respectively. In contrast the Swiss franc edged slightly higher as it gained 0.25% against the greenback. It may seem odd to investors that the Swiss franc did not suffered more; however it is coherent with the behaviour in the past few weeks. Indeed, the SNB was extremely active over that period as it tried to mitigate the CHF appreciation. By comparison, the JPY rose 2%, while the CHF surged 0.60% between April 1st and last Friday.
Overall, investors switched to risk-on mode and started reloading on risk. We expect the risk rally to continue gaining traction over the next few days as market participants sell US assets - especially bonds - and move towards European and emerging market assets. The hunt for yield is far from over, especially now that Trump's reflation trade is losing traction.
Le Pen through to second round but Macron's final victory now looms
Financial markets feared a second round between Jean-Luc Mélenchon and Marine Le Pen who was likely to trigger some volatility. Marine Le Pen's final result below 22% is disappointing as she was expected in various polls to reach between 27% and 30%.
The failure of Le Pen or Mélenchon to sway undecided voters or unlock closely-guarded voting behaviours will come as a major relief to investors fearing uncertainty over whether the second round would bring a new set of complexities. At present, extreme volatility has been avoided. Emmanuel Macron and Le Pen will move forward to the second round run-off on May 7.
The result is very market-friendly. The failure of Marine Le Pen or Jean-Luc Mélenchon to surge on voting day should be viewed as a vote for the EU. Eventually, Emmanuel Macron is now very likely to become the new French president. Most of the runner-up such as François Fillon who scored around 19%, are calling for a Macron vote for the final vote in two weeks. Even Mélenchon, which program was very similar to Marine Le Pen's has been calling, through his lieutenants, to vote for Emmanuel Macron.
There had not been a massive relief, if any, in financial markets tomorrow. However the single currency may appreciate slightly against the swiss franc. There's defnitely no fear for the second round. First final results estimates are now calling for a 62% Macron's victory for the second round. European Union seems to win a battle and attention should carefully shift towards the German's election in August.
We anticipate no extreme volatility in the FX market, with marginal Euro buying (as markets had positioned for this outcome) as exit polls become official results. We nonetheless remain long EURCHF on a rejection of an anti-EU vote.
EUR/USD Analysis: Opens Above 1.09 Mark
'French voters face two radically different visions of the country's future after centrist Emmanuel Macron and far-right nationalist Marine Le Pen won the first round.' – Bloomberg
Pair's Outlook
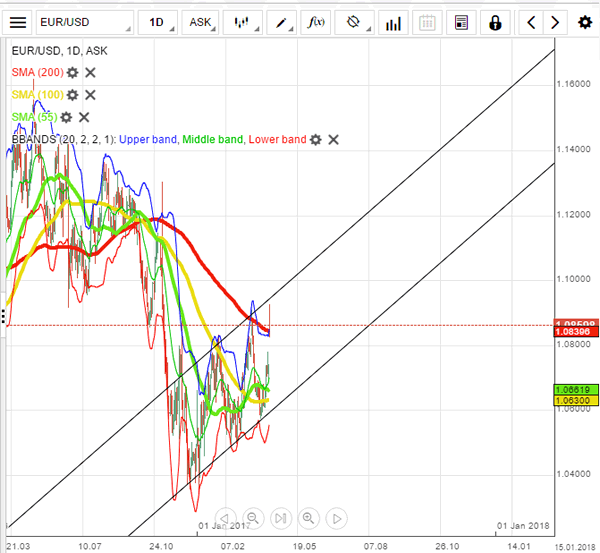
Due to the French election induced certainty in the Euro the EUR/USD currency exchange rate began the week at 1.0923, which is almost 200 base points higher than the Friday's closing price. Although this is a fundamental shift, the move is still consistent with the large scale ascending channel pattern, as the upper trend line of the channel has not been reached. On Monday morning profit taking was occurring, as the rate had dropped down to the 1.0826 level. It is most likely that the rate will soon find support and stop before the future direction is revealed.
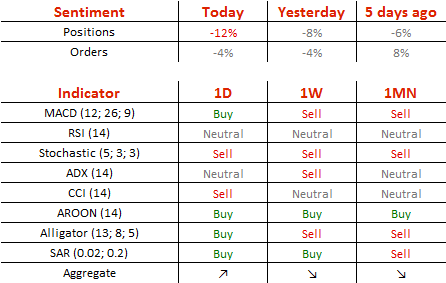
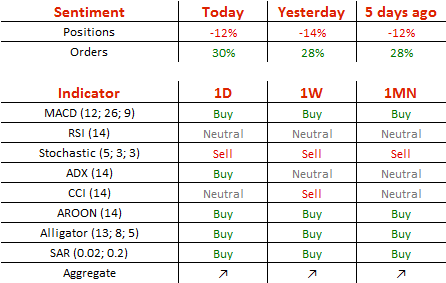
Traders' Sentiment
SWFX traders are bearish on the pair, as 56% of open positions are short. Meanwhile, 52% of set up orders are to sell the Euro.
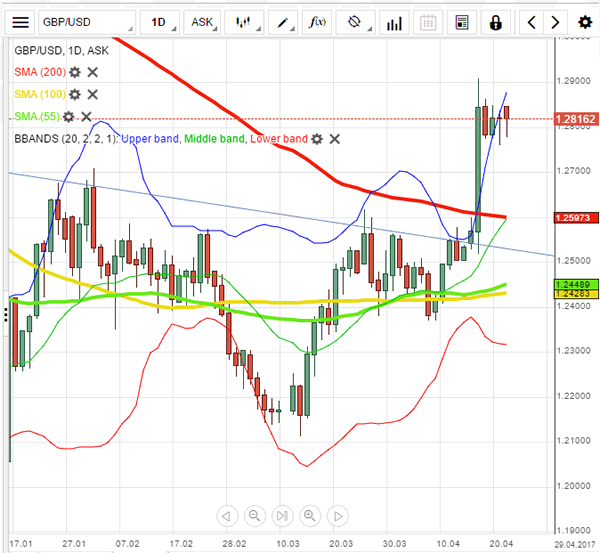
GBP/USD Analysis: Keeps Gravitating Towards 1.28
'We read the technical indicators as suggesting there is scope for addition gains, but suspect the $1.3000-$1.3050 may be difficult to overcome.' – BBH (based on FXStreet)
Pair's Outlook
Downbeat UK Retail Sales were unable to relieve the British Pound of its strength, as it erased all intraday losses and held its positions above the 1.28 against the US Dollar on Friday. However, further upside momentum seems unlikely, as the 1.2850 level keeps providing relatively strong psychological resistance, now also bolstered by the upper Bollinger band. At the same time, a sharp bearish development is doubtful, due to the weekly PP and the monthly R1 forming a tough demand area at 1.2745. Until a solid market mover is presented the Cable is expected to remain within this trading range, namely between 1.2750 and 1.2850.
Traders' Sentiment
Market sentiment remains in perfect equilibrium today, but the share of buy orders is higher-taking up 60% of the market (previously 57%).
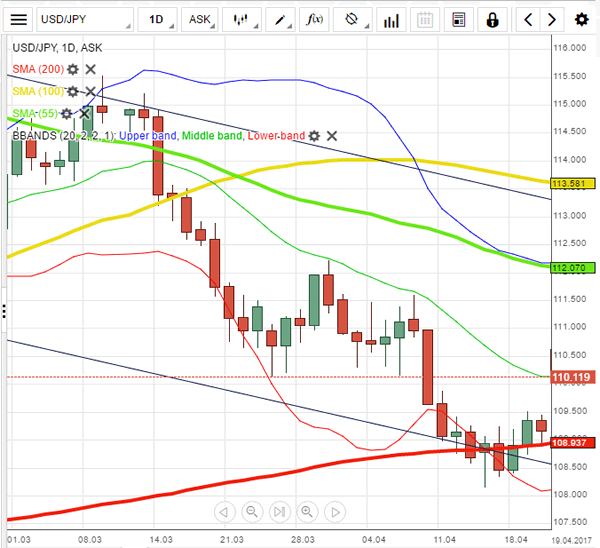
USD/JPY Analysis: To Hold Above 110.00
'Should the yen be bought, if the Korean situation is so nearby? But buying the yen seems to be the established market reaction, and if you've been around long enough, you know you don't go against the market.' – State Street Bank and Trust (based on Reuters)
Pair's Outlook
The USD/JPY currency pair remained relatively unchanged on Friday, retaining its position above the 109.00 mark. However, on Sunday the French election first round's results allowed the risk-on mood to prevail and boosted the US Treasury yields, causing the pair to open with a strong bullish gap today. Despite this gap, a technical correction is likely to take place, with investors taking profit of the recent rally. Technical indicators also suggest the Greenback is to weaken against the Yen today, but price is expected to close above the 110.00 threshold, despite strong downside volatility. The election surge ultimately was a good sign for the USD/JPY, as it preserved the channel pattern.
Traders' Sentiment
There are 69% of traders holding long positions today (previously 72%), whereas only 58% of all pending orders are to acquire the US Dollar.
Gold Analysis: Trades Near 1,270 On Monday
'Gold fell nearly 1 percent on Monday to its weakest in two weeks after centrist Macron led the first round of voting in the French presidential election.' – Swati Verma, Reuters
Pair's Outlook
On Monday morning the yellow metal was recovering after the low opening and fall caused by the French presidential election. The bullion almost touched the 1,265 mark before it rebounded and surged up to the 1,275 level, where close by two resistance levels are located at. However, the yellow metal's price still remains in the borders of a medium scale ascending channel pattern. The commodity price has touched the lower trend line of the channel, which means that the bullion is likely to surge in the near future.
Traders' Sentiment
SWFX market sentiment remains bearish, as 56% of open positions are short. However, 65% of trader set up orders are to buy.
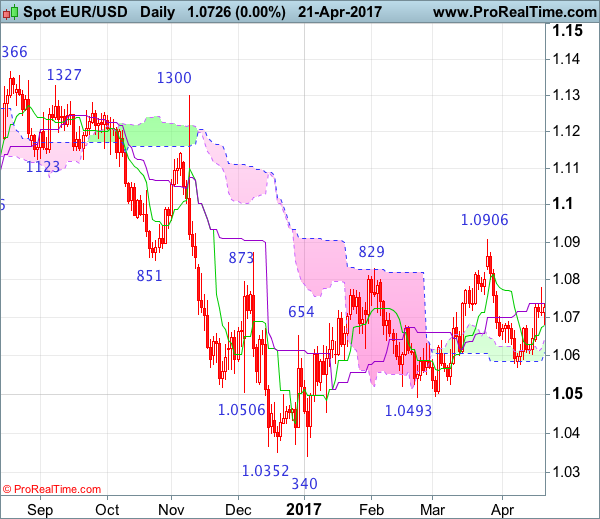
EUR/USD Candlesticks and Ichimoku Analysis
Weekly
• Last Candlesticks pattern: Shooting star
• Time of formation: 03 May 2016
• Trend bias: Down
Daily
• Last Candlesticks pattern: Shooting star
• Time of formation: 3 May 2016
• Trend bias: Sideways
EUR/USD – 1.0645
Although the single currency retreated initially last week, as euro found renewed buying interest at 1.0602 and has staged a strong rebound above previous resistance at 1.0906, signaling the erratic rise from 1.0340 low is still in progress and may extend gain, above 1.0936 resistance would bring further rise to 1.1000 and then towards 1.1050-60 but upside should be limited to 1.1100 and price should falter well below previous chart resistance at 1.1300, bring selloff later.
On the downside, whilst initial pullback to 1.0775-80 cannot be ruled out, reckon downside would be limited to 1.0740-45 and support at 1.0682 should remain intact, bring another rise later. A daily close below support at 1.0682 would suggest top is possibly formed instead, bring weakness to 1.0635-40 but break of said support at 1.0602 is needed to revive bearishness and extend fall to key support at 1.0570. Looking ahead, once this level is penetrated, this would suggest the erratic rise from 1.0340 has ended, bring further fall to key support at 1.0493 which is likely to hold from here.
Recommendation: Stand aside for this week.
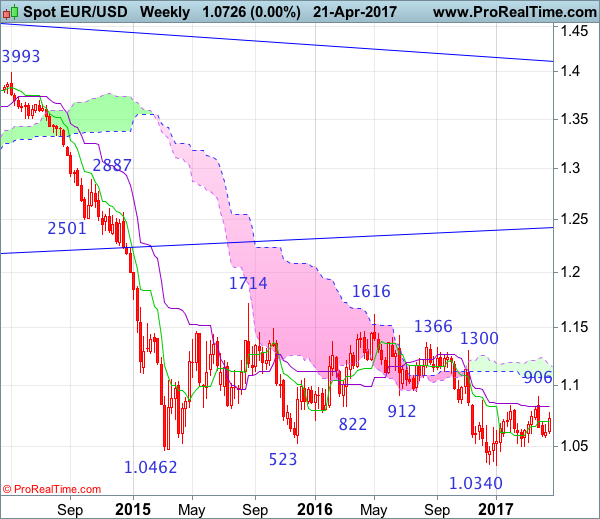
On the weekly chart, as the single currency opened sharply higher after last week’s strong rebound and broke above resistance at 1.0906, suggesting the erratic rise from 1.0340 low is still in progress for retracement of recent decline to 1.1000 and possibly test of the lower Kumo (now at 1.1070), however, reckon upside would be limited to the upper Kumo (now at 1.1161) and price should falter well below previous resistance at 1.1300, risk from there is seen for a retreat to take place later.
On the downside, although initial pullback to 1.0775-80 is likely, reckon downside would be limited to the Tenkan-Sen (now at 1.0716) and support at 1.0682 should hold, bring another rebound later. Only a drop below support at 1.0602 would suggest top is possibly formed, bring test of 1.0570, once this level is penetrated, this would suggest top is formed instead, bring test of indicated pivotal support at 1.0493, break there would signal the rebound from 1.0340 has ended instead, bring further fall to support at 1.0454, a sustained breach below this level would provide confirmation, then further fall to 1.0390-00 and later retest of this January low would follow.
Euro Zone Economy Starts Q2 With Solid Growth
'April's rise in the euro zone composite PMI adds to evidence that the economy is performing well.' - Jennifer McKeown, Capital Economics
Services and manufacturing activity in the Euro zone rose more than expected in April, suggesting that the region's economy started the Q2 of 2017 with solid growth. HIS Markit reported on Friday that its Flash Purchasing Managers' Index for the Euro zone's manufacturing sector came in at 56.8, following March's final reading of 56.2 and surpassing analysts' expectations for 56.1. Furthermore, the Flash Services PMI came in at 56.2 in April, while markets anticipated an unchanged reading of 56.0 during the reported period. Thus, the Flash Composite PMI advanced to 56.7 from March's 56.4, hitting its highest since April 2011. Economists stated that Friday's PMI surveys provided enough evidence to say that the Euro zone economy started the Q2 with strong growth. In the meantime, the Flash Services PMI for the Euro zone's largest economy, Germany, fell to 54.7 in April, down from the prior month's 55.6 and below expectations for 55.5. The Flash Manufacturing PMI for Germany remained virtually unchanged, declining to 58.2 from 58.3 in March. Despite the stronger-than-expected release, the Euro failed to maintain its initial gains against the US Dollar and other major currencies, as investors shifted their attention to the first round of the French presidential election.
UK Retail Sales Post Largest Quarterly Decline Since 2010
'Families are facing the fastest rise in living costs for over three years and they are reining in their spending rapidly.' - Richard Lim, Retail Economics
Friday's data on British retail sales surprised many experts who did not expect such a notable change in March. According to the ONS, sales in the retail sector dropped 1.8% on a seasonally-adjusted basis, while analysts anticipated only a 0.3% decrease. Similarly, on a quarterly basis, retail sales lost 1.4%, which was the first negative contribution to GDP growth since the Q4 of 2013. The following decline was a result of a change in average store prices, which were continuously increasing since January. In fact, in March, consumer prices reached the highest peak since December 2014. In addition, in volume terms, goods bought in most of the sub-sectors, except for department stores and household goods stores, decreased. For instance, the amount of money spent in food stores in March advanced 0.3%, while the amount of purchased goods diminished 0.5% compared to the previous month. In contrast to traditional retail sales, data on online stores showed that British consumers in March spent on average 1.0B pounds per week on online stores, a 19.5% rise compared to the same period a year ago. Retail sales are tightly connected to consumer spending. Thus, weak retail sales combined with rising inflation suggest that consumer spending will unlikely provide a significant support to economic growth.
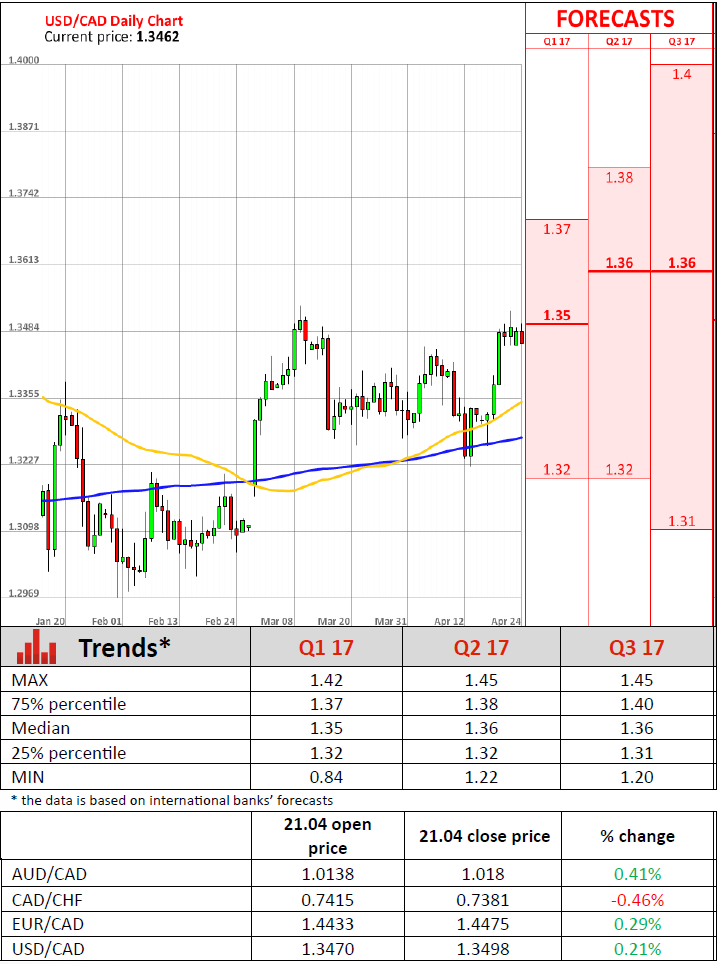
Canadian Inflation Growth Falls Unexpectedly Last Month
'I just don't see the talk of rate hikes anytime soon as being credible, anchored in the inflation numbers that we're getting.' - Derek Holt, Scotiabank
Canada's inflation growth slowed last month as food prices dropped for the sixth consecutive month. Statistics Canada reported on Friday that the annual inflation rate declined to 1.6%, down from April's 2.0%. Meanwhile, market analysts anticipated a gain of 1.8%. On a monthly basis, consumer prices rose 0.2% in March, unchanged from the preceding month, whereas analysts expected a climb of 0.4% during the reported period. Transportation costs advanced 4.6% on an annual basis but were offset by weak food prices, which dropped 1.9% year-over-year, and clothing costs. Among the Bank of Canada's core inflation measures, the CPI-common, considered to be the best measure of inflation, remained unchanged at 1.3% last month. The CPI-median, a measure based on the weighted median, dropped to 1.7%, whereas the CPI-trim, which excludes upside and downside outliers, fell to 1.4%. Due to weaker-than-expected inflation data, the Central bank is set to keep its monetary policy unchanged for an indefinite period of time or until the inflation rate hits the BoC's target of 2%. The Bank's key interest rate remained unchanged at 0.50% since July 2015. Friday's figures confirmed the view that inflationary pressures in Canada remained low and the recent boost was driven by the temporary oil price rise.