Sample Category Title
Cable Rallies To Precipitous Position, Which Way Will It Go In The Week Ahead?
Key Points:
- Price action stalls at 1.28 handle.
- RSI Oscillator strongly overbought.
- 1.2754 support zone will need to hold if pair has chance of resuming rally.
The Cable had a tumultuous week as the U.K. Prime Minister, Theresa May, shocked the market with a snap election to strengthen her mandate for a Brexit. This caught the market off-guard and saw the pair rally nearly 200 pips. However, it remains to be seen if it can continue its upward trajectory in the week ahead. Subsequently, we take a look at what occurred and what potentially looms on the horizon for the venerable Cable.
Last week provided some surprises for the market as an announcement from U.K. Prime Minister, Theresa May, called for a snap election to decide the Brexit issue once and for all. The canny May is seeking to bolster her mandate to take the island nation through a hard Brexit. Subsequently, the cable rallied like there was no tomorrow to test the 1.29 handle. However, a range of disappointing data stalled the move, with the U.K. Retail Sales falling to 1.7% y/y (3.4% exp), and the pair subsequently moderated and closed the week out around the 1.2803 mark. The latter part of the week also brought some news from the U.S. that the Trump administration is considering tax cuts which also added to the moderating forces.
Looking ahead, there are some key events looming for the pair in the week ahead with the U.K. Advance GDP and U.S. Unemployment Claims data due out. In particular, the Advance GDP figures are going to be a key focus early in the week with the metric forecast to come in at 0.4% q/q. However, anything is possible given last week’s relatively weak retail sales data which emanated from the United Kingdom. In addition, the U.S. Initial Jobless Claims are also due out and most economists have that figure coming in at 242k. Subsequently, there are quite a few data points that could provide plenty of volatility for the Cable in the week ahead.
From a technical perspective, the Cable’s recent surge has seen it break sharply above the 100MA which suggests that the long term move from 1.2108 has yet to complete. However, the RSI Oscillator is strongly overbought, and the failure to breach 1.29 is likely to suggest a period of moderation. Subsequently, our initial bias for the week ahead is neutral given some of the mounting risks. Support is currently in place for the pair at 1.2754, 1.2625, and 1.2545. Resistance exists on the upside at 1.2844, 1.2904, and 1.3121
Ultimately, the coming week is likely to prove relatively critical for the pair given its current valuation just below the 1.2900 handle. However, if the pair can hold above the 1.2754 zone of support it might allow it to build up some steam for another crack at the April high. In the case of a breach of this level, all bets are off, and you could see the air rapidly deflate from the balloon that is the Cable. Subsequently, there is plenty of risk floating around in the coming days and we will have to wait and see which way it goes.
Relief Rally In Euro As Macron Secures Early Victory Over Populism
European equity markets are poised to start the week on a positive note on Monday after the first round of the French elections suggested that the populist wave that engulfed the UK and US in 2016 has not quite breached the borders of the eurozone countries.
While it's clear that populism is growing in the region as it is elsewhere, the victory for Emmanuel Macron in the first round may well have crushed the chances of Marine Le Pen in two weeks' time. Even when the polls had Le Pen taking the first round, Macron was comfortably expected to win the head to head but with the centrist candidate having toppled her on Sunday, the leader of the National Front would appear to have a monumental job on her hands.
While the result on Sunday was largely in line with what the latest polls had been projecting, we did see a more cautious approach from investors heading into it having learned their lessons from last year. The relief rally in the euro overnight are a clear sign of this, with it having hit its late March highs above 1.09 against the dollar before paring gains.
Obviously there is still two weeks to go until the second round of voting and while Macron looks highly likely to succeed, the populist vote has surprised us in the past and may well again. It will be interesting to see whether the same complacency that left us surprised last June – when the UK voted to leave the EU – creeps back into the markets in the coming weeks or if the same caution that spurred the relief rally overnight lingers.
With this week and particularly today looking a little quiet on the economic calendar – barring the ECB meeting on Thursday and a couple of other releases – we're likely to see focus remain on the situation in France and Le Pen's efforts to prove the pollsters wrong. As was the case in the Netherlands, the first round of voting will be seen as a success for those seeking the status quo in the eurozone and with the AfD in Germany standing little chance in September, a similar result in two weeks may see the region survive the year unscathed. Assuming, of course, we don't see elections in Italy.
Aussie Trading On A Stronger Footing This Morning
For the 24 hours to 23:00 GMT, the AUD rose 0.13% against the USD and closed at 0.7535 on Friday.
LME Copper prices declined 0.2% or $10.5/MT to $5601.0/MT. Aluminium prices declined 0.03% or $0.5/MT to $1932.5/MT.
In the Asian session, at GMT0300, the pair is trading at 0.7552, with the AUD trading 0.23% higher against the USD from Friday’s close.
The pair is expected to find support at 0.7519, and a fall through could take it to the next support level of 0.7486. The pair is expected to find its first resistance at 0.7579, and a rise through could take it to the next resistance level of 0.7606.
With no economic releases in Australia today, investor sentiment would be governed by global macroeconomic factors.
The currency pair is trading above its 20 Hr and 50 Hr moving averages.

Activity In The Euro-Zone’s Manufacturing And Services Sector Surged To A 6-Year High Level In April
For the 24 hours to 23:00 GMT, the EUR declined 0.11% against the USD and closed at 1.0701 on Friday, amid concerns over the outcome of first round of voting in French presidential elections.
Earlier in the session, the Euro gained ground after robust manufacturing and services sector data in the Euro-zone highlighted a strong start to the second quarter, amid buoyant demand and strong growth in the region's employment.
The Euro-zone's flash Markit manufacturing PMI unexpectedly advanced to a level of 56.8 in April, expanding at its fastest pace since April 2011, compared to a level of 56.2 in the prior month. Markets were anticipating the PMI to drop to a level of 56.0. Moreover, the region's preliminary Markit services PMI surprisingly rose to a six-year high level of 56.2 in April, defying market consensus for a fall to a level of 55.9 and following a reading of 56.0 in the previous month.
Other economic data indicated that the region's seasonally adjusted current account surplus expanded to a level of €37.9 billion in February, following a revised surplus of €26.1 billion in the previous month.
Elsewhere, activity in Germany's manufacturing sector slowed to a level of 58.2 in April, compared to a level of 58.3 in the prior month. Markets were anticipating the PMI to fall to a level of 58.0. Further, the nation's services sector growth eased more-than-expected to a level of 54.7 in April, compared to market expectations of a fall to a level of 55.5. In the previous month, the PMI had registered a level of 55.6.
In the US, data indicated that the preliminary Markit manufacturing PMI unexpectedly eased to a seven-month low level of 52.8 in April, confounding market expectations of a rise to a level of 53.8, thus offering further sign that the world's largest economy was losing momentum. The PMI had recorded a reading of 53.3 in the prior month. Also, the nation's services PMI registered an unexpected drop to a level of 52.5 in April, hitting its lowest level in seven-months. The PMI had recorded a level of 52.8 in the previous month, while investors had envisaged for a rise to a level of 53.2.
On the other hand, the nation's existing home sales rebounded more-than-anticipated by 4.4% on monthly basis in March, surging to its highest level in more than ten years. Markets expected existing home sales to gain 2.2%, after recording a revised drop of 3.9% in the prior month.
In the Asian session, at GMT0300, the pair is trading at 1.0838, with the EUR trading 1.28% higher against the USD from Friday's close, after the centrist candidate, Emmanuel Macron, won the first round of the French presidential election, reducing the risk of an anti-establishment shock in the final round.
The pair is expected to find support at 1.0712, and a fall through could take it to the next support level of 1.0587. The pair is expected to find its first resistance at 1.0931, and a rise through could take it to the next resistance level of 1.1025.
Going ahead, investors will look forward to Germany's Ifo expectations and business climate indices for April, slated to release in a few hours. Additionally, in the US, the Dallas Fed manufacturing activity index for April and the Chicago Fed national activity index for March, both scheduled to release later today, will be on investor's radar.
The currency pair is trading above its 20 Hr and 50 Hr moving averages.

UK’s Retail Sales Deteriorated In March
For the 24 hours to 23:00 GMT, the GBP declined 0.09% against the USD and closed at 1.2795 on Friday, after disappointing retail sales data in Britain suggested that consumers are reigning in their spending amid a spike in inflation.
Data indicated that UK's retail sales declined more-than-expected by 1.8% on a monthly basis in March, compared to a revised advance of 1.7% in the prior month, whereas market participants anticipated for a fall of 0.5%.
In the Asian session, at GMT0300, the pair is trading at 1.2790, with the GBP trading slightly lower against the USD from Friday's close.
Overnight data showed that the nation's Rightmove house prices rose 1.1% on a monthly basis in April, after registering an advance of 1.3% in the prior month.
The pair is expected to find support at 1.2754, and a fall through could take it to the next support level of 1.2718. The pair is expected to find its first resistance at 1.283, and a rise through could take it to the next resistance level of 1.287.
The currency pair is showing convergence with its 20 Hr and 50 Hr moving averages.

Japanese Yen Trading Lower In The Asian Session
For the 24 hours to 23:00 GMT, the USD declined 0.27% against the JPY and closed at 109.07 on Friday.
In the Asian session, at GMT0300, the pair is trading at 110.08, with the USD trading 0.93% higher against the JPY from Friday’s close.
The pair is expected to find support at 109.15, and a fall through could take it to the next support level of 108.23. The pair is expected to find its first resistance at 110.70, and a rise through could take it to the next resistance level of 111.33.
The currency pair is trading above its 20 Hr and 50 Hr moving averages.

Swiss Franc Trading A Tad Higher In The Morning Session
For the 24 hours to 23:00 GMT, the USD declined 0.16% against the CHF and closed at 0.9971 on Friday.
In the Asian session, at GMT0300, the pair is trading at 0.9968, with the USD trading marginally lower against the CHF from Friday’s close.
The pair is expected to find support at 0.9916, and a fall through could take it to the next support level of 0.9863. The pair is expected to find its first resistance at 1.001, and a rise through could take it to the next resistance level of 1.0051.
Amid a lack of economic releases in Switzerland today, trading trend in the CHF is expected to be determined by global macroeconomic events.
The currency pair is showing convergence with its 20 Hr and 50 Hr moving averages.

Canada’s Annual Inflation Slowed In March
For the 24 hours to 23:00 GMT, the USD rose 0.28% against the CAD and closed at 1.3503 on Friday.
The Canadian Dollar lost ground, after the consumer price index (CPI) in Canada advanced less-than-anticipated by 1.6% YoY in March, affirming the central bank's view that a recent rise in inflation was temporary. In the previous month, the CPI had advanced 2.0%, whereas markets expected for a gain of 1.8%. Meanwhile, on a monthly basis, the CPI rose less-than-estimated by 0.2% in March, compared to a similar rise in the prior month. Market expectation was for the CPI to advance 0.4%.
In the Asian session, at GMT0300, the pair is trading at 1.3487, with the USD trading 0.12% lower against the CAD from Friday's close.
The pair is expected to find support at 1.3453, and a fall through could take it to the next support level of 1.342. The pair is expected to find its first resistance at 1.3522, and a rise through could take it to the next resistance level of 1.3558.
The currency pair is showing convergence with its 20 Hr and 50 Hr moving averages.

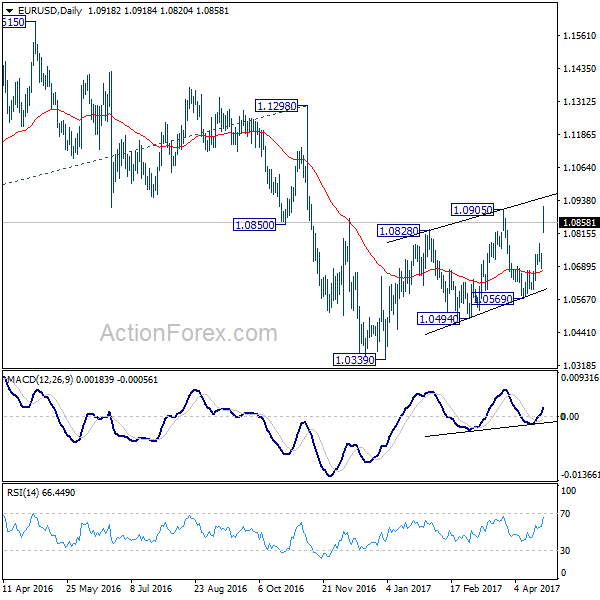
EUR/USD Daily Outlook
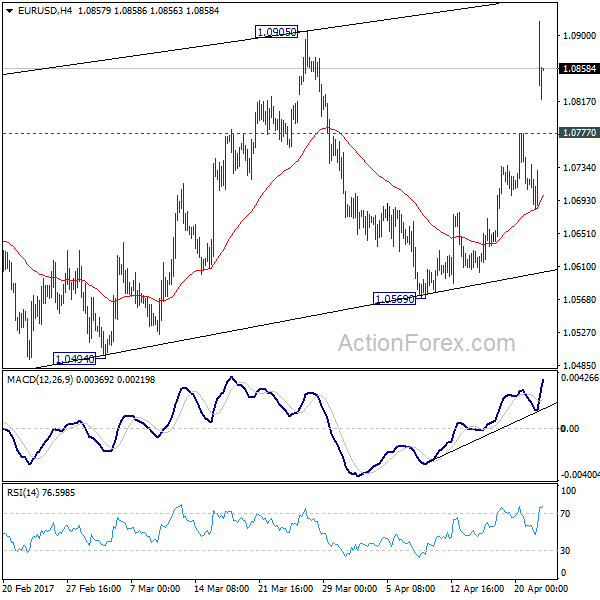
Daily Pivots: (S1) 1.0692; (P) 1.0715 (R1) 1.0747; More....
EUR/USD surges to as high as 1.0918 so far today. Breach of 1.0905 resistance indicates resumption of the choppy rise from 1.0339. And intraday bias is turned to the upside. At this point, such rise from 1.0339 is still seen as a correction. Thus, we'd pay attention to topping signal above 1.0905 and below 1.1298 key resistance. On the downside, below 1.0777 minor support will turn bias to the downside for 1.0569 support first.
In the bigger picture, as long as 1.1298 key resistance holds, whole down trend from 1.6039 (2008 high) is still expected to continue. Break of 1.0339 low will send EUR/USD through parity to 61.8% projection of 1.3993 to 1.0461 from 1.1298 at 0.9115. However, considering bullish convergence condition in weekly MACD, break of 1.1298 will indicate term reversal. this would also be supported by sustained trading above 55 week EMA.
USD/CHF Daily Outlook
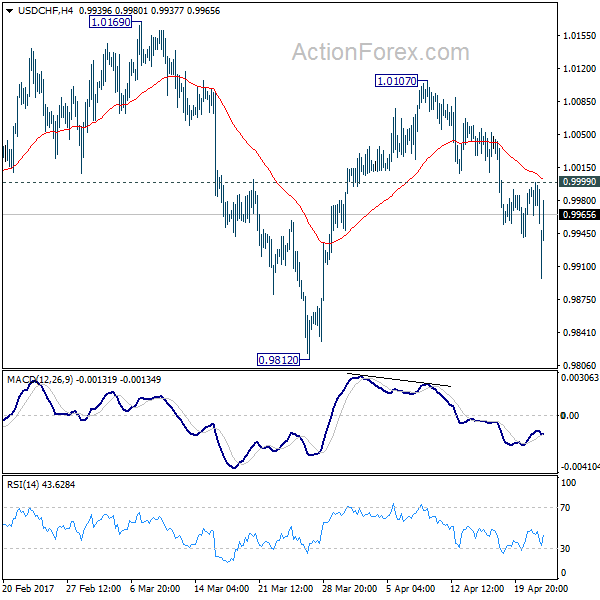
Daily Pivots: (S1) 0.9938; (P) 0.9968; (R1) 0.9985; More.....
USD/CHF's fall resumed by breaking 0.9940 and reaches as low as 0.9897 so far. Intraday bias is back on the downside for 0.9812. Fall from 1.0342 is seen as a correction. Hence, we'll look for bottoming signal below 0.9812. Meanwhile, on the upside, above 0.9999 minor resistance will turn bias back to the upside for 1.0107 resistance instead.
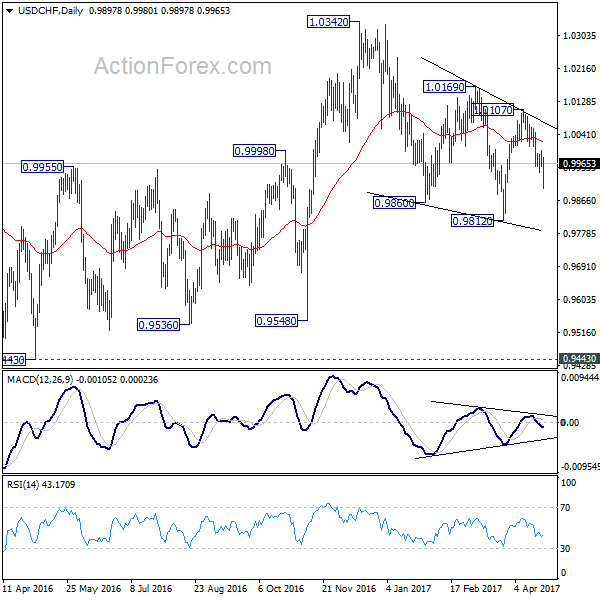
In the bigger picture, we're still maintaining that firm break of 1.0342 key resistance is needed to confirm underlying bullish momentum in the cross. However, the corrective nature of the fall from 1.0342 is starting to give the medium term outlook a bullish favor. Hence, in stead of looking for topping signal around 1.0342, we'd now pay closer attention to upside acceleration as USD/CHF approaches this level again.