Sample Category Title
EUR/JPY Daily Outlook
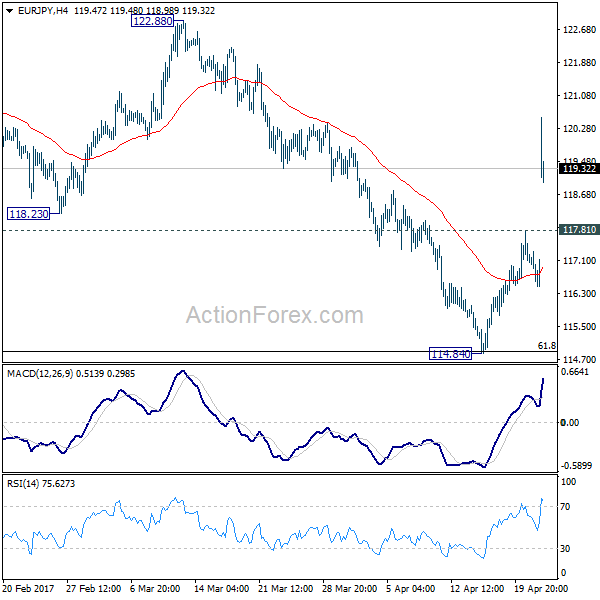
Daily Pivots: (S1) 116.52; (P) 116.91; (R1) 117.37; More...
EUR/JPY surges sharply to as high as 120.53 today. The strong break of 118.23 support turned resistance indicates that fall from 124.08 has completed at 114.84 already. Note that firstly, such decline has a three wave corrective structure. And it's contained just by 61.8% retracement of 109.20 to 124.08 at 114.88. Hence, fall from 124.08 to 114.84 is seen as a corrective move. That in turn indicates that rebound from 109.20 is not finished. Intraday bias is turned back to the upside for 122.88 resistance first. Break will extend the whole rise from 109.20 to 126.09 key resistance next. On the downside, though, 117.81 minor support will turn focus back to 114.84 low instead.
In the bigger picture, price actions from 109.20 is still seen as a corrective move for the moment. But current development suggests that the first leg is finished at 109.20, second leg at 114.84. And rise from 114.84 is possibly developing into the third leg. Further rise will now be mildly in favor through 124.08 resistance. Strong break of 126.09 support turned resistance will confirm completion of whole fall from 149.76 at 109.20. In such case, rise fro 109.20 is developing into a medium term move for 141.04 and above.
Euro Jumps Sharply as Pro-Euro Macron Shines in French Election
Euro soars across the broad today as markets are happy with the results of the first round of French presidential election. With 97% of the vote counted, centrist Emmanuel Macron and far-right Marine Le Pen secured 23.9% and 21.4% support respectively. And as generally expected, they will enter the second and final round of the French election, scheduled on May 7. Higher support for Macron is also seen as a sign of solid support for staying with Euro. Meanwhile, after accepting defeat conservative Francois Fillon and leftist Benoit Hamon called their supports to choose Macron over Le Pen. According to recent polls by Ifop, Ipsos and Elabe, Macron would easily beat Le Pen in a head-to-head run-off, by a wide margin.
More in French Election: Macron And Le Pen Enter Final, Euro Soars Across The Board
BoJ to keep policies unchanged this week
BoJ is widely expected to keep monetary policies unchanged this week. Governor Haruhiko Kuroda said last week that it's "premature to discuss in an exact way about exit strategy." Meanwhile, Kuroda also talked down the question of scarcity of assets to purchase. Kuroda noted that "I don't think our monetary policy is constrained by the fact that we have acquired 40 percent of JGBs already, or our balance sheet is about 80 percent of GDP, which is certainly large compared with other central banks." Regarding inflation, he said that it's still around zero percent in Japan and it's a "long way to go" to hit the 2% target.
BoJ will also released the updated quarterly Outlook for Economic Activity and Prices report after the meeting. There are some speculations that BoJ would lower inflation projection for fiscal 2017. In January forecast, BoJ projected core CPI to hit 1.5% yoy in this fiscal year. But core CPI is currently standing at 0.2% yoy in February with weak momentum for price growth. Eyes will also be on whether BoJ would change the inflation forecast for 2018 and 2019, which were projected at 1.7% and 2.0% in January report.
ECB also expected to stand pat
ECB is also widely expected to keep monetary policies unchanged this week. President Mario Draghi warned last week that risks remain tilted to the downside. And "very substantial" accommodation is still needed. Nonetheless, he sounded a bit more relieved that there are "signs" of broadening recovery "across countries and sectors", with a "somewhat brighter global recovery and increasing global trade". Chief economist Peter Praet also noted that time for stimulus exit is yet to come.
Separately, governing council member Ewald Nowotny said that the policy path for 2017 is "decided". And ECB will "continuing bond purchases at a reduced level and leaving the interest-rate structures as they are." Another member Francois Villeroy de Galhau said that current policies were "fully appropriate" and recovery is "still fragile.
There were some speculations that ECB could lift interest before end of asset purchase. In particular, some members seemed to be concerned with the unknown impact of negative deposit rate. But such talks quickly were quickly cooled by comments from ECB officials in recent weeks.
Other highlights of the week
Elsewhere, there are a number of key economic data to watch. The list includes Australia CPI, US GDP, UK GDP and Japan CPI. Here are some highlights for the week ahead
- Monday: German Ifo business climate; Canada wholesale sales
- Tuesday: UK public sector net borrowing; US house price indices, consumer confidence, new home sales
- Wednesday: Australia CPI; Swiss UBS consumption indicator; Canada retail sales
- Thursday: BoJ rate decision; Swiss trade balance; German Gfk consumer sentiment, CPI, ECB rate decision; US durable goods orders, trade balance, wholesale inventories, pending home sales
- Friday: New Zealand building permits, trade balance; Japan CPI, unemployment rate, industrial production retail sales, household spending; Australia PPI; German retail sales, import prices, Eurozone M3, CPI; Swiss KOF; UK GDP, Canada GDP, IPPI and RMPI; US GDP, Chicago PMI
EUR/JPY Daily Outlook
Daily Pivots: (S1) 116.52; (P) 116.91; (R1) 117.37; More...
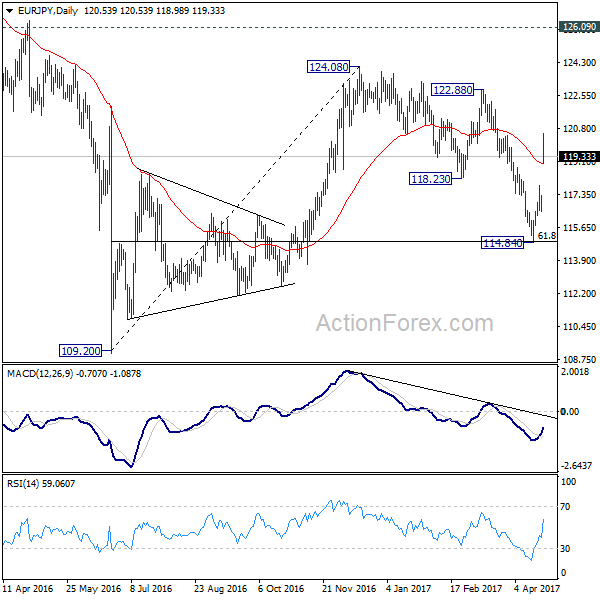
EUR/JPY surges sharply to as high as 120.53 today. The strong break of 118.23 support turned resistance indicates that fall from 124.08 has completed at 114.84 already. Note that firstly, such decline has a three wave corrective structure. And it's contained just by 61.8% retracement of 109.20 to 124.08 at 114.88. Hence, fall from 124.08 to 114.84 is seen as a corrective move. That in turn indicates that rebound from 109.20 is not finished. Intraday bias is turned back to the upside for 122.88 resistance first. Break will extend the whole rise from 109.20 to 126.09 key resistance next. On the downside, though, 117.81 minor support will turn focus back to 114.84 low instead.
In the bigger picture, price actions from 109.20 is still seen as a corrective move for the moment. But current development suggests that the first leg is finished at 109.20, second leg at 114.84. And rise from 114.84 is possibly developing into the third leg. Further rise will now be mildly in favor through 124.08 resistance. Strong break of 126.09 support turned resistance will confirm completion of whole fall from 149.76 at 109.20. In such case, rise fro 109.20 is developing into a medium term move for 141.04 and above.
Economic Indicators Update
| GMT | Ccy | Events | Actual | Forecast | Previous | Revised |
|---|---|---|---|---|---|---|
| EUR | First Round of French Presidential Election | |||||
| 23:01 | GBP | Rightmove House Prices M/M Apr | 1.10% | 1.30% | ||
| 08:00 | EUR | German IFO - Business Climate Apr | 112.4 | 112.3 | ||
| 08:00 | EUR | German IFO - Expectations Apr | 105.9 | 105.7 | ||
| 08:00 | EUR | German IFO - Current Assessment Apr | 119.2 | 119.3 | ||
| 10:00 | GBP | CBI Trends Total Orders Apr | 6 | 8 | ||
| 12:30 | CAD | Wholesale Sales M/M Feb | -0.90% | 3.30% | ||
| 13:00 | CNY | Conference Board Leading Index Mar | 1.20% |
Market Morning Briefing: Euro Has Zoomed On The Back Of A Re-ignited Risk Appetite Following The First Round Of...
STOCKS
Dow (20547.76, -0.15%) has immediate weekly support near 20370-20350 levels which could be possibly tested in the coming sessions. Thereafter a rise back towards 20600-20700 is possible in the longer run.
Dax (12048.57, +0.18%) is trading higher while support near 11930 holds. It could either start moving up from current levels towards 12200 or re-test lower levels of 11930 in which case there could be some sideways consolidation for the coming sessions.
Shanghai (3122.63, -1.59%) could test 3100 or a little lower before bouncing back from there in the near term. Immediate trend is bearish.
Nikkei (18870.24, -1.34%) opened with sharp gap up above levels of 18600 re-entering into the broad sideways channel of 18600-19700. In case it holds, we could possibly see a rise towards 19200 before coming off from there.
Nifty (9119.40, -0.19%) is trading within the immediate daily channel and while support near 9100 holds, we could see some movement along the daily trend support in the 9250-9100 region. A break below 9100, if seen could take it lower towards 9000-8900 in the longer run.
COMMODITIES
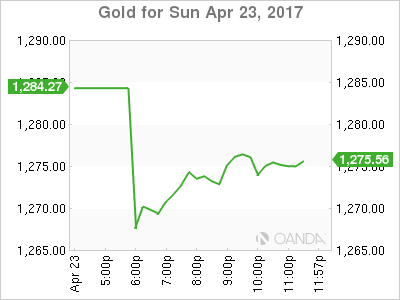
We were expecting 1260-65 levels for Gold (1274.79) due to its near-term overbought condition, and today it is trading at 1275. We have been expecting 1260 to hold for some time as buyers are taking every dip as a further opportunity for buying. 1301 could be a level where the price action has to be checked to assess the chances of further bounce to 1328 to 1350 levels. only a close below 1260 could negate the bullish sentiment.
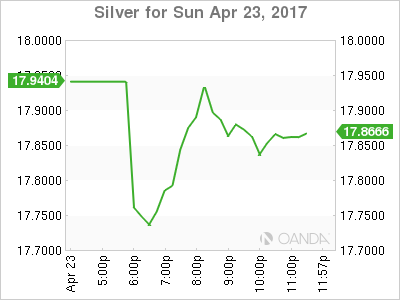
We were also expecting Silver (17.85) to be corrected till 17.70 since last 4-5 days and today silver is trading close to those levels. We think that the corrective phase could be restricted till 17.60-70 levels due to near term oversold condition. Only a close below 17.60 could bring further lower levels of 17.43 levels into consideration.
Nothing new to add as Copper (2.565) has been stuck in the range of 2.50-2.66. A close below 2.50 could open up 2.48 and 2.45 levels respectively. Gradual buying at 2.45-48 levels can't be ruled out due to near term oversold condition. Only above 2.66, higher resistances of 2.72 -80 can come into consideration.
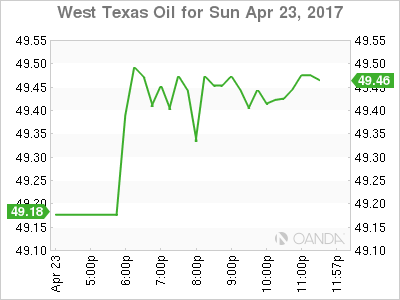
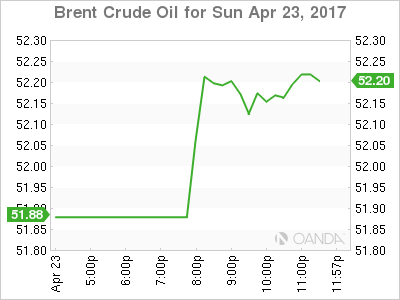
We were bearish on WTI (49.85) and we had mentioned that "Brent may consolidate within these levels (52.20-53.60)for few more sessions though the possibility of a decline towards supports can't be ruled out, but a close below 50.30 could drag WTI towards 48.36 levels'. We will remain bearish while Brent (52.22) and WTI are trading below 53.60 and 50.30 levels respectively.
FOREX
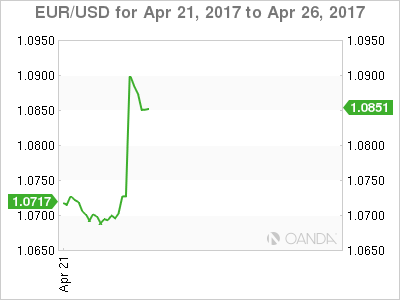
Euro has zoomed on the back of a re-ignited risk appetite following the first round of the French Presidential Election. However, it may turn out to be more of a relief rally rather than genuine strength for Euro. On the other hand, the chances of Euro making a significant top and Dollar creating a significant bottom today can't be ruled out.
Dollar Index (99.30) is at a very crucial juncture now as it has tested our downside target/support of 99.20-10 and shows the initial possibility of a larger degree correction coming to an end, though pending confirmation. The current sharp bounce is in line with expectations and the recovery may well take Dollar to 100.20-50 in the next few sessions.
Euro (1.0829) has overshot our upside target of 1.0820 by a huge margin to register a high at 1.0920 today but the rise may be over for now and a gradual decline to 1.0700 or even lower may be seen in the near term.
Pound (1.2787) is trading quietly in the narrow range of 1.2750-1.2900 as expected but it may test the major support of 1.2600 in the near term.
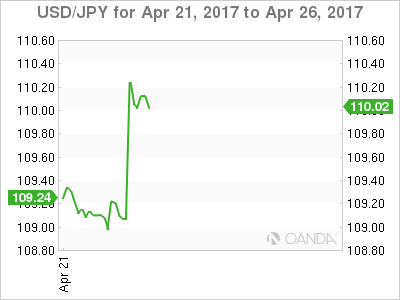
Dollar-Yen (110.07) is currently testing the resistance of 110.10 which is the make or break level in the near term. A successful break above 110.10 may push the pair up to 111.50-112.00 but a failure at the current levels can keep it in the range of 108.00-110.00. Prefer to wait and watch with slightly bullish bias.
Aussie (0.7555) remains in a horizontal mode in the range of 0.7450-0.7600 which may continue for another week.
Dollar-Rupee (64.62) looks potentially bullish towards 65.00/20 but could trade within the 64.30-64.80 region for a few more sessions before that. Resistance near 64.70/80 could be re-tested a couple of times before finally breaking on the upside.
INTEREST RATES
The US yields are trading higher and could move up slightly in the coming sessions before pausing. The 5Yr (1.84%), 10Yr (2.31%) and the 30yr (2.96%) are trading higher from previous levels of 1.77%, 2.25% and 2.91% respectively. The 30Yr could test 3% while the 10yr could face some rejection from levels near 2.35%.
The US-Japan 10Yr (2.29%) rose back above 2.25% resistance and while that holds, a rise towards 2.33% is possible which could indicate that Nikkei and Dollar-Yen could move up in the next 2-3 sessions.
The UK-US 10yr (-1.28%) has fallen sharply from levels below the long term channel resistance and could indicate that the upside for Pound could be limited in the near term.
The German-US 2Yr (-2.05%) and the 10Yr (-2.06%) have fallen sharply from resistance levels and could come off this week bringing down Euro with itself.
Safe Havens Sink Post Election
Macron's win sees investors and traders returning to risk assets.
PRECIOUS METALS
Asia's open saw gold drop $20 on safe haven liquidation, following Macron's win in the 1st round French presidential voting. Gold traded as low as 1265.50 from a 1284 close in New York before rallying back to the 1272 level.
With geopolitical uncertainty now subsiding globally at a rate of knots, for now, the way lies clear for a possible deeper correction in gold after multiple failures in the 1285/1295 region. Barring a massive surprise from Ms Le Pen in the 2nd round, the intricacies of the French presidency and legislature elections will fade from meaningfully affecting the price of precious metals going forward.
Gold's present level is 1274 with 1272 nearby a daily support and an intraday pivot. Resistance lies at 1284 with support at 1260 below and then 1255, the 200-day moving average.
Silver suffered much the same fate as gold. Dropping from a 17.9300 close to as low as 17.6250 this morning. However, its rebound has been much more constructive, trading at 17.8500 as we speak. This may have been due to silver's price action being more negative late last week when compared to golds, and thus long positioning had been reduced more than gold already.
Silver has support at today's low at 17.6250 and then 17.3600 the 100-day moving average.
Resistance sits at 17.9300 and the 18.0000, the 200-day moving average.
CRUDE OIL
WTI spot has rallied at 0.5% this morning, partially unwinding Friday's 2% sell-off in both it and Brent. A Macron victory in France has reduced uncertainty, but an OPEC/non-OPEC working group recommending an extension to the production cut deal has probably had the greater influence.
The reality is though that the world is awash in oil, and the Baker-Hugh's Rig Count's mandatory rise on Friday for the 14th consecutive week shows that U.S. shale isn't going away at these levels. Barring supply disruptions or geopolitical events, and with shale producers still heavy futures sellers on any rally, sustained rallies could be difficult ahead of late May's OPEC/Non-OPEC meeting.
Today WTI spot trades at 49.50 with resistance at 50.00 and support at 48.50, its 200-day moving average.
Brent spot trades at 52.20 with resistance at 53.00 and support at 50.80, its 200-day moving average.
French Election: Macron And Le Pen Enter Final, Euro Soars Across The Board
With 97% of the vote counted, Emmanuel Macron and Marine Le Pen would enter the second and final round of the French election, scheduled on May 7. The election result of the first round came in largely as projected in opinion polls. Yet, the market was thrilled with the EURUSD soaring to the highest level in 5 months, rallying as much as +2% at one point. Indeed, the strength in the single currency was broadly based. EURJPY jumped more than +3% before retreat while both EURGBP and EURCHF have risen over +1%.DJIA futures also soared, reflecting improving sentiment.
Markets relieved as Macron Shone
The market was relieved as Macron is believed to have higher chance to win eventually and thus a Frexit referendum could be avoided. Besides, the market reaction also reflected how tight the race was. The market refrained from relying on opinion polls as the supports for major candidates were close and the percentage of undecided voters was high. Meanwhile, the predictive power of opinion polls has be doubtful after the surprising results of Brexit referendum and US presidential election
Melenchon failed despite recent surge
Securing 23.9% and 21.4% of the votes respectively, independent centrist Macron and far-right populist Le Pen are confirmed to enter the runoff early next month to fight for presidency. They were followed by scandal-hit Francois Fillon who got 19.9%. Despite a late surge in polls, Jean-Luc Melenchon failed to excel further with 19.6%. As we mentioned previously, he would not be able to draw much more votes from his closest political rival, Benoit Hamon, who got 6.3% of votes (we forecast "around 6%"). Total votes for the leftist camp also fell within our projection of 25-30%. Turnout for this year is 78.3%, slightly lower than 79.48% in 2012.
Macron called for "rally against nationalist"
Speaking to his supporters after the election, Macron suggested that "the face of French political life" has been changed in a year. He pledged to bring together the French people and called for the "rally against nationalist". Le Pen described the outcome as "an act of French pride, that of a people who are raising up their heads, that of a people sure of their values and confident of the future". Le Pen affirmed herself as "the candidate for the people" with the "survival of France" at stake.
Fillon and Hamon support Macron after defeat
Accepting failure, Fillon called for his supporters to choose Macron over Le Pen. Hamon made the same request in Tweeter, noting "J'appelle à battre le plus fortement possible le Front national en votant pour Emmanuel Macron, même s'il n'appartient pas à la gauche". Their rationale is to prevent a far-right extreme party from taking control of the government. Recent polls by Ifop, Ipsos and Elabe signaled that Macron would beat Le Pen in the runoff with over 60% of vote. Yet, we advise to act cautiously and expect high volatility in the financial markets from now through to the election day.
Euro Jumps as Macron, LePen Advance
One thing we haven't heard often in the past year was "the polls were right" but that was exactly what unfolded on Sunday in France as Macron and Le Pen won the first round of the election. The euro opened nearly 200 pips higher at the open with yen tumbling. CFTC positioning data showed few GBP shorts getting cleared out despite last week's jump. The Premium EURAUD long was closed for 240-pip gain, EURUSD long remains 205 pips in the green and EURJPY was stopped out at 190-pip loss.
The final tally isn't yet in but Macron and Le Pen will be in the final round of the Presidential election on May 7. The final results show Macron at 23.8% and Le Pen at 21.6% as of 0:56 am France Time at 95.6% participation. As the earliest numbers rolled in, Fillion conceded and threw his support behind Macron. There had been a slight chance he would stay mum or support Le Pen. Other candidates also endorsed Macron for the final round.
This result was as much a win for pollsters as for Macron. Despite many surveys showing him and Le Pen ahead, the market was cautious after Brexit and Trump. The same pollsters show Macron with a 20-point lead in the final round.
We warned last week that fears in the market were overstating a black swan scenario and the jump in the euro at the open underscored that. It climbed to as high as 1.0937 – a jump of more than 200 pips. EUR/JPY climbed nearly 400 pips.
Expect to see profit taking in fairly short order. Those moves are too big and the same types of fears may start to infect the second round. We will be watching the European open very closely for another surge of volatility. Also note that a finish above 1.0864 would be the best since November.
Commitments of Traders
Speculative net futures trader positions as of the close on Tuesday. Net short denoted by - long by +.
EUR -22K vs -19K prior JPY -30K vs -35K prior GBP -99K vs -106K prior CHF -14K vs -10K prior AUD +43K vs +45K prior CAD -33K vs -32K prior NZD -15K vs -15K prior
The squeeze after Theresa May called the election certainly caught a few people on the wrong side but it wasn't a full-scale rush to the exits.
EUR/USD Gaps Up as Macron, Seen as the Stable Option, Wins First Round of French Election Voting
The first round of French Election voting has been completed and markets have been able to finally exhale.
We now know that it will be Emmanuel Macron and Marine Le Pen that will face off in the second round of voting in two weeks time, as they came one and two in Sunday's run off election.
As you can see from the below results, Macron and Le Pen have taken out the first round, with Macron clearly in front:
Macron is now expected to beat Le Pen more comfortably in the second round of voting come the 7th of May, with forex markets pricing the result in well and truly in advance.
This is because both the Socialist and the Republican candidates have asked their voters to vote for Macron in the run-off vote as they all have a common view that Le Pen's far right policies are a risk to the Republic.
As traders, the Macron result means that risk is on as a vote for Macron is seen as a vote for stability.
Taking a look at the markets, this is EUR/USD in in initial aftermath:
EUR/USD 5 Minute:
Markets are happy!... BUT. Haven't we been here before? What's the saying about doing the same thing twice and expecting a different result?
So just keep in mind that markets are happy for now, but lets not get too far ahead of ourselves as traders. Our job is to manage risk and the risk of the biggest move is most definitely against the expected Macron second round win with a huge repricing to the short side in EUR/USD.
Do you remember this from our French Election and its Effect on Forex Markets blog?
"There are two rounds of voting and the first round winners don't always end up taking power. Three in the last eight Presidential Elections have been won by the runner up from the first round and storming home."
That doesn't exactly fill me with confidence. Not to mention that fact that neither Macron or Le Pen are members of established parties.
There are just so many unknowns to come!
Taking a wait and see approach as we assess the fallout and head into the second round of voting looks to be the intelligent play if you're holding flat. Are you as risk averse in your trading as I am? Do you see opportunity in the midst of the fallout? Let us know by mentioning @VantageFX on Twitter and sharing your chart.
EUR/USD Daily:
The Daily shows both the horizontal support levels that price is bouncing between, as well as the EUR/USD 4 hourly trend line support level that price really used to kick higher off of. If you follow the Vantage FX blog then you would have liked that one and certainly be sitting pretty right now!
French President Marcon, in Waiting
EURUSD soared to a five-month high on the French election results as the two principal candidates (Macron and LePen) advance to the second round. The euro traded higher than expected, but with the betting line leading 90% for a Marcon win in the second run-off, the euro bulls were in command early.
Volumes soared on the EURUSD as both short hedges unwound and investors clamoured for top side exposure. Flow has been completely dominated by EUR and EUR crosses, but with the ECB later this week there may be some apprehension to chase this move higher,
Also, there could be a stutter step that may temper the EURUSD from moving much higher, given the looming second round of elections, and on its face, we could start to see greater risk premiums build.
With the European political risk fading to the background, at least until round two, the markets will quickly pivot to President Trump and tax reform after US President unexpectedly said on Friday at a Treasury Department event that there would be "a big announcement on Wednesday having to do with tax reform."
All in all, a very organised market this morning with liquidity stable from 5 AM Singapore onwards.
USDJPY
EURJPY which traded above 120.40 from 116.95 Friday has pulled USDJPY higher above 110.60, and we've seen real selling out of Tokyo, as the initial view that the move was a bit overdone with risk is still wobbly.
Outside of euro crosses, where volumes are still much higher, the market has been relatively tame.
Eco Data 4/24/17
[php_everywhere] [/php_everywhere]
EURUSD: Recovers, Threatens Further Upside Pressure
EURUSD: With the pair retaining its upside pressure, more strength is expected. Resistance comes in at 1.0750 level with a cut through here opening the door for more upside towards the 1.0800 level. Further up, resistance lies at the 1.0850 level where a break will expose the 1.0900 level. Conversely, support lies at the 1.0650 level where a violation will aim at the 1.0600 level. A break of here will aim at the 1.0550 level. All in all, EURUSD faces further bear threats.