Sample Category Title
EUR/GBP Weekly Outlook
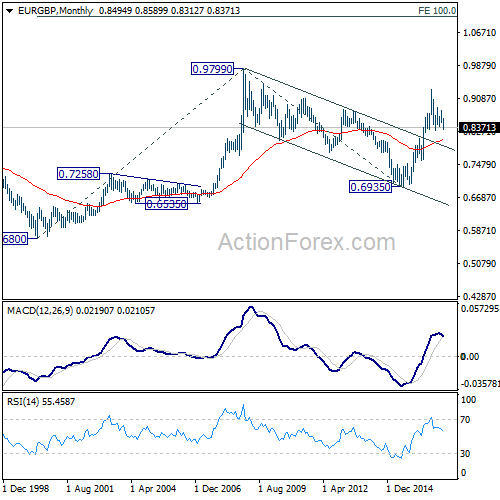
EUR/GBP dropped sharply to as low as 0.8312 last week but formed a temporary low ahead of 0.8303 low and recovered. Nonetheless, the development still suggests that larger correction from 0.9304 is resuming and further fall is expected through 0.8303 low ahead.
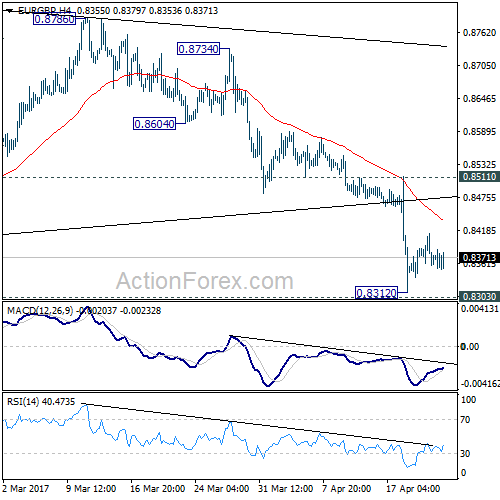
Initial bias in EUR/GBP is neutral this week for consolidation above 0.8312 temporary low first. Upside of recovery should be limited by 0.8511 resistance and bring another decline. Below 0.8303 will extend the fall from 0.9304 to 0.8116/20 cluster support. As decline from 0.9304 is seen as a corrective move, we'd expect strong support around 0.8116/20 to contain downside and completion such correction. Meanwhile, on the upside, break of 0.8511 will turn bias back to the upside for 0.8786 resistance instead.
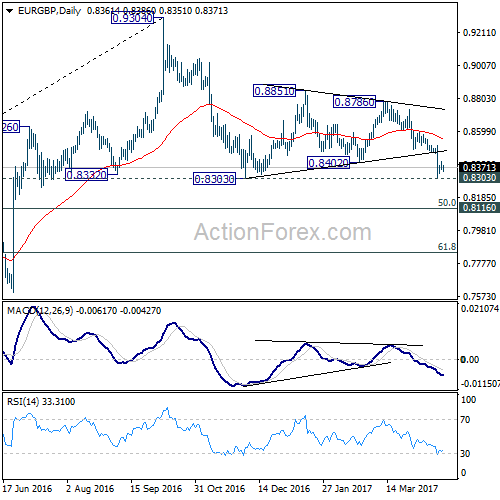
In the bigger picture, price actions from 0.9304 are viewed as a medium term corrective pattern. Such decline is likely ready to resume and should make a new low below 0.8303. At this point, we'd expect strong support from 0.8116 cluster support (50% retracement of 0.6935 to 0.9304 at 0.8120) to contain downside. Rise from 0.6935 (2015 low) will resume at a later stage to 0.9799 (2008 high). However, sustained break of 0.8116 could bring deeper decline to next key support level at 0.7564 before the correction completes.
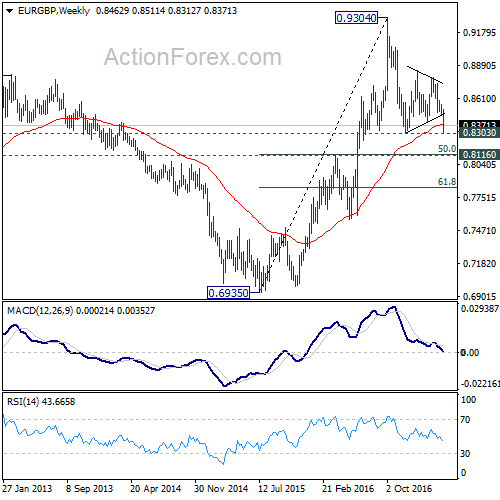
In the long term picture, firstly, price action from 0.9799 (2008 high) is seen as a long term corrective pattern and should have completed at 0.6935 (2015 low). Secondly, rise from 0.6935 is likely resuming up trend from 0.5680 (2000 low). Thirdly, this is supported by the impulsive structure of the rise from 0.6935 to 0.9304. Hence, after the correction from 0.9304 completes, we'd expect another medium term up trend to target 0.9799 high and above.
EUR/AUD Weekly Outlook
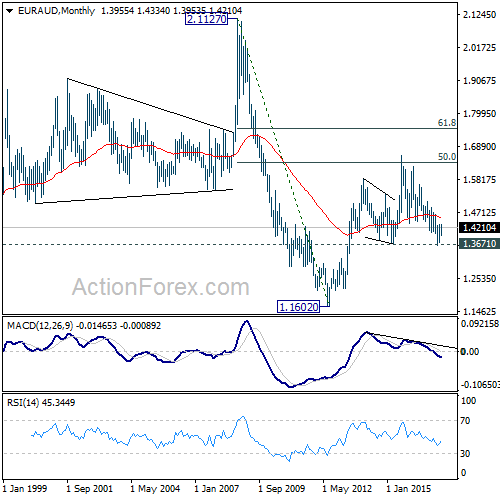
EUR/AUD surged to as high as 1.4334 last week and the break of 1.4309 resistance indicates resumption of whole rebound from 1.3624. The development also affirm the case of trend reversal after defending 1.3671 key support. While some consolidations would be seen in near term below 1.4334 first. Further upside is expected in EUR/AUD ahead.
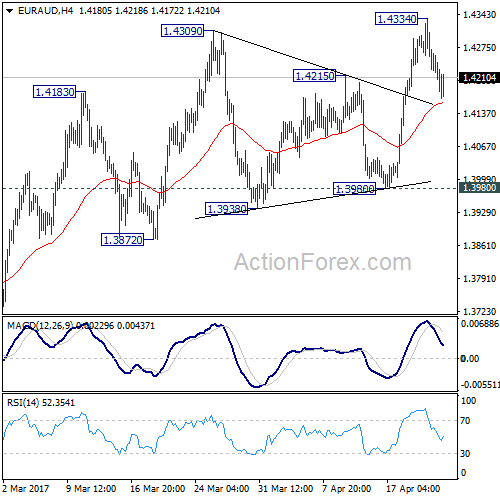
Initial bias in EUR/AUD remains neutral this week for consolidation below 1.4334 temporary top. Downside of retreat should be contained well above 1.3980 support and bring another rally. Above 1.4334 will turn bias to the upside for 1.4721 key resistance level next. Decisive break there will confirm our bullish view of trend reversal.
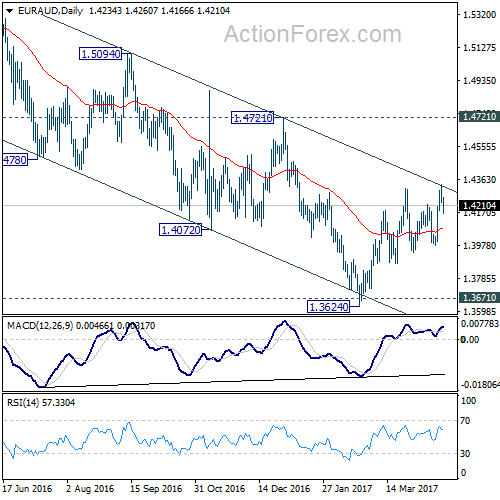
In the bigger picture, price actions from 1.6587 medium term top are viewed as a corrective pattern. Such correction could be completed after defending 1.3671 key support. Break of 1.4721 cluster resistance (38.2% retracement of 1.6587 to 1.3624 at 1.4756) should confirm this case and target 61.8% retracement at 1.5455 and above. Overall, we'd expect the up trend from 1.1602 to resume later. However, sustained break of 1.3671 will invalidate our bullish view and would turn extend the fall from 1.6587 towards 1.1602 long term bottom.
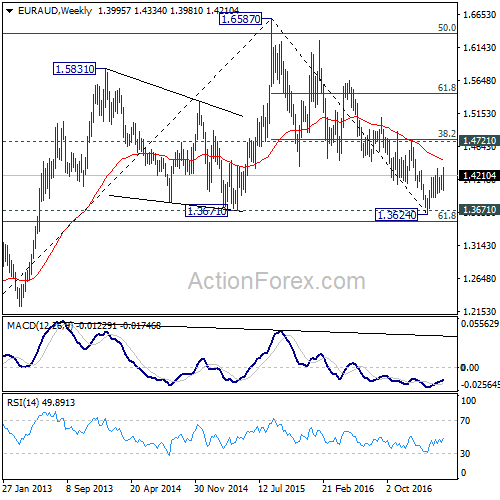
In the longer term picture, the rise from 1.1602 long term bottom isn't over yet. We'll keep monitoring the development but there is prospect of extending the rise to 61.8% retracement of 2.1127 to 1.1602 at 1.7488 and above. However, sustained trading below 1.3671 should confirm trend reversal and target 1.1602 long term bottom again.
EUR/CHF Weekly Outlook
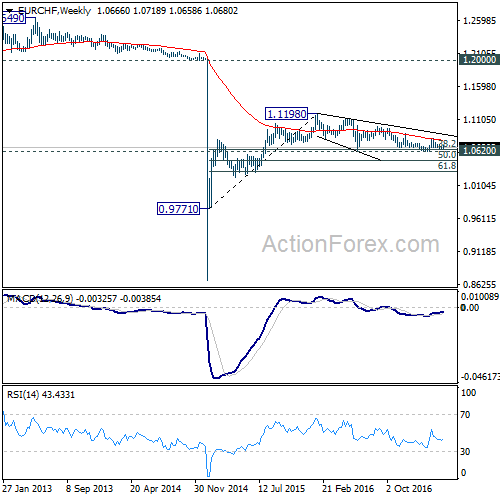
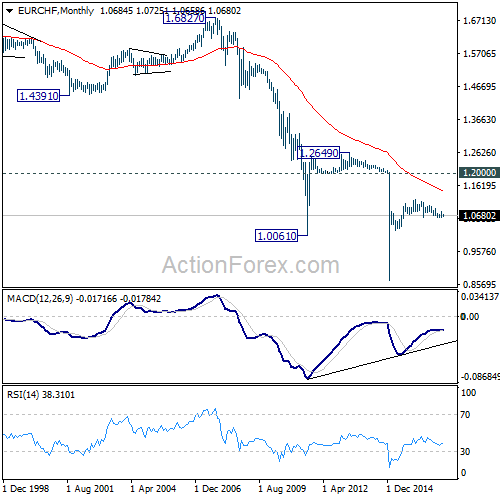
EUR/CHF recovered to 1.0718 last week but reversed ahead of 1.0725 resistance and weakened. The development dampened the bullish reversal case and argue that more consolidations would be seen in near term.
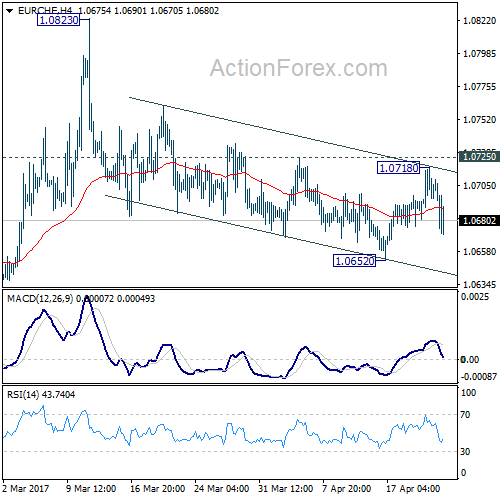
Initial bias in EUR/CHF is neutral this week first. Below 1.0652 will extend the choppy fall from 1.0823 to 1.0620/1.0629 support zone. Without downside acceleration, the structure of the fall from 1.0823 is corrective in nature. And hence, we'd be cautious on bottoming at this 1.0620/29 support zone. On the upside, break of 1.0725 will suggest near term reversal and turn bias back to the upside for 1.0823 resistance.
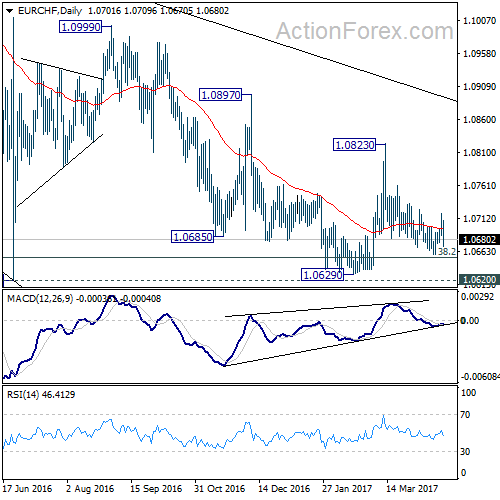
In the bigger picture, the decline from 1.1198 is seen as a corrective move. Such correction might not be completed yet. And, sustained trading below 38.2% retracement of 0.9771 to 1.1198 at 1.0653 will target 50% retracement at 1.0485. In any case, break of 1.0823 resistance is needed to be the first indication of reversal. Otherwise, deeper fall is still expected even in case of recovery.
Summary 4/24 – 4/28
Monday, Apr 24, 2017
[php_everywhere] [/php_everywhere]
Tuesday, Apr 25, 2017
[php_everywhere] [/php_everywhere]
Wednesday, Apr 26, 2017
[php_everywhere] [/php_everywhere]
Thursday, Apr 27, 2017
[php_everywhere] [/php_everywhere]
Friday, Apr 28, 2017
[php_everywhere] [/php_everywhere].
Eco Data 4/28/17
[php_everywhere] [/php_everywhere]
Eco Data 4/27/17
[php_everywhere] [/php_everywhere]
Eco Data 4/26/17
[php_everywhere] [/php_everywhere]
Eco Data 4/25/17
[php_everywhere] [/php_everywhere]
The Weekly Bottom Line
HIGHLIGHTS OF THE WEEK
United States
- Investor sentiment remained relatively upbeat this week on constructive economic data, positive earnings reports, and hopes for near-term pro-growth policies.
- Still, safe-haven assets remained in demand, supported by rising geopolitical tensions and anxiety over the first round of the French presidential election this Sunday.
- Overall, economic data has been coming in relatively healthy, both in the U.S. and other advanced economies, but the dichotomy between soft and hard data is hard to miss. This is particularly the case for the U.S. where survey data surged while hard data suggest that economic growth largely fizzled out in the first quarter. Having said that, some convergence appears to be in the offing.
Canada
- The Canadian housing market made headlines yet again this week with another strong gain in both home prices and sales in March, mostly driven by hot conditions in the Greater Golden Horseshoe Area.
- Interest rates are not going to be the instrument to cool housing activity. The consumer price report this week showed a dip in inflation in March, supporting the view that the central bank will be on hold at least until next year, despite a pick-up in economic activity in recent months.
- Rather, the Ontario government has stepped in with a pack of 16 policy measures aimed at cooling demand, tackling the supply shortage and promoting affordability. The biggest of the measures include a 15% nonresident tax and the expansion of rent control to all rental units. Combined, these two measures are likely to take some steam out of sales and prices in the near-term.
UNITED STATES - HARD AND SOFT DATA BEGINNING TO CONVERGE
Market sentiment remained relatively sanguine this week. Equities in the U.S. were supported by a string of positive earnings reports and hopes for near-term pro-growth policies. Treasury Secretary Steven Mnuchin indicated that tax reform is "pretty close," helping lift spirits of investors who in recent weeks began to question the Trump reflation trade. Sentiment was also supported by robust growth in China at the start of 2017, with the economy growing by 6.9% (y/y) during the first quarter. Oil prices tanked this week on a large build in gasoline inventories in the U.S. while the dollar remained range bound - neither helped nor hurt by this week's FOMC speeches from across the hawk-to-dove spectrum, with George, Rosengren, Kaplan, and Kashkari expressing their views prior to the blackout period which begins on Saturday. Generally, safe-haven bonds remained in good demand, with long-term Treasury yields hovering around 2.2% or nearly 40 basis points lower than their mid-March nadir.
The bid for safe assets is at least partly related to rising geopolitical tensions on the Korean Peninsula and in the Middle East. There is also plenty of anxiety over the French election, which has been further heightened after yesterday's terrorist attack on French police. Polls suggest that a populist candidate, whether Le Pen or Mélenchon, is in good position to make it through to the second round but unlikely to clinch the runoff election. And even if so, there is still a long-road ahead before any referendum on the EU is even considered (see our French election preview).
Populist candidates have been boosted by weak economic growth and high unemployment in Europe. But, the economic data has been coming in better as of late. Reports this week confirmed the constructive data flow. Inflation advanced by a decent 1.5% (y/y) in March, while both consumer confidence and Eurozone PMIs surprised to the upside. At 56.7, the preliminary April composite PMI suggests growth carried into the second quarter after a good start to the year. Having said that, any survey data should be taken with a grain of salt, given the increasingly diverging performance of hard and soft indicators recently.
The hard-soft split is perhaps nowhere as apparent as in the U.S. where measures of consumer and business confidence surged while economic growth appears missing, with first-quarter tracking a meagre 0.5%. However, data released this week suggests that some convergence may be in the offing. Both the Philly and Empire indexes, which track activity across the Mid-Atlantic region, pulled back from their lofty levels recently (see Chart 1), while initial claims and housing activity remain very healthy – home sales reached a decade high in March as permits and starts continued to grind higher.
How exactly the convergence will manifest will be of utmost importance both for Fed policymakers and investors alike. Many among the FOMC expect to raise rates twice more this year. But, should the soft data weaken and converge closer to what the hard indicators are suggesting, two more hikes may not be an achievable target. On the other hand, should hard data trend higher, the Fed may be more anxious to raise rates, and may even begin the process of reducing their large balance sheet.
CANADA - HOPEFUL FOR FOOLER HOUSING MARKET CONDITIONS
The Canadian housing market made headlines again this week with another strong gain in both home prices and sales in March, mostly driven by hot conditions in the Greater Golden Horseshoe Area (it's not just the GTA anymore!). Home prices were up by 32% year-over-year in the Greater Toronto Area and by almost 40% in some surrounding areas such as Durham, Barrie, Welland and St. Catherines.
While these gains are a sweet deal for current homeowners, it is becoming increasingly more difficult for would-be first-time homebuyers to jump into the market. Moreover, every month of double-digit home price growth brings with it a risk of a deeper correction down the road. In the absence of policy intervention, there was nothing on the economic docket in 2017 to slow this train. In particular, five-year mortgage rates fell 10 basis points during the first two weeks of April, giving back a third of the increase experienced since Trump's election in November. Meanwhile, despite a pick-up in Canadian economic growth over the first quarter of 2017, this week's Canadian inflation report supported the view that the Bank of Canada will remain on hold at least until 2018. Overall consumer price inflation dipped to 1.6% (year-on-year) in March, from 2.0% in the prior month and all of the central bank's preferred measures of inflation fell short of the Bank's 2% target (Chart 1).
So, the Ontario government decided to step in this week, with a package of 16 new policy measures aimed at cooling demand in the Golden Horseshoe, addressing Ontario's housing shortage and promoting affordability. Some of the measures were tied to improved oversight of real estate agents, rental agreements, tax evasion, speculation and the municipal building permitting process. But, there were some big-ticket items in the package, including a 15% non-resident buyer's tax (with exceptions for students, those seeking permanent residency and refugees), the extension of rent control to all rental units, lowering of taxes on purpose built rentals and some monetary incentives to encourage building, the opening up of provincial vacant land for new home development and giving municipalities the right to tax vacant homes and land (of which Toronto is likely to implement).
These policies are likely to dampen housing activity in the short-term. Using Vancouver as a guide, the non-resident buyer's tax may push both non-resident and domestic speculators out of the market, bringing home sales across Ontario more in line with historical averages. Meanwhile, rent controls will put pressure on already depressed rates of return on rental properties, and prices will likely have to adjust lower to encourage further investment. As such, we have revised our housing forecast for Ontario and the GTA lower over 2017 and 2018 (Chart 2) to reflect these changes, and are now expecting a moderate correction in the average home price next year. Over the long-term, the mix of policy offers some incentives for increased housing supply. But, our view is that the overriding impact of rent control will be to restrict future investment in both condo and purpose-built rental development.
Overall, Ontario's move will help buy some time in the near-term while the Bank of Canada remains on hold for a while longer. But the longer-term challenge of housing supply will remain even in light of this week's efforts.
USDCAD Elliott Wave View: Ending 5 Wave Impulse
Short term Elliott wave view in USDCAD suggest that the cycle from 4/13 low (1.3218) is unfolding as an impulsive Elliott wave structure . This 5 wave move could be wave ((a )) of an Elliott wave zigzag structure structure or wave ((c )) of FLAT correction. In either case, after 5 wave move ends, pair should pull back in 3 waves at least as the Elliott Wave Theory suggests. Minutte wave (i) ended at 1.3337 peak, Minutte wave (ii) ended at 1.3261, Minutte wave (iii) ended at 1.3498, Minutte wave (iv) pullback ended at 1.3455 low and above from there Minutte wave (v) of ((a)) already reached the minimum extension area between 1.3509-1.3527 which is the inverse 1.236-1.618% Fibonacci extension area of proposed wave (iv) dip. This means cycle is now mature and can end at any moment resulting in a 3 wave pull back at minimum. The pull back is shown to be wave ((b)) and should correct the cycle from 4/13 low in 3, 7 or 11 swings. If the decline turns out to be stronger than expected and breaks the pivot at 1.3218 low, that would suggest 5 wave move up from 1.3218 low was a B wave FLAT from 3/21 (1.3261) low and pair could then see 1.3252 - 1.3187 area before bouncing again. Although Minutte wave (v) of ((a)) has reached the minimum extension area, another high towards (v) = (i) target @ 1.3571 can't be ruled out to end wave ((a)) cycle from 4/13 low. In either case, cycle from 4/13 (1.3218) low is mature and should result in a pull back soon.
USDCAD 1 Hour Elliott Wave Chart