
Sample Category Title
Trade Idea : EUR/USD – Target met and stand aside
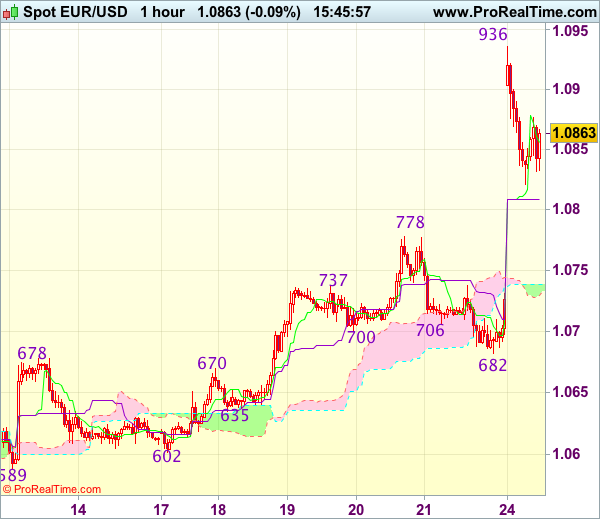
EUR/USD - 1.0857
Most recent candlesticks pattern : N/A
Trend : Near term up
Tenkan-Sen level : 1.0849
Kijun-Sen level : 1.0809
Ichimoku cloud top : 1.0739
Ichimoku cloud bottom : 1.0733
Original strategy :
Bought at 1.0690, met target at 1.0790
Position : - Long at 1.0690
Target : - 1.0790
Stop : -
New strategy :
Stand aside
Position : -
Target : -
Stop : -
The single currency did find renewed buying interest at 1.0682 (we recommended to buy at 1.0690 and a long position was entered there) and the pair opened sharply higher today, indicated upside target at 1.0790 was met as price surged to as high as 1.0936 before retreating, suggesting consolidation below this level would be seen and pullback to the Kijun-Sen (now at 1.0809) cannot be ruled out, however, reckon previous resistance at 1.0778 would contain downside and bring another rise later. Above 1.0900-05 would bring retest of 1.0936 but break there is needed to extend recent rise to 1.0975-80 and possibly towards 1.1000.
As we have taken profit on our long position entered at 1.0690, would not chase this rise here and would be prudent to stand aside in the meantime. Below previous resistance at 1.0778 (now support) would defer and risk weakness to the Ichimoku cloud (now at 1.0733-39) but support at 1.0682 should remain intact, bring rebound later.
Foreign Exchange Market Commentary: EUR/USD, USD/JPY, GBP/USD,AUDUSD, GBPCAD, GOLD, WTI CRUDE, DJIA, FTSE100, DAX
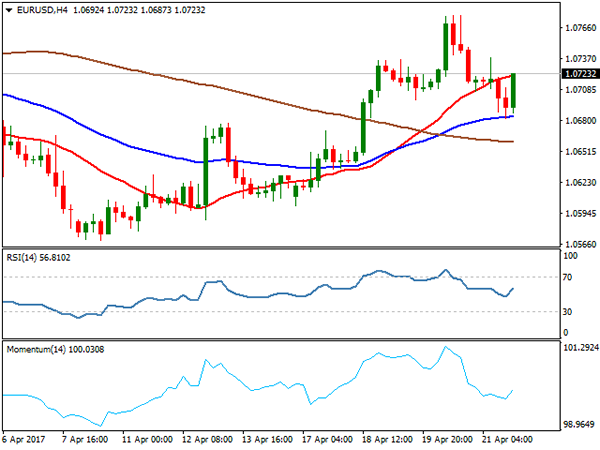
EUR/USD
The EURUSD ended Friday's trading above important 1.0700 support which was dented on spike to 1.0682, low of the day. The pair ranged between 1.0682 and 1.0736 on Friday, showing strong indecision ahead of the first round of French presidential election. The action remained capped by daily Kijun-sen line during past four days, with brief probe at 1.0776, being short-lived.
Setup of technical studies on daily chart was mixed on Friday, with the pair awaiting results of election for direction signal.
Scenarios see extension below the first pivot at 1.0677 (daily Tenkan-sen), through thin daily cloud at 1.0640 and possible extension to 1.0600 higher base in bearish scenario.
At the upside, break through Kijun-sen barrier at 1.0738 and weekly high at 1.0777 would accelerate above round-figure resistance at 1.0800, through 1.0838 (200SMA) and may spike towards 1.0906 (Mar 27peak).
Support: 1.0700, 1.0682, 1.0657, 1.0640
Resistance: 1.0738, 1.0777, 1.0800, 1.0826
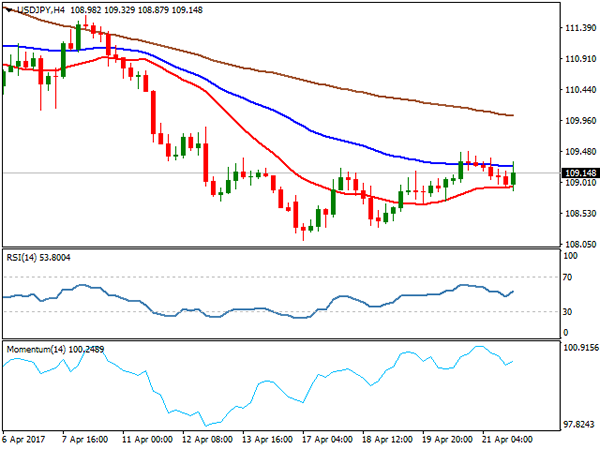
USD/JPY
The EURUSD ended Friday's trading above important 1.0700 support which was dented on spike to 1.0682, low of the day. The pair ranged between 1.0682 and 1.0736 on Friday, showing strong indecision ahead of the first round of French presidential election. The action remained capped by daily Kijun-sen line during past four days, with brief probe at 1.0776, being short-lived.
Setup of technical studies on daily chart was mixed on Friday, with the pair awaiting results of election for direction signal.
Scenarios see extension below the first pivot at 1.0677 (daily Tenkan-sen), through thin daily cloud at 1.0640 and possible extension to 1.0600 higher base in bearish scenario.
At the upside, break through Kijun-sen barrier at 1.0738 and weekly high at 1.0777 would accelerate above round-figure resistance at 1.0800, through 1.0838 (200SMA) and may spike towards 1.0906 (Mar 27peak).
Support: 1.0700, 1.0682, 1.0657, 1.0640
Resistance: 1.0738, 1.0777, 1.0800, 1.0826
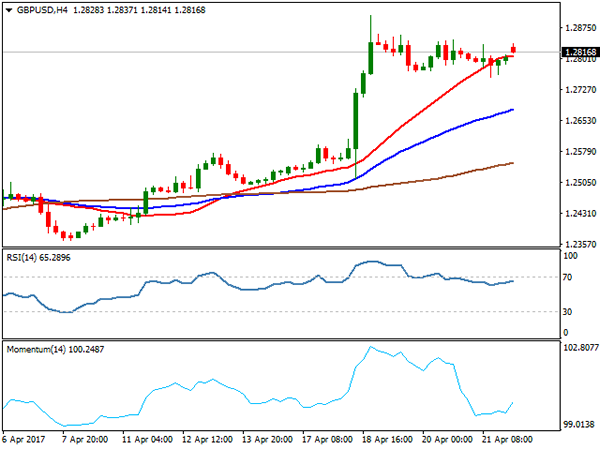
GBP/USD
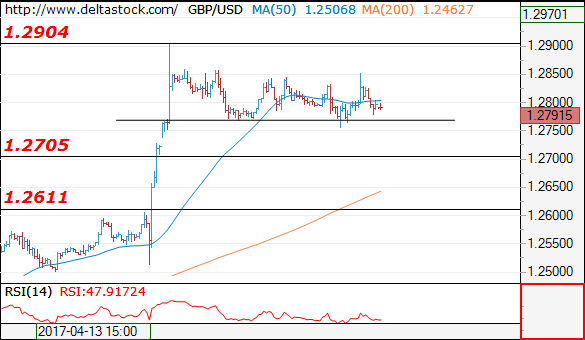
GBPUSD ended trading on Friday in long-legged Doji, signalling strong indecision, as the pair is entrenched in narrowing consolidation in past three days under fresh multi-month high at 1.2905, posted earlier this week.
Initial support at 1.2770 (lows of last Wed/Thu) is still holding, despite Friday's short-lived spike to 1.2755, where extended dip was contained by Fibonacci 38.2% of 1.2514/1.2904 upleg support, keeping the downside attempts limited for now.
However, correction may extend below 1.2700/55 handles, as slow stochastic is generating bearish signal on daily chart on reversal from overbought territory, which may extend below 1.2700 handle and expose rising daily Tenkan-sen support at 1.2654. Otherwise, we may expect further consolidation, before broader bulls resume towards key barriers at 1.2905 and 1.3000.
Support: 1.2770, 1.2755, 1.2700, 1.2654
Resistance: 1.2834, 1.2859, 1.2905, 3000
AUDUSD
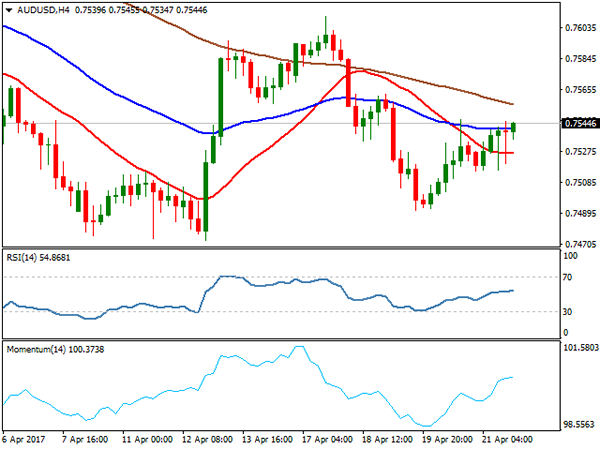
The AUDUSD's near-term action is on the firmer footing after two consecutive bullish days that managed to retrace over 38.2% of 0.7610/0.7492 downleg and close above important barrier at 0.7541 (daily Tenkan-sen line).
Immediate downside risk of returning to key supports at 0.7472 is sidelined for now, as fresh recovery extension above next pivots at 0.7550/65 (200SMA / Fibonacci 61.8% retracement) would generate fresh bullish signal for extended gains 0.7582 (Fibonacci 76.4%) , possibly to attack key near-term barrier at 0.7610 (daily Ichimoku cloud top, reinforced by Kijun-sen line).
Alternatively, return below former pivots at 0.7541/37 (Tenkan-sen / Fibonacci 38.2%) would soften near-term structure and signal that recovery may be running out of steam.
Support: 0.7541, 0.7520, 0.7490, 0.7472
Resistance: 0.7551, 0.7550, 0.7576, 0.7596
GBPCAD
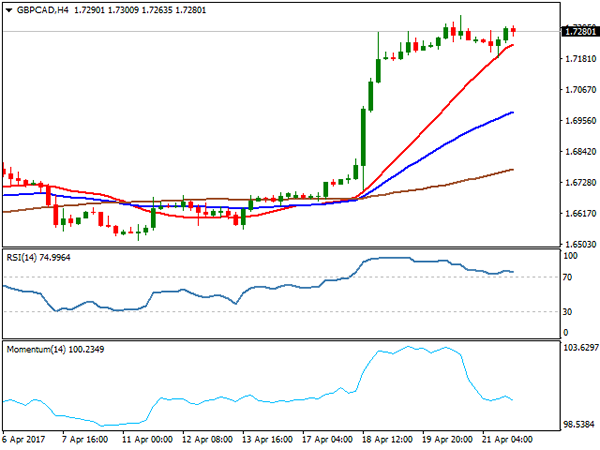
The GBPCAD cross generated strong bullish signal last week's strong rally and weekly close, as the pair hit fresh multi-month high at 1.7340 and stayed just below it after Friday's brief easing.
Strong bullish sentiment for British pound is reinforced by firmly bullish technical studies, which are so far ignoring strongly overbought conditions. However, stronger correction could be anticipated in the near-term, after strong bearish signal will be generated on reversal of daily RSI and slow stochastic from deep overbought territory.
Levels to watch at the downside lay at 1.7145 (Fibonacci 23.6% of 1.6515/1.7340 rally), 1.7078 (broken weekly Ichimoku cloud base) and 1.7024 (Fibonacci 38.2%) which should ideally contain dips.
At the upside, barriers lay at 1.7436 (50% retracement of 1.9127/1.5745 descend) and 1.7524 (Sep 15 high).
Support: 1.7185, 1.7145, 1.7100, 1.7024
Resistance: 1.7300, 1.7340, 1.7436, 1.7524
GOLD
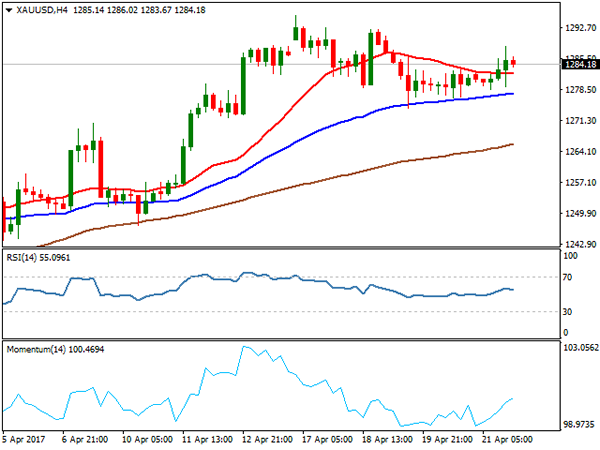
Spot Gold maintained strong bullish sentiment despite weekly close red on Friday (the first bearish weekly close after five straight bullish weeks), as last week's rally cracked important barrier at $1292 (weekly Ichimoku cloud top) on extension to fresh multi-month high at $1295.
Corrective easing was contained at $1275 (Fibonacci 38.2% of $1243/$1295 upleg), keeping intact another downside pivot at $1271 (daily Tenkan-sen line). While these supports hold, near-term focus is expected to remain shifted higher, as bullish technical studies favour final push towards psychological barrier at $1300 and extension above on sustained break.
Support: 1278, 1274, 1271, 1265
Resistance: 1288, 1292, 1295, 1300
WTI CRUDE OIL
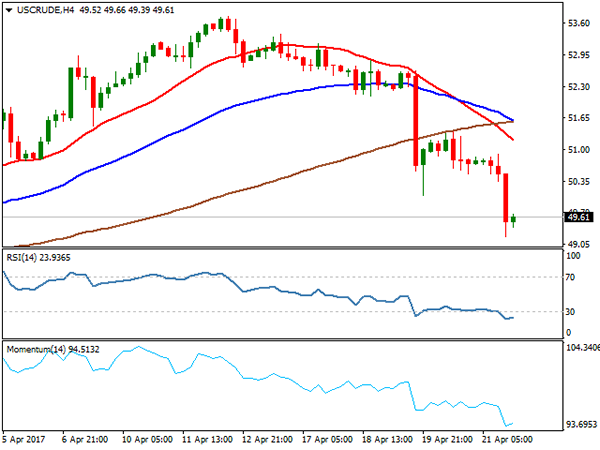
WTI oil closed strongly in red and below psychological $50.00 support on Friday and generated another bearish signal. In addition, strong bearish weekly close after three straight bullish weeks, weighs on near-term action. Bearish sentiment is growing on fears of failure of extending OPEC output cut and increased production of US shale oil that offset bullish impact on oil prices on recent geopolitical tensions.
Daily technical indicators turned south and reinforce bearish pressure, as broken and widening broken daily Ichimoku cloud continues to pressure the price. If the price sustains break below $50.00 trigger, it may extend towards $48.41 (55 SMA), possibly to fully retrace $47.07/$53.74 upleg of further weakness.
To neutralize immediate downside threats, bounce and close above daily cloud top ($51.03) is seen as minimum requirement).
Support: 49.20, 48.64, 48.64, 48.00
Resistance: 50.00, 50.40, 50.74, 51.03
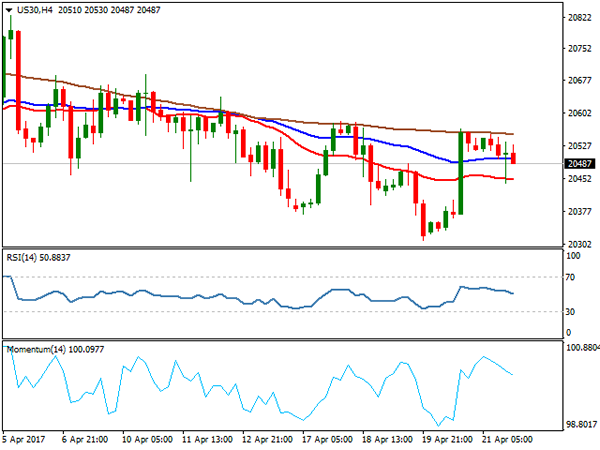
DJIA
Dow Jones closed in red on Friday, failing to capitalize on Thursday's strong recovery that was capped by 20 SMA at 20558, with 20/55SMA's bear-cross that was formed at this zone, further weighs on the market.
Mixed setup of daily MA's shows not clear direction, however, indicators are holding in the negative territory.
On the other side, near-term technical studies remain bullishly aligned, but the action remains limited by thick 4-hr Ichimoku cloud.
Stronger bullish signals could be expected on lift above 20600 (4-hr cloud top) and 20669 (daily Kijun-sen) that will expose key barrier at 20736 (daily cloud top).
Conversely, return below daily cloud base (20385) will be seen as bearish signal, with extension below 20310 (Apr 19 low) to signal continuation of larger pullback from 21160 (Mar1 all-time high).
Support: 20442, 20385, 20310, 20266
Resistance: 20553, 20600, 20669, 20736
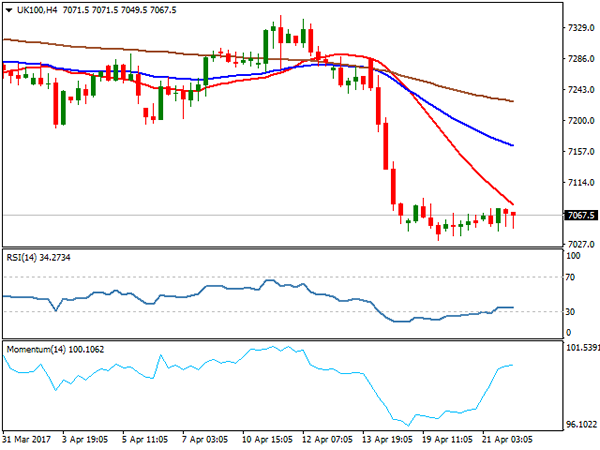
FTSE100
FTSE index ticked higher on Thu/Fri, in extended consolidation above fresh multi-month low at 7032, posted on last e after pound surged on early election news. The price is holding in firm bearish mode and sees limited upside action for now, as strong negative sentiment is maintaining pressure. Strongly oversold studies on daily chart, so far did not produce firmer bullish signals for extended correction, however, such scenario cannot be ruled out.
Break above initial triggers at 7092/7129 (Fibonacci 23.6% and 38.2% retracement of strong 7285/7032 fall last week), would be seen as stronger bullish signals.
Otherwise, the price may spend more time in extended consolidation, before bears resume.
Break below 7032 low would open psychological 7000 support and 6969 (Fibonacci 61.8% of 6675/7444 rally) in extension).
Support: 7032, 7024, 7000, 6969
Resistance: 7077, 7092, 7129, 7149
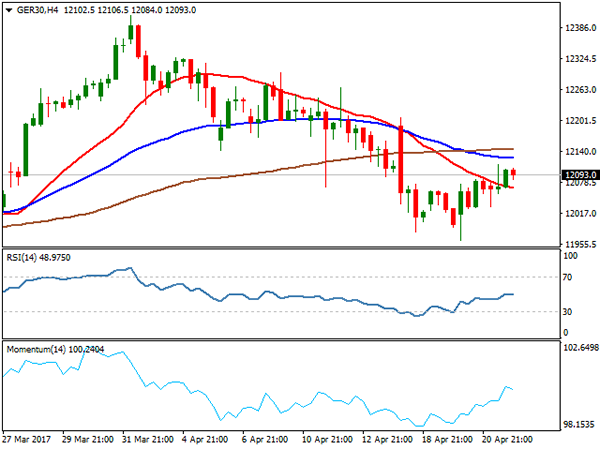
DAX
DAX made the second consecutive bullish daily close on Friday and sidelined immediate downside risk, seen on last week's probe below psychological 12000 support. Recovery is facing strong barriers at 1219/12144 (daily Tenkan-sen / Kijun-sen lines) that formed bearish cross and could limit recovery attempts.
Strong weekly bearish close (the third in a row), continues to weigh) but on the other side, rising daily Ichimoku cloud continues to underpin the action.
Firm break above Tenkan-sen / Kijun-sen pivots would be seen as bullish signal, with extension above 12200 zone needed to confirm reversal.
Conversely, fresh attempts below 12000 handle will be seen as negative signal.
Resistance: 12114, 12129, 12144, 12220
Support: 12030, 12000, 11962, 11878
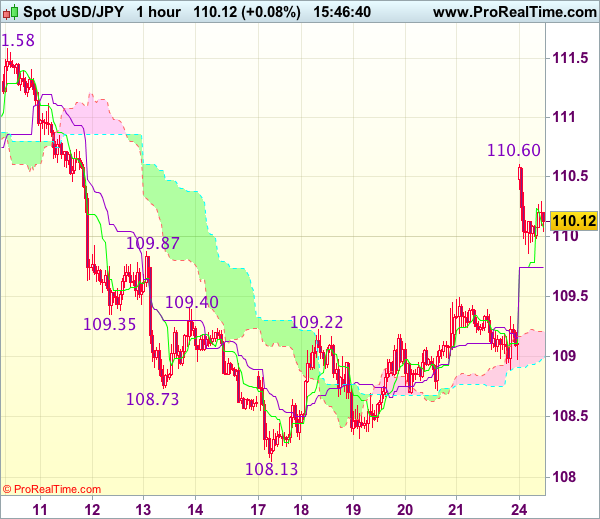
Trade Idea : USD/JPY – Buy at 109.50
USD/JPY - 110.09
Most recent candlesticks pattern : N/A
Trend : Near term up
Tenkan-Sen level : 110.08
Kijun-Sen level : 109.74
Ichimoku cloud top : 109.20
Ichimoku cloud bottom : 108.98
New strategy :
Buy at 109.50, Target: 110.50, Stop: 109.15
Position : -
Target : -
Stop : -
The greenback opened higher today and rallied to as high as 110.60, adding credence to our view that a temporary low has been formed at 108.13 last week and bullishness remains for this move to extend further gain, above said resistance at 110.60 would bring test of 111.00, however, near term overbought condition should limit upside and price should falter well below resistance at 111.58, bring retreat later.
In view of this, would not chase this rise here and would be prudent to buy dollar again on dips as previous resistance at 109.50 should turn into support and limit dollar’s downside, bring another rise later. Below the upper Kumo (now at 109.20) would abort and suggest an intra-day top is formed, bring weakness to the lower Kumo (now at 108.98) first.
French Elections: Macron-Le Pen To 2nd Round
- Macron and Le Pen win first round French elections
- Market horror scenario of Le Pen- Mélenchon run-off avoided
- Macron still likely to win (easily?) the presidency in second round on May 8
- What will parliamentary elections bring? Which government will be formed?
- Outcome positive for risk sentiment, but lingering (modest) tail risk to stay
- Negative Bund, positive OAT's and peripherals; positive euro and Euro equities.
The first round of the French presidential elections caused a lot of suspense in recent weeks as four candidates were, according to the polls, in a neck-to-neck race. Their poll differences were smaller than the error margins. Finally, like the polls suggested, Centrist Macron and Right- wing Le Pen qualified for the second round to be held in a fortnight, with likely the pro-European Union centrist Emmanuel Macron becoming president.
For markets, the following issues are important
First, the horror scenario in which right-wing Le-Pen and Left-wing Jean-Luc Mélenchon would go to the second round is avoided. Both threatened to leave the euro of/and EU and both had a radical anti-market programme.
Second, the result suggests, like the polls, that Macro will win the second round and become president. He beat her, as polls had predicted by about 24% to 21.4% (official, though not yet complete vote tally). A snap poll released after the vote suggest Macron will defeat her by a 20%- point margin in the runoff. An anti Le Pen front is already established with the socialist Hamon, former PM Valls, current PM Cazeneuve, Republican candidate Fillon and many other personalities, lining up behind Macron for the second voting round. However, a small residual risk of a Le Pen election win might still be visible in the markets.
Third, even in case of the likely Macron win in the second round , he is an independent without an established party. This means he will have to find partners to establish a government after the June parliamentary elections. This might cause still problems and eventually make him, in an unlikely worst case scenario, a kind of lame duck. The country may de facto be reigned by other parties. Given the election outcome of today, we suspect that ultimately the next government coalition will be centre-right oriented, as the socialists lost heavily. Please note that these elections also occur in two rounds, which favours the Republicans, the biggest party (Fillon).
Market reactions
The result is positive for the risk sentiment and the initial reaction cross markets was strong, but moves have moderated and partially reversed.
In the bond market, it means there is less need for safe havens. So, it is bearish for German (and other core) bonds, while the spreads of French OATs and peripheral bonds will narrow. The Bund is still closed but the T-Note future fell slight less than 1 point on the outcome, but has recouped 8/32 from the lows. The 10-yr OAT-Bund spread already narrowed on Friday, as some positions were squared, to about 68 bps. However, when European bond markets open, more spread narrowing is likely, maybe to about 50 bps in the next days. Only after the parliamentary elections, it will be clear whether France will get a reform and pro- European Union oriented government. That may fade the tail risk completely.
In the FX markets, the event is euro positive and yen negative. EUR/USD jumped immediately to above 1.09 from about 1.0720 in thin far east trading, but has now reverted to 1.0845. The safe haven yen lost ground versus the dollar (and euro of course) up from about 1.09 to a high of 110.65, but also here some retracement to about 110. More detail about the outlook in our Sunrise report.
Asian equities trade mixed with Japan profiting from the weaker yen, but no euphoria in other markets. Initial gains have been largely lost. European equities should do well.
Currencies: EUR/USD And USD/JPY Show Relief-Rebound After French Election
Sunrise Market Commentary
- Rates: Markets pleased with Macron-Le Pen run off
Risk sentiment is positive overnight after the French election outcome. The Bund opens weaker, putting the German 10-yr yield more comfortably in the 0.2%-0.5% sideways range. French OAT's are expected to outperform. We have a negative bias for the US Note future as well as President Trump promised to unveil his tax cut plan this week. - Currencies: EUR/USD and USD/JPY show relief-rebound after French election
Overnight, the euro showed the expected Pavlov reaction as the first round of the French election turned out market friendly. The yen decline as safe haven positions were reduced. USD/JPY returned north of 110. The risk-on reaction might still continue early today, but we doubt that the election outcome will mark the start of a sustained euro rally.
The Sunrise Headlines
- US equities ended close to unchanged on Friday. Overnight, Asian risk sentiment is positive following the French election outcome. Chinese stocks underperform though as the regulator ordered insurers to focus on risk.
- Emmanuel Macron will go head-to-head against Marine Le Pen in the run-off election to become France's next president. Opinion polls suggest that Macron would beat the stridently anti-EU Le Pen by a wide margin.
- US President Trump says businesses and individuals will receive a "massive tax cut" under a tax reform package he plans to unveil on 'Wednesday or shortly thereafter'.
- Italy's credit rating was cut closer to junk territory on Friday by Fitch, who cited 'weak economic growth' and the country's 'persistent track record of fiscal slippage'. Fitch reduced the rating to 'BBB' (stable) from 'BBB+'.
- The IMF had a sobering message for Greece: Even if the country secures debt relief from its European creditors-a question that is by no means assured with bailout talks still deadlocked-the nation still needs even more painful economic overhauls than currently planned.
- European officials have revived their push for a European Monetary Fund to tackle future crises in the eurozone in place of the IMF, which has yet to say whether it will join the latest Greek bailout.
- Today's eco calendar contains German IFO business confidence. The Belgian debt agency conducts its monthly OLO auction and Fed governor Kashkari is scheduled to speak
Currencies: EUR/USD And USD/JPY Show Relief-Rebound After French Election
Can euro sustain initial post-election gain?
On Friday, Thursday's pro-Europe/France repositioning didn't continue. EUR/USD and USD/JPY held tight ranges respectively in the 1.07 and the 109 area. Investors kept a wait-and-see modus going into the first round of the French elections. The EMU PMI was strong, but ignored.
Overnight, the outcome of the first round of the French election avoided the negative scenario of a runoff in the second round between Marine Le Pen and Jean-Luc Mélenchon. Macron is largely expected to win the second round against Marine Le Pen. This scenario is market friendly. Early in Asia, the result triggered the expected Pavlov reaction with equities, core bond yields and the euro jumping higher. The safe haven yen was sold. However, except for Japan, most regional equities already lost most gains. Chinese equities even show substantial losses on regulator intentions to curb leveraged trading. EUR/USD jumped north of 1.09, but returned part of the initial gain and is currently trading in the 1.0860 area. A similar reaction was visible in USD/JPY (currently trading just north of 110) and EUR/JPY (119.55 area).
Today, eco calendar is thin. The German April IFO business sentiment is the most important release. The market expects a stabilization of the headline figure (112.4). The decline in the German PMI last week (56.3 from 57.1) suggests some risks for a downward surprise. However, we still expect the index to stay at an elevated level. However, the focus FX trading will likely be on the fall-out from the First round of the French presidential election. Overnight, EUR/USD jumped temporary north of the 1.0875/1.0906 recent range top but no sustained break occurred yet. A euro positive momentum at the start of the European session is likely. However, we doubt that this will be the start of a protracted/sustained euro rebound. Key question is whether the European interest rate market already considers the removal of the French political tail risk a good enough reason for the ECB come closer to policy normalisation. At this week's ECB meeting, we don't expect a real positive change in the ECB's assessment. On the US side of the equation, interest rates also discount a mediocre scenario on the US economy and on the potential of the Trump administration to deliver fiscal reforms. So, there is also room for a rebound in US yields . A slightly narrowing of the interest rate differential between the US and Europe is possible short-term, but we don't expect the move to go really far. In this context won't expect EUR/USD to break the 1.10 barrier in a sustained way.
For USD/JPY (and EUR/JPY) the day-to-day momentum will probably be constructive as both cross rates will get support from a risk-on context and from higher core bond yields.
From a technical point of view, USD/JPY broke below the 110 key support. We downgraded our USD/JPY assessment to bearish. Next key support (62% retracement) comes in at 107.18. Today's rebound confirms that a bottoming out process might be in store. However, the pair needs to regain the 112.20 level (neckline ST double bottom) to really improve the technical picture of this cross rate. EUR/USD extensively tested the topside of the MT range (1.0874/1.0906 area) late March, but the test was rejected and EUR/USD returned lower in the 1.0875/1.05 range. The move met support in the 1.06 area and the pair again tested the range top after the French election this morning. We look out how this test turns out, but we are not convinced on a sustained break higher. If EUR/USD would regain the 1.10 barrier next resistance comes in in the 1.1145/1.13 area (US pre/post-election swings).
EUR/USD: testing the 1.0906 range top
EUR/GBP
EUR/GBP returns to the 0.85 area
On Friday, the UK March retail sales declined more than expected, but the damage for sterling was limited. Cable was well bid going into the publication of the report (intraday top of 1.2835) but returned to the big figure after the release. So, for now, soft UK data still have only a modest impact on sterling. Later sterling also ignored hawkish comments from BoE ‘s Saunders. EUR/GBP closed the session at 0.8378 . Cable finished the week at 1.2817.
This morning, the sterling price action was also dominated by the global reaction after the French election. Euro strength prevailed. EUR/GBP jumped to the 0.85 area. Cable lost slightly ground as the dollar gains more from the risk-on repositioning than sterling. Later today, the CBI trends orders will be published. A modest softening from 15 to 12 is expected. Of late, sterling didn't react to much to eco data. The euro reaction to the French elections will remain the main driver for sterling trading. As we don't expect a protracted rebound of EUR/USD, further EUR/GBP gains are also not evident short-term. We had a neutral short-term bias on EUR/GBP. Early last week, EUR/GBP dropped below the bottom of the EUR/GBP 0.84 support, improving the sterling picture. The pair came within reach of the key 0.8305 support (Dec low), but. no real test occurred. After this morning's rebound, the range bottom looks better protected. Longer term, Brexit-complications remain a potential negative for sterling. Of late, this was not the focus of sterling trading. Nevertheless on technical considerations we are inclined to reconsider a cautious EUR/GBP buy-on-dips approach.
EUR/GBP: jumps on French election. 0.83 range bottom looks safe for now
Forex Technical Analysis: EUR/USD, USD/JPY, GBP/USD
EUR/USD
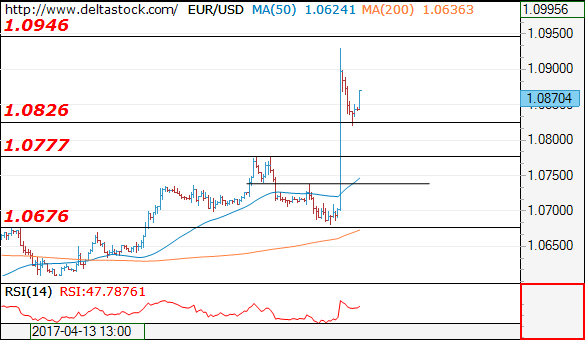
Current level - 10870
The results of the French election's first round led to a massive rise all the way up to 1.0940 resistance area and current pullback is testing 1.0826 support zone, for a further slide towards 1.0780 area. Minor resistance is projected at 1.0870.
| Resistance | Support | ||
| intraday | intraweek | intraday | intraweek |
| 1.0870 | 1.0946 | 1.0826 | 1.0675 |
| 1.0946 | 1.1010 | 1.0780 | 1.0490 |
USD/JPY
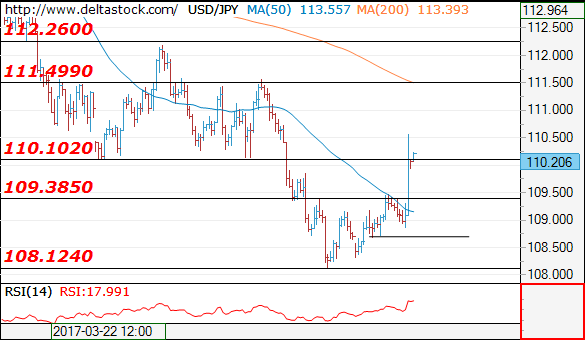
Current level - 110.20
The break through 109.40 hurdle signals a positive outlook, for a further rise towards 111.50 zone. Initial intraday support lies at 110.10, followed by 109.40.
| Resistance | Support | ||
| intraday | intraweek | intraday | intraweek |
| 110.55 | 112.26 | 110.10 | 109.40 |
| 111.50 | 113.50 | 109.40 | 108.12 |
GBP/USD
Current level - 1.2791
The lack of trend dynamics here signals a break through 1.2770, for a dip to 1.2705 support area.
| Resistance | Support | ||
| intraday | intraweek | intraday | intraweek |
| 1.2904 | 1.3000 | 1.2770 | 1.2610 |
| 1.3000 | 1.3500 | 1.2705 | 1.2510 |
In The US, FOMC Member Kashkari (Voter, Dovish) Speaks Tonight
Market movers today
Attention during the first hours of trading wi ll be on the market digesting the outcome of the first round of the French presidential election whi ch was held yesterday. See below in ‘Selected market news'.
In terms of data releases, German ifo expectat ions are published. The figure is at a high level, pointing to strong GDP growth in Germany. The latest move higher reflects primarily better expectations for the manufacturing sector after a couple of years where these expectat ions moved broadly sideways. Looking ahead, we believe the overall expectat ions are likely to move lower, as it is hard to cont inue to expect a further improvement following a period of good news.
In the US, FOMC member Kashkari (voter, dovish) speaks tonight . Market participants will listen carefully for any hints or details on quant itative tightening.
Selected market news
In France, the independent Emmanuel Macron and Front Nat ional's Marine Le P en have come out as the two leading candidates of the first round of the presidential election, with 23.9% and 21.4%, respectively (with 97% of votes counted). Participation at 78% was higher than previously expected, which seems to have benefitted Macron. See French election: Macron vs Le Pen - Short-term implications for Euro and Nordic markets after first election round (24 April) for more details.
The two candidates will face each other in a second runoff on 7 May. It is the first time in modern French history that both candidates from the established part ies (Socialists and Republicans) are absent in the runoff. Macron has consistently been the favourite to win according to second round opinion polls with a relatively steady 60% to 40% lead versus Le Pen. Furthermore, Macron has already received the endorsement from both Fillon and Hamon, as well as some senior conservat ives, France's biggest union and ministers from the current Socialist government .
While the election outcome was roughly in line with prior opinion polls, we st ill could see a short term relief-rally in risk assets. However, given that equity markets have been very complacent about the upcoming French presidential election we do not expect a big move. Instead, equity markets will be back focusing on growth.
In fixed income markets, the Bund sell-off that started last week could take another leg today and cause further German ASW tightening. France is likely to be the top performer in the EGB market today with the rest of the semi-core and periphery also tightening vs Germany.
With the prospect of a euro-sceptic as the next French president now fading, EUR crosses have seen a clear relief rally overnight and EUR/USD init ially jumped to the 1.09 level (from just above 1.07 on Friday). As a Macron win now seems highly likely, Le Pen will need to see a significant surge in the polls to shake the single currency during the runoff over the next few weeks. Hence, we expect EUR/USD to be little changed on this result and still look for the 1.04-1.10 range in 1-3M.
GBPUSD Trading In An Impulse
Cable is making a strong rise away from 1.2364, clearly in impulsive fashion which can see an extension up to 1.3040 area for wave C. In the meantime be aware of short-term set-back which will be seen as fourth sub-wave within an uptrend. We see market in bullish mode now as long as pair trades above 1.2620.
GBPUSD, 4H
New Zealand Dollar Looking Bullish For The Week Ahead
Key Points:
- The technical bias is looking near-term bullish.
- Trade data should see gains extend in the week to come.
- 100 day EMA likely to keep upsides somewhat in check.
The Kiwi Dollar had an interesting week last week and saw some fairly volatile trading despite the broadly bullish trend. As a result, it is worth taking a closer look at what was driving prices and what should be kept in mind as we move forward. In particular, we need to examine what fundamentals could underpin the price action during the coming few sessions.
Starting with last week’s performance, the Kiwi Dollar continued to make steady progress, rallying to 0.7033 following some disappointing US economic news and simultaneously buoyant NZ fundamental figures. Notably, on the US side of things, the respective slips in the Empire State Manufacturing and Philadelphia Federal Manufacturing indices to 5.2 and 22.00 saw selling pressure build during the week, as did the weaker Market Flash Manufacturing PMI result of only 52.8. However, momentum was not solely derived from the US figures as the NZ CPI numbers also saw a sizable uptick of 2.2% q/q which is in stark contrast to the measly 1.3% seen previously.
As for the impending week’s fundamentals, aside from the bevy of US data on offer, there is a handful of NZ –centric news items due out which will be worth watching closely. Namely, the trade numbers are set to be posted on Thursday alongside the nation’s Building Consents which should see some increased volatility during the session. More importantly, however, the Trade Balance is projected to increase to 370M this time around which represents a sizable improvement on the prior posting. As a result, the NZD could build on any early gains made during the week or even reverse any losses stemming from potentially stronger US figures on Tuesday.
As for the technical readings, the NZDUSD should have some bullish sentiment remaining but gains could be capped around the 0.7041 handle. On the one hand, the EMA bias is transitioning to bullish as a result of the recent crossover of the 12 and 20 day averages. Additionally, both the Parabolic SAR and the MACD readings are bullish which should aid in keeping buying pressure in place. However, on the other hand, stochastics are moving into overbought territory and the 100 day EMA is looming nearer which should be an excellent source of dynamic resistance around the 0.7041 mark.
Ultimately, the outlook for the NZD is rather bullish for the week to come, especially if the trade data comes in on target. Even in the case that it doesn’t, if the trend of mixed US numbers continues,the pair’s technical bias should help in pushing it higher which is worth pricing in moving ahead. However, keep the 100 day EMA in mind as it is unlikely that this resistance is broken just yet.
Cable Rallies To Precipitous Position, Which Way Will It Go In The Week Ahead?
Key Points:
- Price action stalls at 1.28 handle.
- RSI Oscillator strongly overbought.
- 1.2754 support zone will need to hold if pair has chance of resuming rally.
The Cable had a tumultuous week as the U.K. Prime Minister, Theresa May, shocked the market with a snap election to strengthen her mandate for a Brexit. This caught the market off-guard and saw the pair rally nearly 200 pips. However, it remains to be seen if it can continue its upward trajectory in the week ahead. Subsequently, we take a look at what occurred and what potentially looms on the horizon for the venerable Cable.
Last week provided some surprises for the market as an announcement from U.K. Prime Minister, Theresa May, called for a snap election to decide the Brexit issue once and for all. The canny May is seeking to bolster her mandate to take the island nation through a hard Brexit. Subsequently, the cable rallied like there was no tomorrow to test the 1.29 handle. However, a range of disappointing data stalled the move, with the U.K. Retail Sales falling to 1.7% y/y (3.4% exp), and the pair subsequently moderated and closed the week out around the 1.2803 mark. The latter part of the week also brought some news from the U.S. that the Trump administration is considering tax cuts which also added to the moderating forces.
Looking ahead, there are some key events looming for the pair in the week ahead with the U.K. Advance GDP and U.S. Unemployment Claims data due out. In particular, the Advance GDP figures are going to be a key focus early in the week with the metric forecast to come in at 0.4% q/q. However, anything is possible given last week’s relatively weak retail sales data which emanated from the United Kingdom. In addition, the U.S. Initial Jobless Claims are also due out and most economists have that figure coming in at 242k. Subsequently, there are quite a few data points that could provide plenty of volatility for the Cable in the week ahead.
From a technical perspective, the Cable’s recent surge has seen it break sharply above the 100MA which suggests that the long term move from 1.2108 has yet to complete. However, the RSI Oscillator is strongly overbought, and the failure to breach 1.29 is likely to suggest a period of moderation. Subsequently, our initial bias for the week ahead is neutral given some of the mounting risks. Support is currently in place for the pair at 1.2754, 1.2625, and 1.2545. Resistance exists on the upside at 1.2844, 1.2904, and 1.3121
Ultimately, the coming week is likely to prove relatively critical for the pair given its current valuation just below the 1.2900 handle. However, if the pair can hold above the 1.2754 zone of support it might allow it to build up some steam for another crack at the April high. In the case of a breach of this level, all bets are off, and you could see the air rapidly deflate from the balloon that is the Cable. Subsequently, there is plenty of risk floating around in the coming days and we will have to wait and see which way it goes.