Sample Category Title
Trade Idea Update: USD/CHF – Stand aside
USD/CHF - 0.9933
New strategy :
Stand aside
Position : -
Target : -
Stop : -
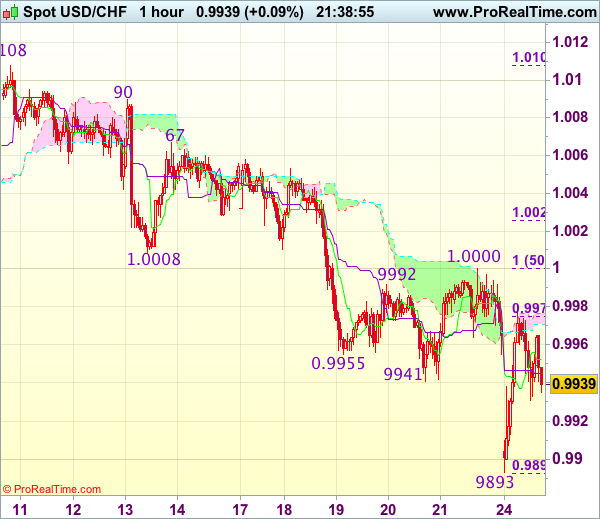
The greenback met renewed selling interest at 1.0000 on Friday and dropped again to as low as 0.9893 earlier today, having said that, the subsequent rebound from there suggests consolidation above this level would be seen and another bounce to 0.9980-85 cannot be ruled out, however, reckon 1.0000 (said resistance and 50% Fibonacci retracement of 1.0108-0.9893) would limit upside and bring another decline later. Below said support at 0.9893 would extend the fall from 1.0108 top to 0.9865-70 (2 times extension of 1.0108-1.0008 measuring from 1.0067) but support at 0.9831 would hold, bring rebound later.
In view of this, would be prudent to stand aside in the meantime. Above previous support at 1.0008 would suggest low is formed instead, bring rebound to 1.0025-30 (61.8% Fibonacci retracement of 1.0108-0.9893) but price should falter below resistance at 1.0067.
Trade Idea Update: GBP/USD – Buy at 1.2710
GBP/USD - 1.2777
Original strategy :
Buy at 1.2710, Target: 1.2850, Stop: 1.2675
Position : -
Target : -
Stop : -
New strategy :
Buy at 1.2710, Target: 1.2850, Stop: 1.2675
Position : -
Target : -
Stop : -
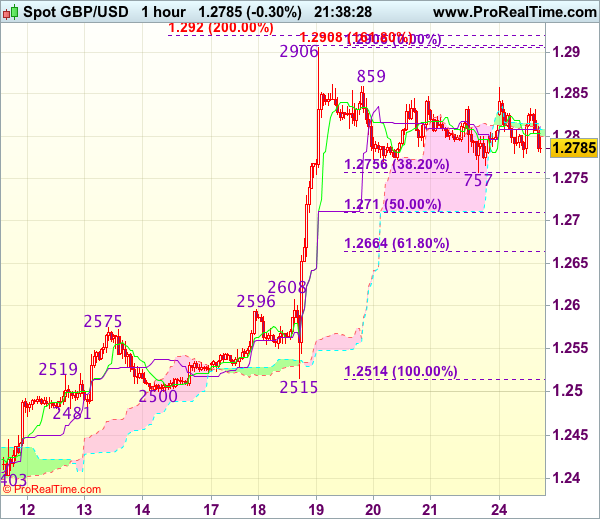
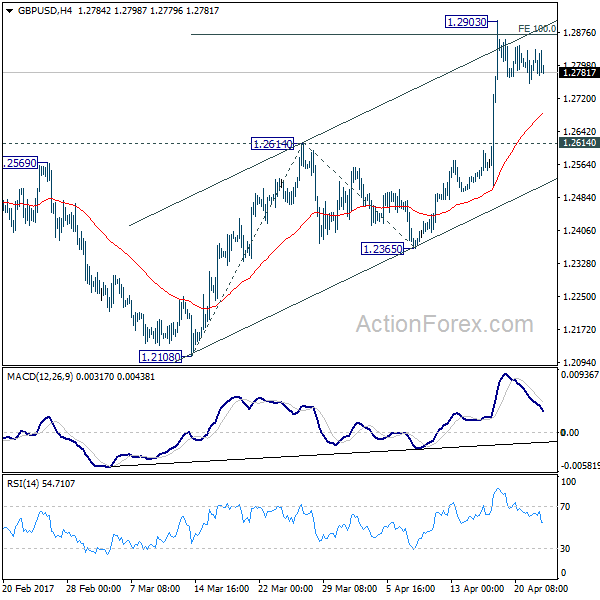
Although cable recovered initially to 1.2858, as price has retreated again again after faltering below resistance at 1.2859, suggesting further consolidation would be seen and another test of Friday’s low at 1.2757 cannot be ruled out, however, reckon downside should be limited to 1.2700-10 (50% Fibonacci retracement of 1.2515-1.2906) and bring another rally, break of 1.2759 would signal the pullback from 1.2906 has ended, bring retest of this level, break there would extend recent upmove to 1.2920-30 (2 times extension of 1.2365-1.2575 measuring from 1.2500), then 1.2950 but loss of near term upward momentum should prevent sharp move beyond 1.2990-00 (1.236 times projection of 1.2109-1.2616 measuring from 1.2365 and psychological resistance).
In view of this, would not chase this rise here and would be prudent to buy cable on subsequent pullback as downside should be limited to 1.2710 (50% Fibonacci retracement of 1.2515-1.2906), bring another rise. Below 1.2700 would defer and signal top has been formed, risk correction to 1.2660-65 (61.8% Fibonacci retracement of 1.2515-1.2906) and price should stay well above 1.2608-16 (previous resistance now support).
Trade Idea Update: EUR/USD – Stand aside
EUR/USD - 1.0870
New strategy :
Stand aside
Position : -
Target : -
Stop : -
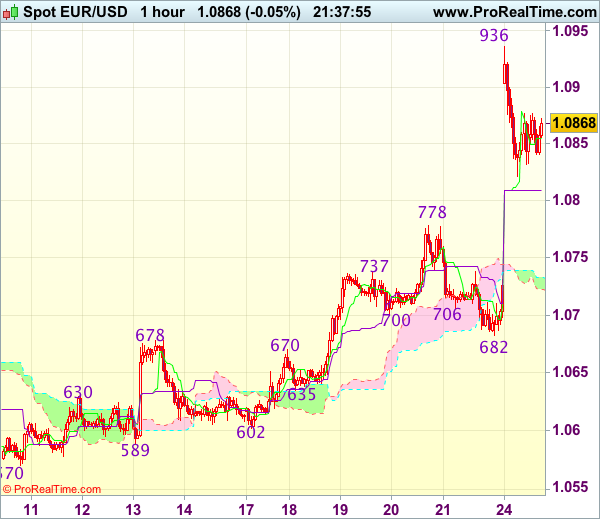
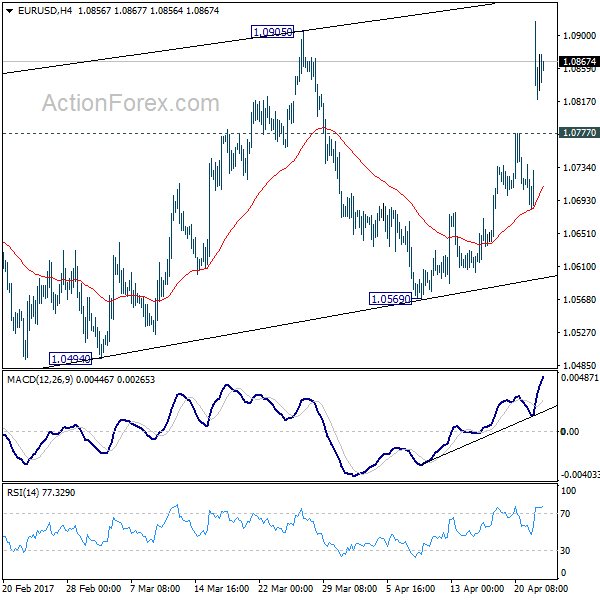
The single currency did find renewed buying interest at 1.0682 and the pair opened sharply higher today, indicated upside target at 1.0790 was met as price surged to as high as 1.0936 before retreating, suggesting consolidation below this level would be seen and pullback to the Kijun-Sen (now at 1.0809) cannot be ruled out, however, reckon previous resistance at 1.0778 would contain downside and bring another rise later. Above 1.0900-05 would bring retest of 1.0936 but break there is needed to extend recent rise to 1.0975-80 and possibly towards 1.1000.
In view of this, would not chase this rise here and would be prudent to stand aside in the meantime. Below previous resistance at 1.0778 (now support) would defer and risk weakness to the Ichimoku cloud (now at 1.0733-39) but support at 1.0682 should remain intact, bring rebound later.
USD/CHF Mid-Day Outlook
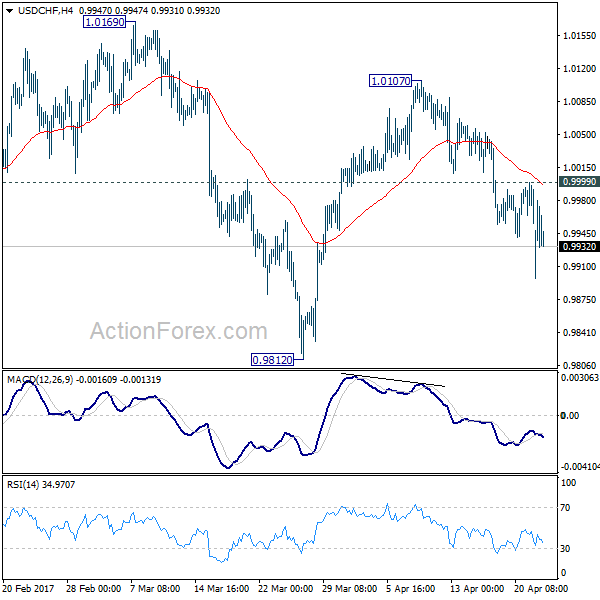
Daily Pivots: (S1) 0.9938; (P) 0.9968; (R1) 0.9985; More.....
Intraday bias in USD/CHF remains on the downside for 0.9812 support and below. Fall from 1.0342 is seen as a correction. Hence, we'll look for bottoming signal below 0.9812. Meanwhile, on the upside, above 0.9999 minor resistance will turn bias back to the upside for 1.0107 resistance instead.
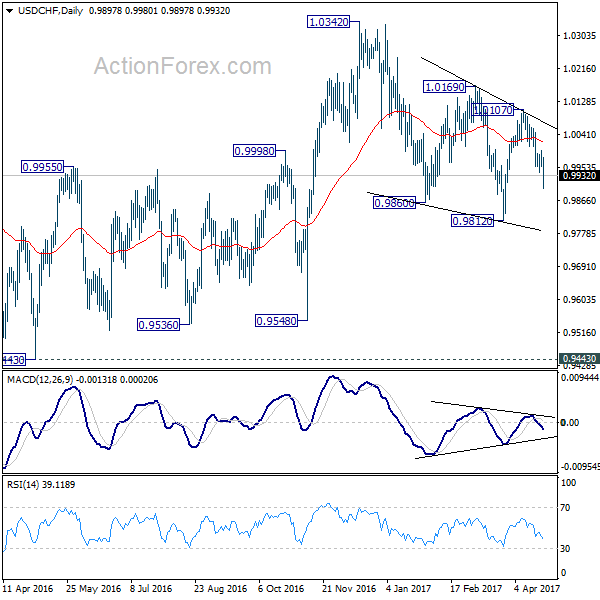
In the bigger picture, we're still maintaining that firm break of 1.0342 key resistance is needed to confirm underlying bullish momentum in the cross. However, the corrective nature of the fall from 1.0342 is starting to give the medium term outlook a bullish favor. Hence, in stead of looking for topping signal around 1.0342, we'd now pay closer attention to upside acceleration as USD/CHF approaches this level again.
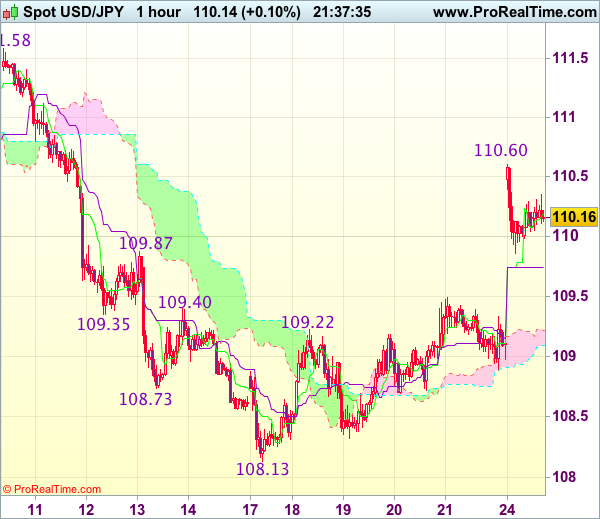
USD/JPY Mid-Day Outlook
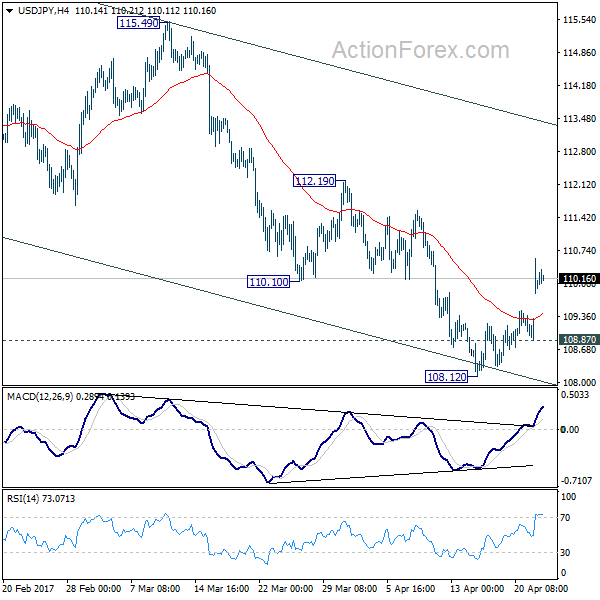
Daily Pivots: (S1) 108.79; (P) 109.11; (R1) 109.34; More....
Intraday bias in USD/JPY remains on the upside for the moment. The break of 110.10 resistance indicates short term bottoming at 108.12, on bullish convergence condition in 4 hour MACD. Further rise would be seen to 111.58 support turned resistance. Sustained break there will argue that fall from 118.65 is merely a corrective move and has completed. Outlook will then be turned bullish for 115.49 resistance and above. Meanwhile, below 108.87 minor support will turn bias to the downside and extend the whole decline from 118.65 to 61.8% retracement of 98.97 to 118.65 at 106.48.
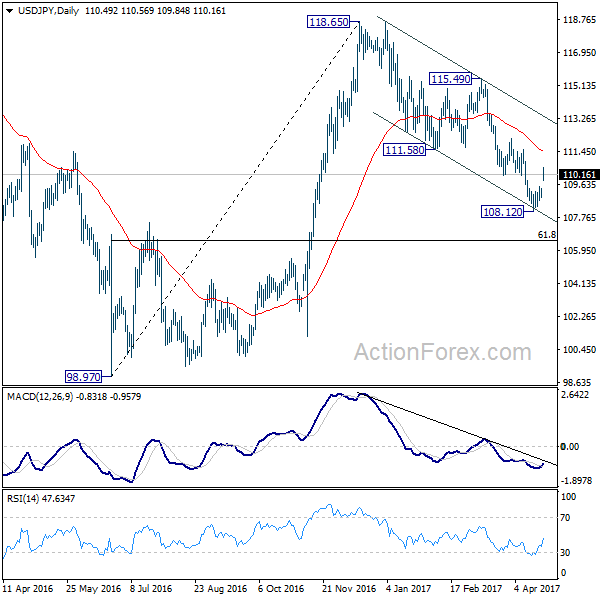
In the bigger picture, price actions from 125.85 high are seen as a corrective pattern. Current development suggests that it's not completed yet and is extending. In case of deeper decline, downside should be contained by 61.8% retracement of 75.56 to 125.85 at 94.77 to bring rebound. Rise from 75.56 is still expected to resume later after the correction from 125.85 completes.
Trade Idea Update: USD/JPY – Buy at 109.50
USD/JPY - 110.15
Original strategy :
Buy at 109.50, Target: 110.50, Stop: 109.15
Position : -
Target : -
Stop : -
New strategy :
Buy at 109.50, Target: 110.50, Stop: 109.15
Position : -
Target : -
Stop : -
The greenback opened higher today and rallied to as high as 110.60, adding credence to our view that a temporary low has been formed at 108.13 last week and bullishness remains for this move to extend further gain, above said resistance at 110.60 would bring test of 111.00, however, near term overbought condition should limit upside and price should falter well below resistance at 111.58, bring retreat later.
In view of this, would not chase this rise here and would be prudent to buy dollar again on dips as previous resistance at 109.50 should turn into support and limit dollar’s downside, bring another rise later. Below the upper Kumo (now at 109.20) would abort and suggest an intra-day top is formed, bring weakness to the lower Kumo (now at 108.98) first.
GBP/USD Mid-Day Outlook
Daily Pivots: (S1) 1.2759; (P) 1.2797; (R1) 1.2838; More...
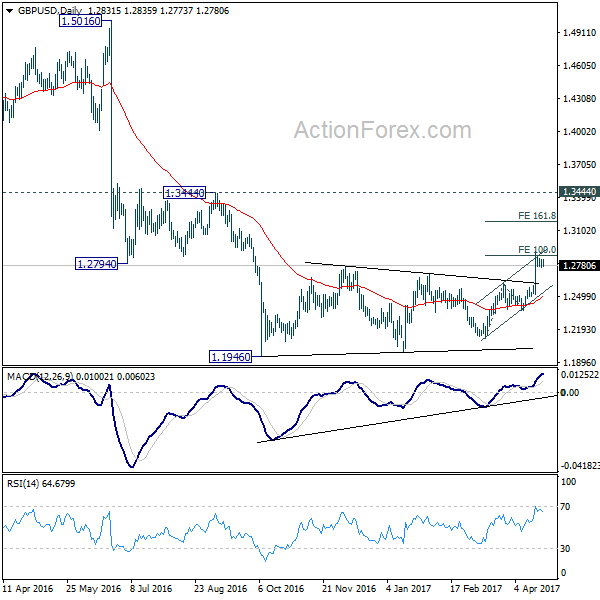
Intraday bias in GBP/USD remains neutral for consolidation below 1.2903 temporary top. With 1.2614 resistance turned support intact, further rally is expected. Firm break of 100% projection of 1.2108 to 1.2614 from 1.2365 at 1.2871 will target 161.8% retracement at 1.3184. Still, price actions from 1.1946 are seen as a correction. Hence we'd expect strong resistance below 1.3444 to bring larger down trend resumption. On the downside, break of 1.2614 resistance turned support will turn bias back to the downside for 1.2365 support first.
In the bigger picture, fall from 1.7190 is seen as part of the down trend from 2.1161. There is no sign of medium term reversal yet. Sustained trading below 61.8% projection of 2.1161 to 1.3503 from 1.7190 at 1.2457 will target 100% projection at 0.9532. Overall, break of 1.3444 resistance is needed to confirm medium term bottoming. Otherwise, outlook will remain bearish.
EUR/USD Mid-Day Outlook
Daily Pivots: (S1) 1.0692; (P) 1.0715 (R1) 1.0747; More....
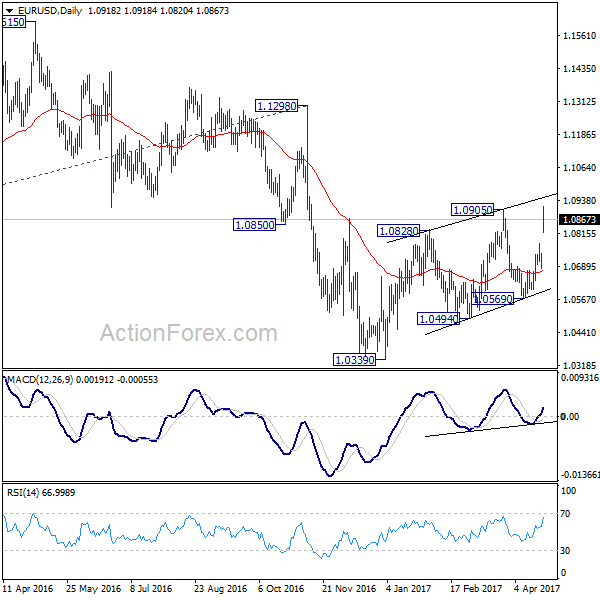
Intraday bias in EUR/USD remains on the upside for the moment. Rise from 1.0339 is still in progress and would extend higher towards 1.1298 resistance. But still, such rally is seen as a corrective move. Hence, we'd pay attention to topping signal above 1.0905 and below 1.1298 key resistance. On the downside, below 1.0777 minor support will turn bias to the downside for 1.0569 support first.
In the bigger picture, as long as 1.1298 key resistance holds, whole down trend from 1.6039 (2008 high) is still expected to continue. Break of 1.0339 low will send EUR/USD through parity to 61.8% projection of 1.3993 to 1.0461 from 1.1298 at 0.9115. However, considering bullish convergence condition in weekly MACD, break of 1.1298 will indicate term reversal. this would also be supported by sustained trading above 55 week EMA.
Euro Maintains Post French Election Gains, German Ifo Beat Expectations
Euro pares back some French election triggered gains, but stays broadly higher against all other major currencies. Meanwhile, Japanese Yen is trading as the weakest as markets are on risk on mode. Markets generally welcome the results of the election and centrist Emmanuel Macron's win in the first round is seen as a boost to the Euro. Forward Eonia bank-to-bank rates also imply a roughly 60% chance of a 10bps hike by ECB by the end of March 2018, up from just 20% chance last week. European stocks are trading broadly higher with CAC up 4.5%, DAX up 3.1% and FTSE up 1.9% at the time of writing. In other markets, Gold drops sharply to as low as 1266.0, down more than -1.3% today. WTI recovers mildly but fails to find follow through buying above 50 handle.
Centrist Emmanuel topped in the first round of election in France getting 23.75% vote. Far-right Marine Le Pen got 21.53%. Both are through to the head-to-head run-off on May 7. Higher support for Macron is seen as a sign of solid support for staying with Euro. Meanwhile, after accepting defeat conservative Francois Fillon and leftist Benoit Hamon called their supports to choose Macron over Le Pen. According to recent polls by Ifop, Ipsos and Elabe, Macron would easily beat Le Pen in a head-to-head run-off, by a wide margin. A new Harris survey also saw Macron winning the run-off by 64% to 36%. More in French Election: Macron And Le Pen Enter Final, Euro Soars Across The Board.
German Ifo beat expectaions
German Ifo business climate rose to 112.9 in April, up fro 112.4 and beat expectation of 112.5. That's also the highest level since July 2011. Current assessment gauge rose to 121.1, up from 119.5 and beat expectation of 119.2. However, expectations gauge dropped to 105.2, down from 105.7 and missed expectation of 105.9. Ifo chief Clemens Fuest noted in the statement that "the German economy is growing strongly." He also noted separately that Macron's first round win in the presidential election "cannot be over-estimated" and from the European perspective, "this is a very good result".
ECB meeting the next focus
Euro will now look into ECB meeting later in the week for further strength. But ECB president Mario Draghi will likely stay cautious with his messages. Draghi warned last week that risks remain tilted to the downside. And "very substantial" accommodation is still needed. Nonetheless, he sounded a bit more relieved that there are "signs" of broadening recovery "across countries and sectors", with a "somewhat brighter global recovery and increasing global trade". Chief economist Peter Praet also noted that time for stimulus exit is yet to come. Separately, governing council member Ewald Nowotny said that the policy path for 2017 is "decided". And ECB will "continuing bond purchases at a reduced level and leaving the interest-rate structures as they are." Another member Francois Villeroy de Galhau said that current policies were "fully appropriate" and recovery is "still fragile.
Trump busy with Xi, Abe, Kim and Tax
Elsewhere, it's reported that China President Xi Jinping urged US President Donald Trump to exercise restraint over North Korea. Xi also expressed his opposition to any action that violate UN Security Council resolutions. Xi urged all parties to avoid further ratcheting up tensions. Meanwhile, Trump has talked to Japan Prime Minster Shinzo Abe. Abe then said that Trump "has indicated by his words and actions that all possible options are on the table." Meanwhile, markets will be eagerly looking forward to Trump's announcement on tax response this Wednesday. The White House said last week that Trump will release "broad principles and priorities" of the tax overhaul.
EUR/USD Mid-Day Outlook
Daily Pivots: (S1) 1.0692; (P) 1.0715 (R1) 1.0747; More....
Intraday bias in EUR/USD remains on the upside for the moment. Rise from 1.0339 is still in progress and would extend higher towards 1.1298 resistance. But still, such rally is seen as a corrective move. Hence, we'd pay attention to topping signal above 1.0905 and below 1.1298 key resistance. On the downside, below 1.0777 minor support will turn bias to the downside for 1.0569 support first.
In the bigger picture, as long as 1.1298 key resistance holds, whole down trend from 1.6039 (2008 high) is still expected to continue. Break of 1.0339 low will send EUR/USD through parity to 61.8% projection of 1.3993 to 1.0461 from 1.1298 at 0.9115. However, considering bullish convergence condition in weekly MACD, break of 1.1298 will indicate term reversal. this would also be supported by sustained trading above 55 week EMA.
Economic Indicators Update
| GMT | Ccy | Events | Actual | Forecast | Previous | Revised |
|---|---|---|---|---|---|---|
| EUR | First Round of French Presidential Election | |||||
| 23:01 | GBP | Rightmove House Prices M/M Apr | 1.10% | 1.30% | ||
| 08:00 | EUR | German IFO - Business Climate Apr | 112.9 | 112.4 | 112.3 | 112.4 |
| 08:00 | EUR | German IFO - Expectations Apr | 105.2 | 105.9 | 105.7 | |
| 08:00 | EUR | German IFO - Current Assessment Apr | 121.1 | 119.2 | 119.3 | 119.5 |
| 10:00 | GBP | CBI Trends Total Orders Apr | 4 | 6 | 8 | |
| 12:30 | CAD | Wholesale Sales M/M Feb | -0.20% | -0.90% | 3.30% | |
| 13:00 | CNY | Conference Board Leading Index Mar | 0.90% | 1.20% | 1.30% |
CRUDE OIL: Vulnerable, Retains Bearish Bias
CRUDE OIL: The commodity looks to weaken further after selling off the past week. On the downside, support resides at the 49.00 level where a break will expose the 48.00 level. A cut through here will set the stage for a run at the 47.50 level. Further down, support resides at the 47.00 level. On the upside, resistance resides at the 50.00 level. Further out, resistance comes in at the 50.50 level. A break above here will aim at the 51.00 level and then the 51.50 level followed by the 52.00 level. All in all, CRUDE OIL remains biased to the downside.