
Sample Category Title
Elliott Wave View: USDCAD Ending An Impulse
Short term Elliott Wave view in USDCAD suggest the decline to 1.322 ended Intermediate wave (X). Up from there, the pair is showing 5 waves impulse structure where Minutte wave (i) ended at 1.3338, Minutte wave (ii) ended at 1.3258, Minutte wave (iii) ended at 1.3525, and Minutte wave (iv) ended at 1.3406. Near term focus is on 1.3596 – 1.364 area to complete Minutte wave (v) and also Minute wave ((a)). The next push higher towards above target should end the cycle from 4/13 low, after which the pair should pullback in Minute wave ((b)) in 3, 7, or 11 swing to correct cycle from 4/13 low before turning higher again. We don't like selling the proposed pullback and expect buyers to appear again once Minute wave ((b)) pullback is complete in 3, 7, or 11 swing provided that pivot at 1.322 low remains intact.
USDCAD 1 hour Elliott Wave Chart
Daily Technical Outlook And Review: EUR/USD, GBP/USD, AUD/USD, USD/JPY, USD/CAD, USD/CHF, DOW 30, GOLD
A note on lower timeframe confirming price action...
Waiting for lower timeframe confirmation is our main tool to confirm strength within higher timeframe zones, and has really been the key to our trading success. It takes a little time to understand the subtle nuances, however, as each trade is never the same, but once you master the rhythm so to speak, you will be saved from countless unnecessary losing trades. The following is a list of what we look for:
- A break/retest of supply or demand dependent on which way you're trading.
- A trendline break/retest.
- Buying/selling tails ... essentially we look for a cluster of very obvious spikes off of lower timeframe support and resistance levels within the higher timeframe zone.
- Candlestick patterns. We tend to only stick with pin bars and engulfing bars as these have proven to be the most effective.
EUR/USD
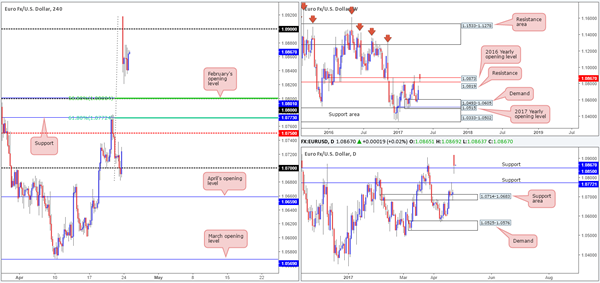
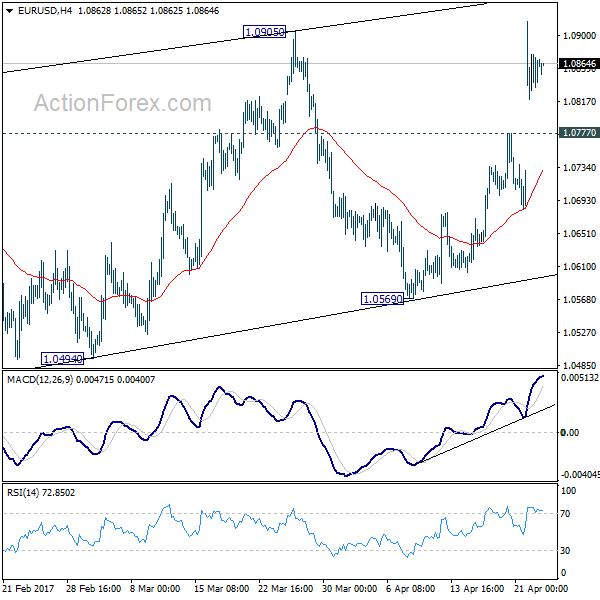
The EUR, as you can see, gapped 200 pips north at the open after a win by centrist Emmanuel Macron at the French presidential elections on Sunday. Despite this, H4 price very quickly entered into a phase of consolidation between 1.0877/1.0831.
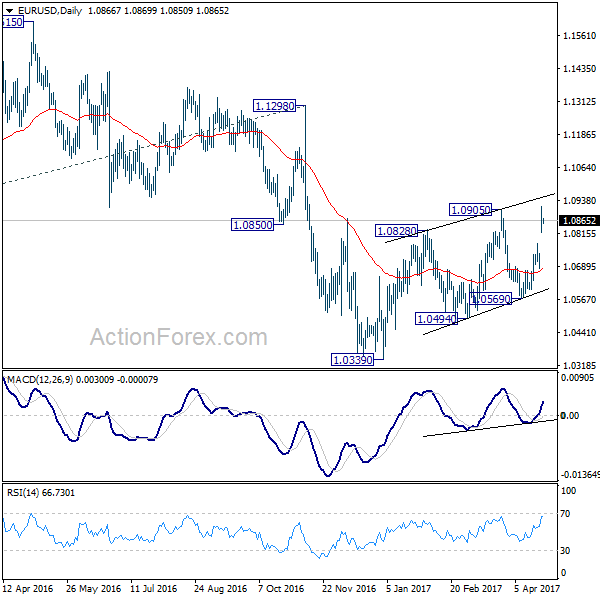
Over on the daily timeframe, we can see that the major recently found support at 1.0850. Should the bulls continue to defend this line, the next area of resistance can be seen at 1.0971. Up on the weekly timeframe, the open forced price above resistance at 1.0819 and the 2016 yearly opening level at 1.0873, but is now seen trading back below the monthly level. We think the best thing to do on this timeframe is simply wait until the weekly candle closes before presuming that either resistance has been consumed.
Our suggestions: On the H4 chart, levels of interest this morning are as follows:
The 1.08 handle, owing to it converging closely with February’s opening level at 1.0801 and a 50.0% retracement.
The H4 support at 1.0773. Not only does this barrier converge with a 61.8% Fib retracement level at 1.0772, it also fuses with daily support coming in at 1.0772.
To be on the safe side here, we would strongly advise waiting for additional confirmation before attempting to enter long from either of the said levels. Ultimately, a nice-looking H4 bull candle (preferably a full-bodied close) would be ideal here!
Data points to consider: US CB consumer confidence, along with new home sales at 3pm GMT+1.
Levels to watch/live orders:
- Buys: 1.08 region ([waiting for a reasonably sized H4 bull candle to form before pulling the trigger is advised] stop loss: ideally beyond the candle’s tail). 1.0773 area ([waiting for a reasonably sized H4 bull candle to form before pulling the trigger is advised] stop loss: ideally beyond the candle’s tail).
- Sells: Flat (stop loss: N/A).
GBP/USD:
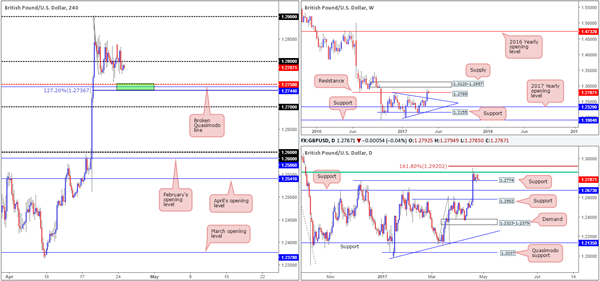
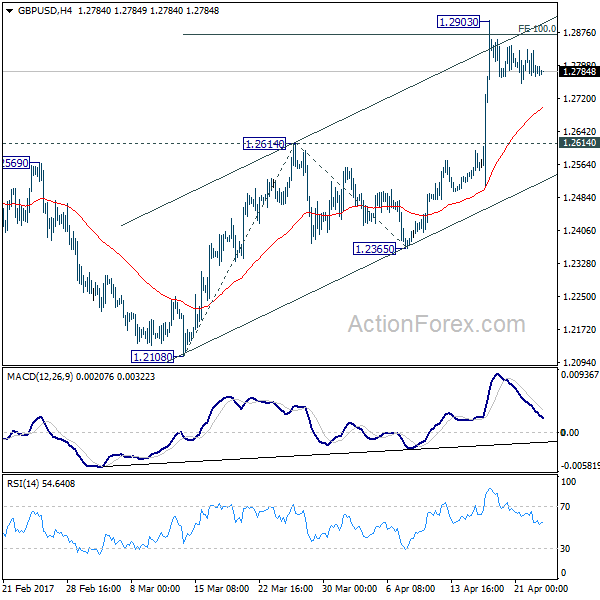
Cable, as can be seen from the H4 chart, continued to seesaw around the 1.28 handle during Monday’s sessions. Although the pair lost some ground yesterday, the overall structure of this market remains unchanged. Therefore, the crosshairs are still fixed on 1.2750 (green area) for an intraday bounce north today. Why here? Well, not only are mid-level numbers watched by the majority of the market, there’s also a AB=CD 127.2% Fib extension seen nearby at 1.2736 (drawn from the high 1.29) that unites closely with a broken Quasimodo line pegged at 1.2744.
Our rationale behind looking for a bounce off 1.2736/1.2750, apart from the H4 confluence, is also the fact that this zone is planted directly beneath daily support at 1.2774. For that reason, it could perhaps be a nice base to help facilitate a fakeout! The only grumble, of course, is that weekly sellers could still be active from resistance at 1.2789, hence the reason for not expecting much more than an intraday bounce from the H4 area.
Our suggestions: Depending on the time of day, a long from 1.2736/1.2750 looks to be stable enough to consider trading without the need for additional confirmation. Remember though, we do not expect to see much more than a small bounce from this area!
Data points to consider: US CB consumer confidence, along with new home sales at 3pm GMT+1.
Levels to watch/live orders:
- Buys: 1.2736/1.2750 (stop loss: at least five pips beyond the lower edge of the area).
- Sells: Flat (stop loss: N/A).
AUD/USD
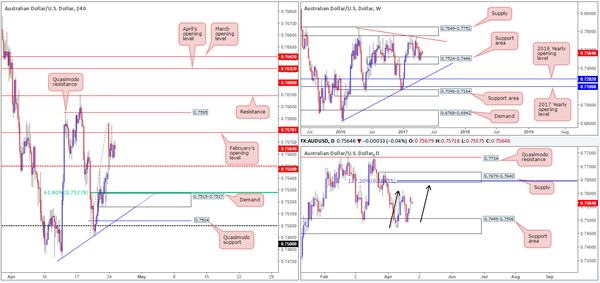
The Aussie started the day at 0.7586, gapping around fifty pips higher than Friday’s closing point. The gap, as you can see though, was quickly filled with price then seen entering into a phase of consolidation between February’s opening level at 0.7578 and the H4 mid-level support 0.7550.
Although weekly bulls have so far failed to generate anything noteworthy out of the support area marked at 0.7524-0.7446, it’s far too early to tell whether the bears are gaining the upper hand, in our opinion. Down on the daily chart, it’s possible that the candles are in the process of forming an AB=CD pattern (black arrows), which, as seen by the AB=CD 127.2% Fib ext. at 0.7645, ties in beautifully with supply at 0.7679-0.7640. For that reason, the bulls may still have a hand in this fight.
Our suggestions: Before the buyers come into play, nevertheless, we may see H4 price pullback and test demand at 0.7515-0.7527, which would imply a break of the mid-level support at 0.7550. The reasoning for selecting the said demand, apart from the higher-timeframe direction (see above), is the 61.8% Fib convergence seen at 0.7527 (taken from the low 0.7491). What would make this zone even better would be a solid approach in the form of an AB=CD formation or a three-drive pattern.
Data points to consider: US CB consumer confidence, along with new home sales at 3pm GMT+1.
Levels to watch/live orders:
- Buys: 0.7515-0.7527 ([waiting for a reasonably sized H4 bull candle to form before pulling the trigger is advised] stop loss: ideally beyond the candle’s tail or the demand).
- Sells: Flat (stop loss: N/A).
USD/JPY
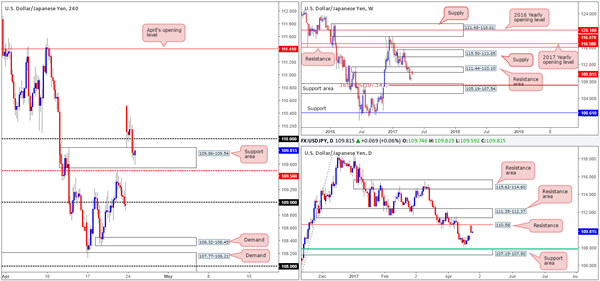
Having seen the USD/JPY aggressively gap over 150 pips north on Monday after a win by centrist Emmanuel Macron at the French presidential elections, the market then went on to retreat and gave back 50% of this move. Seeing price break back below the 110 handle and test the H4 support area seen at 109.86-109.54 has likely interested some buyers. Longs from this region, however, could be risky though. Weekly price has recently shook hands with a resistance area fixed at 111.44-110.10, and daily action came within a cat’s whisker of clipping the underside of resistance at 110.58. Therefore, we fail to see the bulls sustaining gains beyond the nearby 110 handle today.
Our suggestions: Based on the above points, technicals suggest further downside could be on the cards. And for that reason we’re looking for a H4 close to be seen beyond 109.50. This – coupled within a retest to the underside of this line and a lower-timeframe sell signal (see the top of this report) would be enough evidence to sell, targeting the 109 handle as an initial take-profit target.
Data points to consider: US CB consumer confidence, along with new home sales at 3pm GMT+1.
Levels to watch/live orders:
- Buys: Flat (stop loss: N/A).
- Sells: Watch for H4 price to engulf 109.50 and then look to trade any retest seen thereafter ([waiting for a lower-timeframe sell signal to form following the retest is advised] stop loss: dependent on where one confirms this level).
USD/CAD
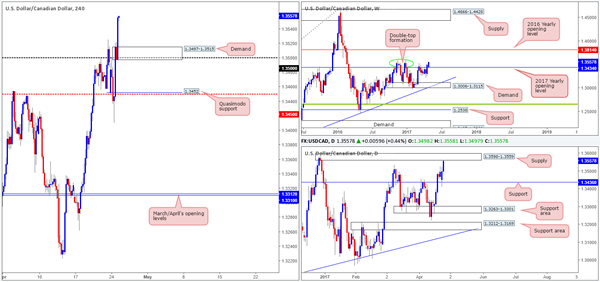
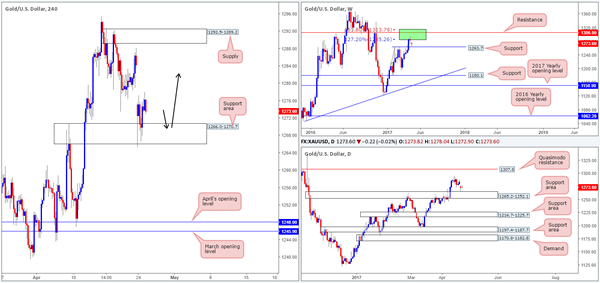
Following a retest of daily support at 1.3436, the daily candles are now seen within striking distance of supply coming in at 1.3598-1.3559. Also of particular interest is weekly flow. Despite the bulls looking in fine form at the moment, there’s a well-defined double-top formation seen around the 1.3588 neighborhood (green circle). Therefore, the bears clearly still have a hand in this game!
The recent advance also saw H4 price clear the 1.35 handle, which has consequently placed price within shouting distance of a Quasimodo resistance formed back on the 28th December 2016 at 1.3580. This line – coupled with both weekly and daily structure, has a high probability of working out. However, we must point out that there’s a psychological band sitting just above it at 1.36, so there’s a chance a fakeout may occur.
Our suggestions: To help avoid the possibility of getting stopped on a fakeout, we would simply advise waiting for a H4 bearish candle to form (preferably a full-bodied candle) before committing to a trade.
Data points to consider: US CB consumer confidence, along with new home sales at 3pm GMT+1.
Levels to watch/live orders:
- Buys: Flat (stop loss: N/A).
- Sells: 1.3580 region ([waiting for a reasonably sized H4 bear candle to form before pulling the trigger is advised] stop loss: ideally beyond the candle’s wick).
USD/CHF
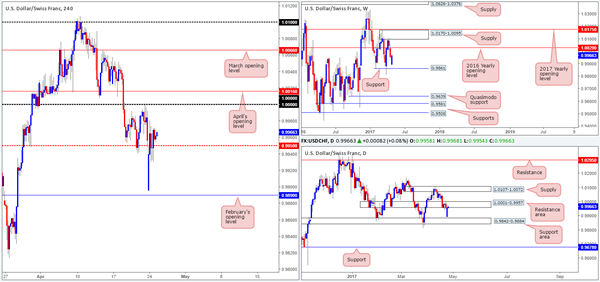
Monday began with a 60-pip gap south, which came within reaching distance of February’s opening level at 0.9890. As you can see, H4 price quickly made work of the opening gap and then entered into a tight consolidation around the mid-level support 0.9950.
With 0.9950 continuing to hold firm for the time being, will we see parity (1.0000) or even April’s opening level at 1.0016 brought into the picture today? Of course, it’s a possibility, but the daily resistance area at 1.0001-0.9957 seen in play is concerning.
Our suggestions: Personally, we have absolutely no interest in looking for longs today. Should price manage to reach parity/April’s opening level, nevertheless, a short from between these two lines is something we would be attracted to given the daily resistance area. What would interest us even more, of course, would be a reasonably sized H4 bear candle forming out of this H4 zone (preferably a full-bodied candle), essentially providing us with added confirmation.
Data points to consider: US CB consumer confidence, along with new home sales at 3pm GMT+1.
Levels to watch/live orders:
- Buys: Flat (stop loss: N/A).
- Sells: 1.0016/1.0000 ([waiting for a reasonably sized H4 bear candle to form before pulling the trigger is advised] stop loss: ideally beyond the candle’s wick).
DOW 30
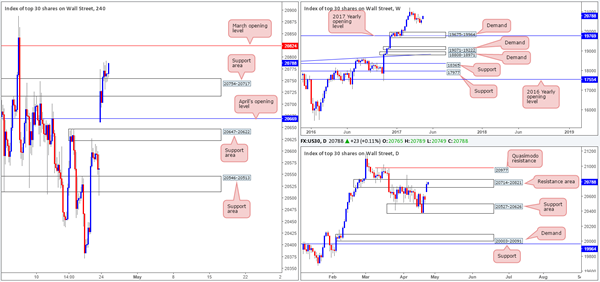
US equities gapped 100 points north on Monday, which eventually lifted the index above the H4 resistance area at 20754-20717. Given that the bulls seem to be establishing support on the retest of this zone, will we see March’s opening base line at 20824 brought into view? It’s certainly a possibility, but not really something we’d be interested in buying in to. The reason being is simply because the daily candles are seen trading within the walls of a resistance area coming in at 20714-20821. Therefore, instead of looking for long plays, we’re more inclined to consider shorting March’s opening level seeing as it sits just three points above the said daily resistance area.
Our suggestions: While a short from 20824 is likely to produce a bounce, it might be worth noting that weekly action could potentially break to fresh highs in the near future. As such, to sell 20824, we would strongly recommend waiting for a lower-timeframe confirming signal to take shape before committing (see the top of this report).
Data points to consider: US CB consumer confidence, along with new home sales at 3pm GMT+1.
Levels to watch/live orders:
- Buys: Flat (stop loss: N/A).
- Sells: 20824 region ([waiting for a lower-timeframe sell signal to form is advised] stop loss: dependent on where one confirms this level).
GOLD
After a somewhat hostile beginning to the week, the yellow metal seems to have found refuge around a H4 support area coming in at 1266.0-1270.7. This area, as you can probably see, houses a weekly support level at 1263.7 and also sits just on top of a daily support zone drawn from 1265.2-1252.1. In view of this, we ultimately expect the gold market to advance this week, at least filling the weekend gap and maybe touching base with H4 supply at 1292.5-1289.2.
Our suggestions: Quite simply, what we’re looking for H4 price to achieve today is a retest of the current support area. Should this occur, we’ll then be looking for a reasonably sized H4 bullish rotation candle (preferably full-bodied) to take shape. Only then would our team look to buy this market, with hopes of riding bullion up to at least the close of the weekend gap around the 1283.4ish range.
Levels to watch/live orders:
- Buys: 1266.0-1270.7 ([waiting for a reasonably sized H4 bull candle to form before pulling the trigger is advised] stop loss: ideally beyond the candle’s tail or the support area).
- Sells: Flat (stop loss: N/A).
EUR/USD Daily Outlook
Daily Pivots: (S1) 1.0823; (P) 1.0863 (R1) 1.0906; More....
With 1.0777 minor support intact, intraday bias remains on the upside for further rally. Rise form 1.0339 is in progress and would extend higher towards 1.1298 resistance. But still, such rally is seen as a corrective move. Hence, we'd pay attention to topping signal above 1.0905 and below 1.1298 key resistance. On the downside, below 1.0777 minor support will turn bias to the downside for 1.0569 support first.
In the bigger picture, as long as 1.1298 key resistance holds, whole down trend from 1.6039 (2008 high) is still expected to continue. Break of 1.0339 low will send EUR/USD through parity to 61.8% projection of 1.3993 to 1.0461 from 1.1298 at 0.9115. However, considering bullish convergence condition in weekly MACD, break of 1.1298 will indicate term reversal. this would also be supported by sustained trading above 55 week EMA.
GBP/USD Daily Outlook
Daily Pivots: (S1) 1.2763; (P) 1.2800; (R1) 1.2828; More...
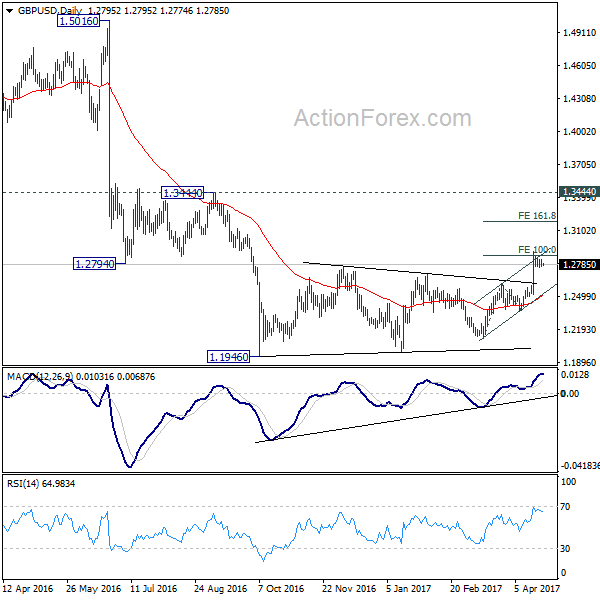
GBP/USD is staying in consolidation below 1.2903 temporary top and intraday bias remains neutral. With 1.2614 resistance turned support intact, further rally is expected. Firm break of 100% projection of 1.2108 to 1.2614 from 1.2365 at 1.2871 will target 161.8% retracement at 1.3184. Still, price actions from 1.1946 are seen as a correction. Hence we'd expect strong resistance below 1.3444 to bring larger down trend resumption. On the downside, break of 1.2614 resistance turned support will turn bias back to the downside for 1.2365 support first.
In the bigger picture, fall from 1.7190 is seen as part of the down trend from 2.1161. There is no sign of medium term reversal yet. Sustained trading below 61.8% projection of 2.1161 to 1.3503 from 1.7190 at 1.2457 will target 100% projection at 0.9532. Overall, break of 1.3444 resistance is needed to confirm medium term bottoming. Otherwise, outlook will remain bearish.
USD/CHF Daily Outlook
Daily Pivots: (S1) 0.9908; (P) 0.9943; (R1) 0.9993; More.....
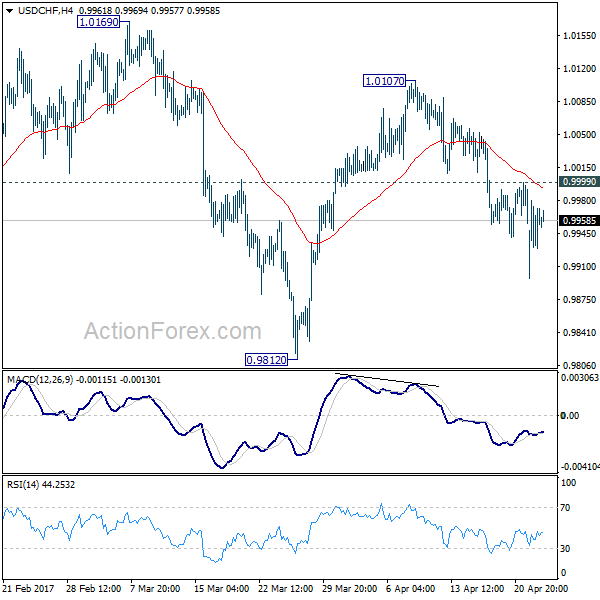
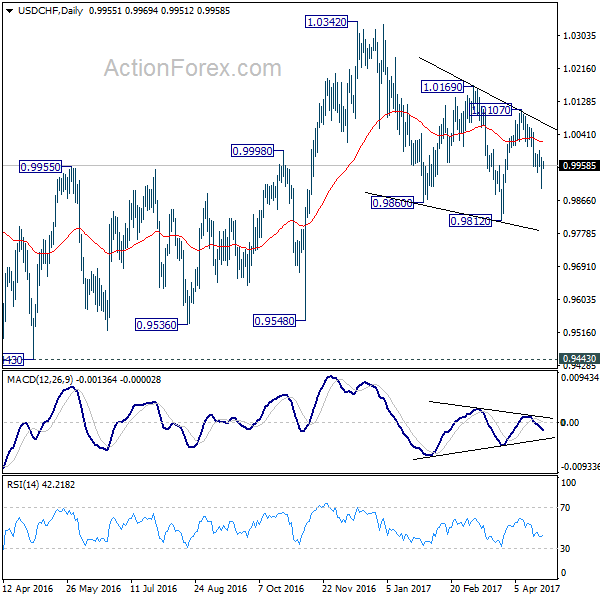
With 0.9999 minor resistance intact, intraday bias in USD/CHF remains on the downside for 0.9812 support and below. Fall from 1.0342 is seen as a correction. Hence, we'll look for bottoming signal below 0.9812. Meanwhile, on the upside, above 0.9999 minor resistance will turn bias back to the upside for 1.0107 resistance instead.
In the bigger picture, we're still maintaining that firm break of 1.0342 key resistance is needed to confirm underlying bullish momentum in the cross. However, the corrective nature of the fall from 1.0342 is starting to give the medium term outlook a bullish favor. Hence, in stead of looking for topping signal around 1.0342, we'd now pay closer attention to upside acceleration as USD/CHF approaches this level again.
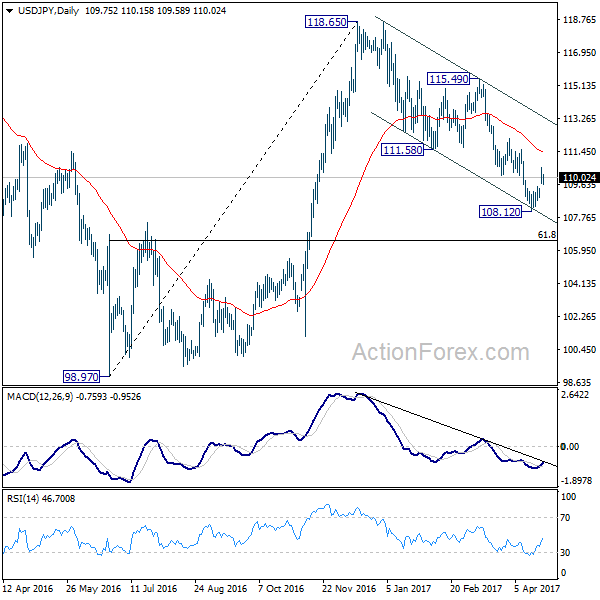
USD/JPY Daily Outlook
Daily Pivots: (S1) 109.42; (P) 110.00; (R1) 110.34; More....
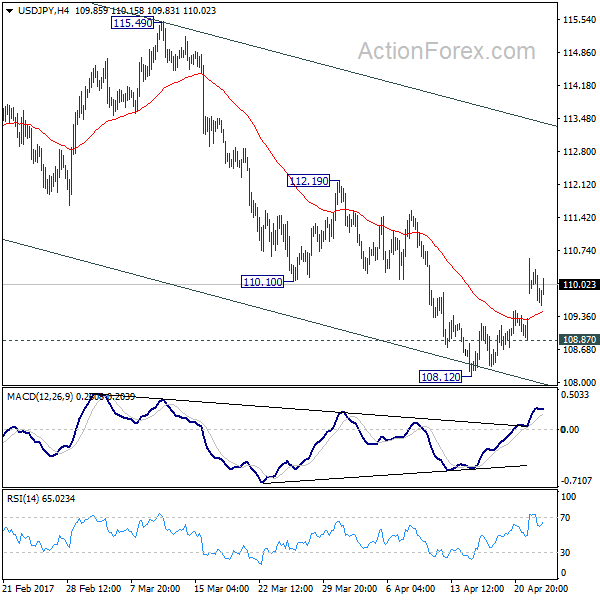
USD/JPY's rebound from 108.12 is still in progress and intraday bias stays on the upside for 111.58 support turned resistance. Considering bullish convergence in 4 hour MACD, sustained break of 111.58 will argue that fall from 118.65 is merely a corrective move and has completed. Outlook will then be turned bullish for 115.49 resistance and above. Meanwhile, below 108.87 minor support will turn bias to the downside and extend the whole decline from 118.65 to 61.8% retracement of 98.97 to 118.65 at 106.48.
In the bigger picture, price actions from 125.85 high are seen as a corrective pattern. Current development suggests that it's not completed yet and is extending. In case of deeper decline, downside should be contained by 61.8% retracement of 75.56 to 125.85 at 94.77 to bring rebound. Rise from 75.56 is still expected to resume later after the correction from 125.85 completes.
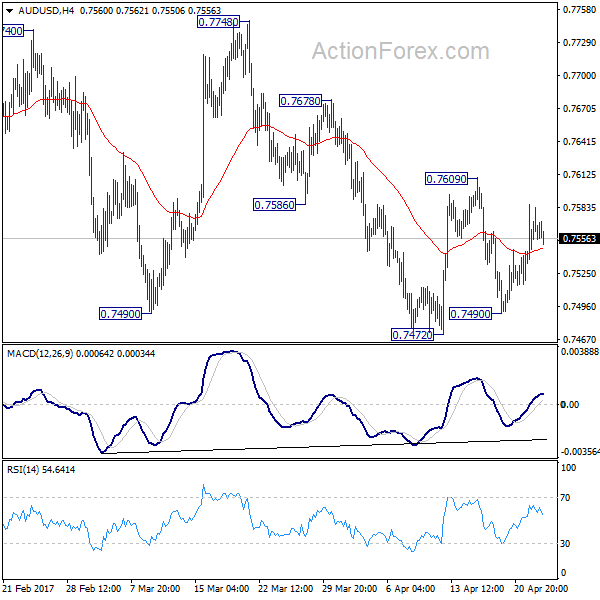
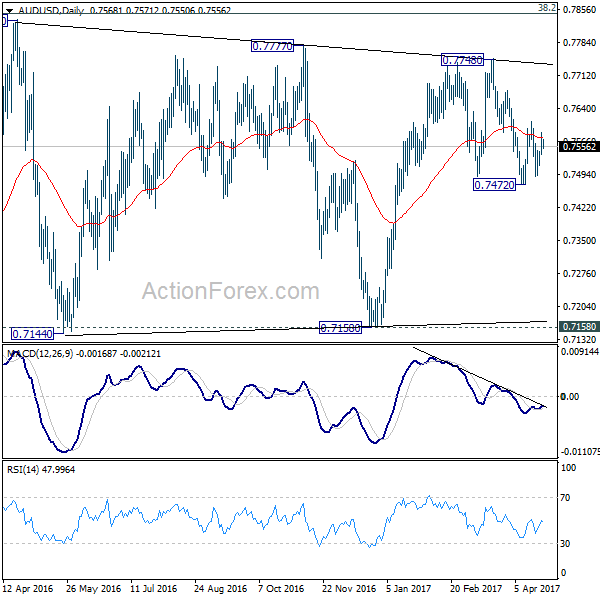
AUD/USD Daily Outlook
Daily Pivots: (S1) 0.7543; (P) 0.7563; (R1) 0.7589; More...
Intraday bias in AUD/USD is mildly on the upside for 0.7609 resistance. Break will indicate resumption of rise from 0.7472 and target 0.7748 high. That will also argue that whole rally from 0.7158 is resuming and put 0.7849 key resistance fibonacci level in focus. On the downside, below 0.7490 will now likely send AUD/USD through 0.7472 low.
In the bigger picture, we're still treating price actions from 0.6826 low as a correction. And, as long as 38.2% retracement of 0.9504 to 0.6826 at 0.7849 holds, long term down trend from 1.1079 is expected to resume sooner or later. Break of 0.6826 low will target 0.6008 key support level. However, firm break of 0.7849 will indicate that rise from 0.6826 is developing into a medium term rebound, rather than a sideway pattern. In such case, stronger rise should be seen to 55 month EMA (now at 0.8144) and above.
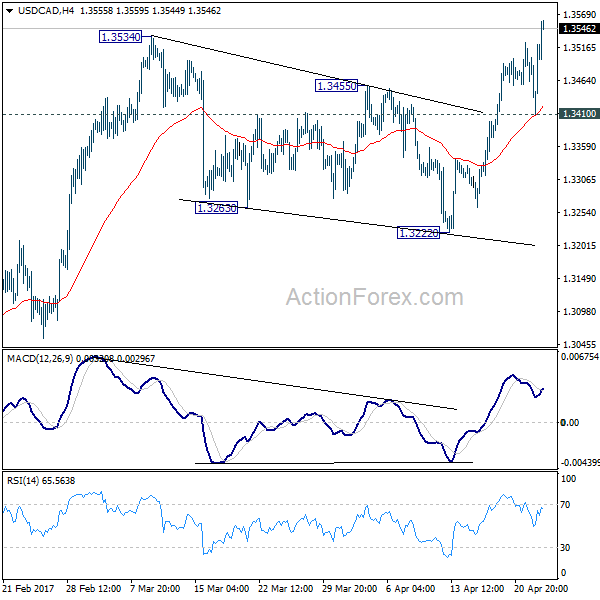
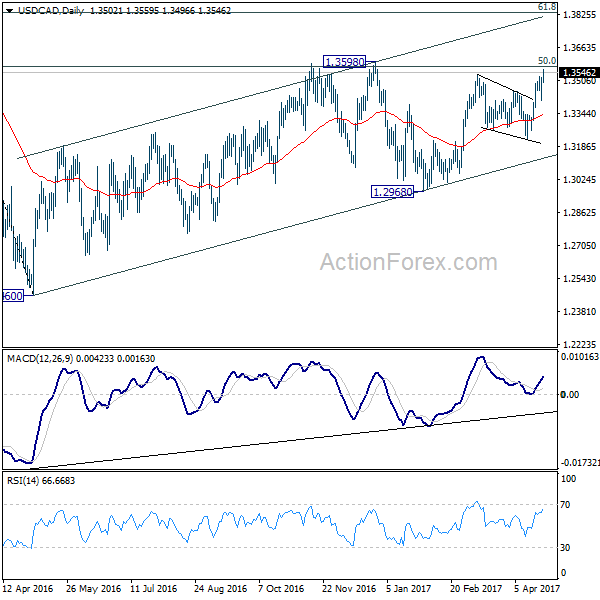
USD/CAD Daily Outlook
Daily Pivots: (S1) 1.3432; (P) 1.3476; (R1) 1.3543; More....
USD/CAD's rally extends after brief retreat and drew support from 4 hour 55 EMA. The break of 1.3543 resistance confirms resumption of rise from 1.2968. Intraday bias stays on the upside for 1.3598. Firm break there will resume whole rally from 1.2460 to next medium term fibonacci level at 1.3838. On the downside, break of 1.3410 support is needed to indicate short term topping. Otherwise, outlook will remain bullish in case of retreat.
In the bigger picture, price actions from 1.4689 medium term top are seen as a correction pattern. The first leg has completed at 1.2460. The second leg from 1.2460 is likely still in progress and could target 61.8% retracement of 1.4689 to 1.2460 at 1.3838. We'd look for reversal signal there to start the third leg. However, break of 1.2968 will argue that the third leg has already started and should at least bring a retest of 1.2460 low. Meanwhile, sustained trading above 1.3838 would pave the way to retest 1.4689 high.
Risk on as CAC Hit Record, Dollar Awaits Trump Guidance
The global financial markets were blessed by centrist Emmanuel Macron's win in the first round of French presidential election. CAC 40 gained 4.14% yesterday to close at 9 year high at 5268.85. DAX rose 3.37% to close at record high at 12454.98. In particular, CAC took out prior resistance at 5142.81 by a margin. DAX's break of prior resistance at 12390.75 was also solid. US indices followed with NASDAQ closing at record high at 5983.82, up 1.24%. DJIA and S&P 500 rose 1.05% and 1.08% resistance but are both kept well below recent highs so far. Asian equities follow with Nikkei trading back above 19000 handle.
In treasury markets, French-German yield spread narrowed sharply. As yields on OATs, 10 year French government debt, dropped 7.7 basis point to 0.849%. Spread with German bund yields narrowed to 49.80 basis points, down from around 75 basis points, and hit the lowest level since December. In US, 10 year yield hit as high as 2.313 overnight but pared back much gains to close at 2.273%. There were revived expectations of Fed hike in June. Fed fund futures are now pricing in 66.1% chance of a hike in June, and it was below 50% last week. But judging from the reactions in 10 year yield, markets are still not too convinced about that yet.
Trump to corporate tax rate to 15%
The outlook of Fed rate, yields and Dollar will largely depend on what US President Donald Trump will deliver this Wednesday regarding his tax reforms. It's reported that Trump would seek to lower corporate income tax rate to 15%, down from 35%. Meanwhile, individual tax rate could be capped at 33%. However, there are talks that such a plan would set up clashes with Republicans as some of them would oppose to raising the country's debt. The outline of the plan itself would be the first test for Dollar. And the execution of the plan, including parliamentary approval, will be another test.
Le Pen steps down as National Front leader
Going back to Europe, far right French presidential candidate Marine Le Pen announced that she is stepping down as leader of the National Front party, just after the first round of election. This is seen by analysts as an act to reach out to non National Front supporters. Currently polls suggest that Macron will beat Le Pen in the Run off on May 7 by 62-38. The poll results has been rather steady since March.
Brexit: EU toughens stance on financial services and citizen rights
Regarding Brexit, it's reported that in the latest draft of EU negotiation plan, financial services was split off from wordings on the trade deal. And, "any future framework should safeguard financial stability in the Union and respect its regulatory and supervisory standards regime and application." That was believed to be in response to France's request to separate financial services with trade. Meanwhile, EU would push for reciprocal guarantees to give EU citizens in UK, and UK citizens in EU, to acquire permanent residence after a continuous period of five years. EU will approve the negotiation guidelines and plans on April 29 but will wait until UK elections in June to start formal negotiations.
On the data front
Japan corporate service price index rose 0.8% yoy in March. UK will release public sector net borrowing in European session. US will release house price indices, new home sales and consumer confidence later in the day.
USD/CAD Daily Outlook
Daily Pivots: (S1) 1.3432; (P) 1.3476; (R1) 1.3543; More....
USD/CAD's rally extends after brief retreat and drew support from 4 hour 55 EMA. The break of 1.3543 resistance confirms resumption of rise from 1.2968. Intraday bias stays on the upside for 1.3598. Firm break there will resume whole rally from 1.2460 to next medium term fibonacci level at 1.3838. On the downside, break of 1.3410 support is needed to indicate short term topping. Otherwise, outlook will remain bullish in case of retreat.
In the bigger picture, price actions from 1.4689 medium term top are seen as a correction pattern. The first leg has completed at 1.2460. The second leg from 1.2460 is likely still in progress and could target 61.8% retracement of 1.4689 to 1.2460 at 1.3838. We'd look for reversal signal there to start the third leg. However, break of 1.2968 will argue that the third leg has already started and should at least bring a retest of 1.2460 low. Meanwhile, sustained trading above 1.3838 would pave the way to retest 1.4689 high.
Economic Indicators Update
| GMT | Ccy | Events | Actual | Forecast | Previous | Revised |
|---|---|---|---|---|---|---|
| 23:50 | JPY | Corporate Service Price Y/Y Mar | 0.80% | 0.80% | 0.80% | |
| 8:30 | GBP | Public Sector Net Borrowing (GBP) Mar | 2.6B | 1.1B | ||
| 13:00 | USD | House Price Index M/M Feb | 0.30% | 0.00% | ||
| 13:00 | USD | S&P/Case-Shiller Composite-20 Y/Y Feb | 5.80% | 5.73% | ||
| 14:00 | USD | New Home Sales Mar | 584K | 592K | ||
| 14:00 | USD | Consumer Confidence Apr | 122.5 | 125.6 |
European Open Briefing: Asian Stock Markets Rose Overnight
Global Markets:
- Asian stock markets: Nikkei up 0.80 %, Shanghai Composite gained 0.40 %, Hang Seng rose 1.00 %, ASX 200 closed for holiday
- Commodities: Gold at $1275 (-0.20 %), Silver at $17.95 (+0.15 %), WTI Oil at $49.50 (+0.50 %), Brent Oil at $52.40 (+0.55 %)
- Rates: US 10-year yield at 2.28, UK 10-year yield at 1.05, German 10-year yield at 0.33
News & Data:
- Japan Services PPI (Mar): 0.80% (est 0.70%, prev 0.80%)
- Asia stocks rise, euro steady as relief from French vote buoys sentiment – RTRS
- Oil edges up after six days of straight losses – RTRS
- Euro pauses after rally, Canadian dollar hit by U.S. duties on lumber – RTRS
Markets Update:
Asian stock markets rose overnight, led by gains in the Nikkei. The outcome of the first round of the French election and US President Trump's announcement regarding his tax reform have kept stocks bid. Australian and New Zealand markets were closed for a holiday.
In the currency market, the largest moves overnight were seen in the CAD pairs. The Canadian Dollar came under pressure after the US announced it will impose a tax on Canadian lumber imports. USD/CAD rallied to a high of 1.3560 and could approach 1.36 resistance soon. While the pair looks a bit overbought in the short-term, 1.36 is an important level. If it breaks above it, further gains towards 1.38 seem likely.
Price action in the other major pairs was rather quiet. EUR/USD and GBP/USD consolidated in tight ranges. USD/JPY rose slightly after the Tokyo open, underpinned by the rally in stock markets. AUD/USD traded 0.7550-70 in Asia, while the New Zealand Dollar came a bit under pressure. It fell from 0.7015 to a low of 0.6985.
Upcoming Events:
- 15:00 GMT – US New Home Sales
- 15:00 GMT – US Richmond Manufacturing Index