Sample Category Title
Canadian Dollar Slips After US Imposes Tariffs On Canadian Softwood Lumber
The Canadian dollar tumbled during the early Asian morning Tuesday, following an announcement by US Commerce Secretary Ross that his nation will impose a 20% tariff on softwood lumber coming from Canada. The US said the decision was a response to Canada's wood subsidies. US producers have repeatedly argued that Canada's government subsidizes its industry by charging low fees for cutting trees in government-owned lands, which results in unfairly cheap lumber prices.
The big question in our minds is whether the Canadian government - which has already condemned this action - will retaliate in similar fashion. What's more, this move comes ahead of talks to renegotiate NAFTA that are set to take place this summer. In our view, the US action could set the tone regarding how those negotiations play out, and may be the first sign towards a tougher US trade relationship with Canada as well Mexico, considering all of President Trump's protectionist rhetoric during his campaign. All these confirm the BoC's concerns with regards to trade uncertainty, which was the Bank's main argument behind its recent cautious stance. Combined with the latest slowdown in the nation's CPIs, this uncertainty could keep the Bank's finger near the easing button.
USD/CAD traded yesterday, after it hit support near the 1.3425 line and the prior downside resistance line drawn from the peak of the 9th of March. The news gave an extra boost to the pair, helping it to emerge above the 1.3530 (S1) hurdle and consequently to confirm a forthcoming higher high on the 4-hour chart. At the time of writing, the rate is testing the 1.3560 (R1) resistance, where a clear break is possible to open the way for a test near the key hurdle zone of 1.3600 (R2). The 1.3600 (R2) barrier happens to be the upper bound of the longer-term sideways range the pair has been trading within since September. A clear above that zone is needed to turn the broader picture positive and make us confident on larger bullish extensions.
Australia's CPI data for Q1 in focus
During the Asian morning Wednesday, Australia will release its CPI data for Q1. Expectations are for both the headline and trimmed mean rates to have risen, with the headline print returning back within the RBA's inflation target range of 2-3%. At its latest policy meeting, the RBA appeared slightly more dovish, particularly with regards to the labor market. However, after that gathering, data showed that the nation's labor market recovered strongly in March, which makes the case for easing at the upcoming meeting less likely. Accelerating CPIs could decrease further the possibility for any action, and may even prove cause for a slightly more upbeat message from the Bank. As such, AUD could strengthen at the time of the CPIs release.
AUD/USD traded in a consolidative manner yesterday staying between the support of 0.7550 (S1) and the resistance of 0.7585 (R1). Accelerating CPIs could encourage buyers to take control and perhaps set the stage for a test near the key obstacle of 0.7600 (R2). If they prove strong enough to overcome it, they may push the battle towards 0.7625 (R3). Switching to the daily chart, we maintain the view that the broader path is to the sideways. The rate has been oscillating between 0.7160 and 0.7800 since March 2016.
Today's highlights:
During the European morning, the economic calendar is very light. The only noteworthy indicator we get is Sweden's unemployment rate for March, which is expected to have ticked down.
From the US, we get the CB consumer confidence index for April, new home sales for March, and the S&P/Case-Shiller house price index for February.
USD/CAD
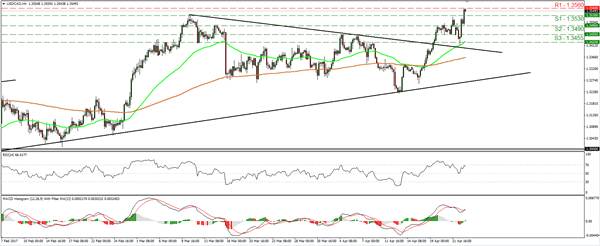
Support: 1.3530 (S1), 1.3490 (S2), 1.3455 (S3)
Resistance: 1.3560 (R1), 1.3600 (R2), 1.3660 (R3)
AUD/USD
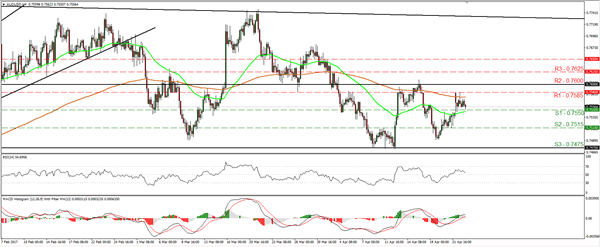
Support: 0.7550 (S1), 0.7515 (S2), 0.7475 (S3)
Resistance: 0.7585 (R1), 0.7600 (R2), 0.7625 (R3)
EUR/USD Analysis: Stays Below Resistance
'The euro was steady, maintaining gains of about 1.2 percent after the French presidential vote led to a run-off between centrist Emmanuel Macron and National Front candidate Marine Le Pen.' – Dennis Pettit and Alexandria Arnold, Bloomberg
Pair's Outlook
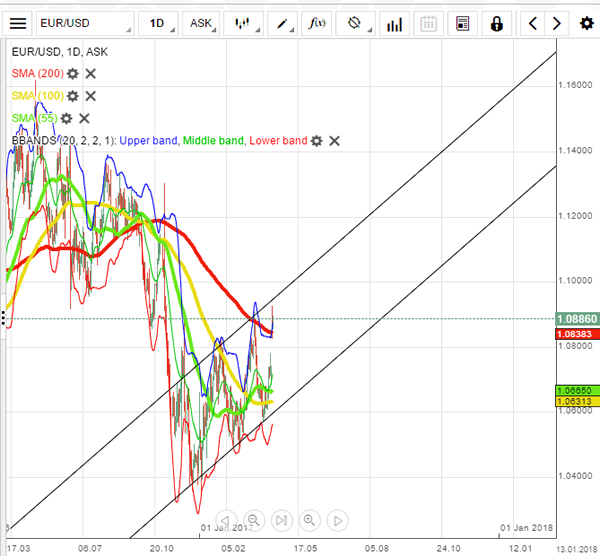
The common European currency remained almost unchanged on Tuesday morning against the US Dollar, as the currency exchange rate traded near the 1.0860 mark. The currency exchange rate was located below the combined resistance of the monthly R1 at 1.0876 and the weekly R2 at 1.0878. This resistance level has kept the pair lower since the consolidation, which followed in the aftermath of the first round of the French Election. It is highly possible that the pair will remain almost unchanged by the end of the day, as it still remains above the upper Bollinger band.
Traders' Sentiment
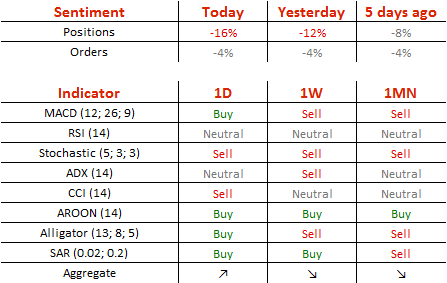
Traders remain bearish on the pair, as 58% of open positions are short. Meanwhile, 52% of trader set up orders are to sell the Euro.
GBP/USD Analysis: Stuck Between 1.2750 And 1.2850
'We read the technical indicators as suggesting there is scope for addition gains, but suspect the $1.3000-$1.3050 may be difficult to overcome.' – BBH (based on FXStreet)
Pair's Outlook
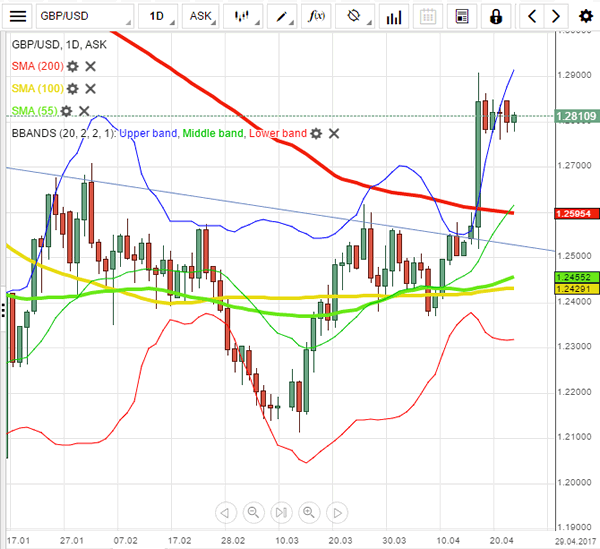
As was anticipated, the Sterling began the week on the back foot, having lost 45 pips against the US Dollar yesterday. The decline was a good sign, as it confirmed the Cable's current consolidation trend, which began after last week's strong 278-pip surge. The GBP/USD pair remains anchored to the 1.28 major level, thus, no significant development is expected to occur today. However, according to technical indicators, the bullish momentum today is likely to prevail, but with the 1.2850 mark still being the intraday ceiling, as it marks the consolidation trend's upper boundary.
Traders' Sentiment
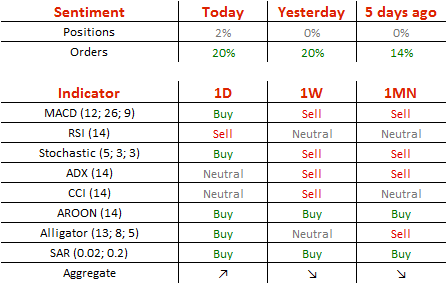
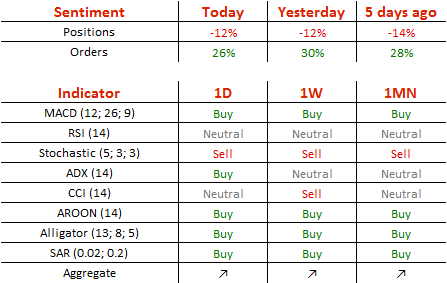
Bulls and bears finally broke out of equilibrium, but market sentiment still remains neutral, with 51% of all open positions being long. Meanwhile, the number of purchase orders remains unchanged at 60%.
USD/JPY Analysis: En Route To 111.00
'Should the yen be bought, if the Korean situation is so nearby? But buying the yen seems to be the established market reaction, and if you've been around long enough, you know you don't go against the market.' – State Street Bank and Trust (based on Reuters)
Pair's Outlook
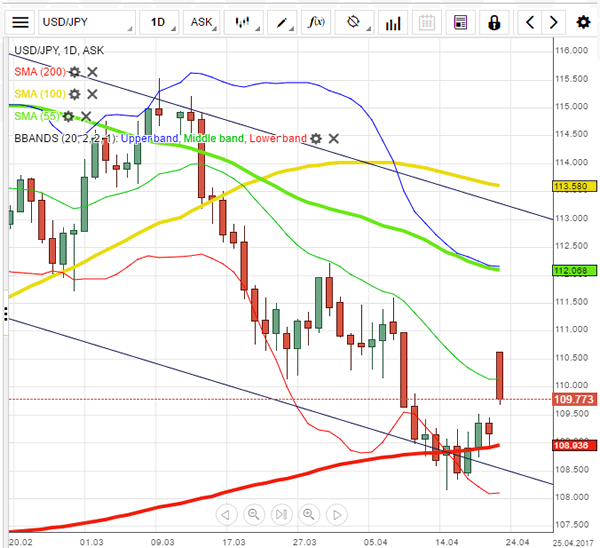
The Greenback underwent a corrective decline on Monday, but the losses against the Yen slightly exceeded expectations, as trade closed below the 110.00 major level. Where the given psychological support failed, the weekly R1 at 109.71 succeeded, but that does not imply that bulls are to continue pushing the Buck further up. Downside risks still persist and technical indicators support that. Nevertheless, in case the USD/JPY slips below 109.50, the tough demand cluster around 109.00 is expected to cause the pair to rebound. On the other hand, the nearest significant resistance rests only at 111.00, therefore, the US Dollar has sufficient space for a bullish development today.
Traders' Sentiment
Today 68% of traders are long the Buck (previously 69%), while the share of buy orders edged higher from 58 to 60%.
Gold Analysis: Finds Support
'A weaker dollar, Korean tensions and the uncertainty with regard to the U.S. debt ceiling negotiations all have the potential to boost gold higher over the short-term.' – Edward Meir, INTL FCStone (based on Reuters)
Pair's Outlook
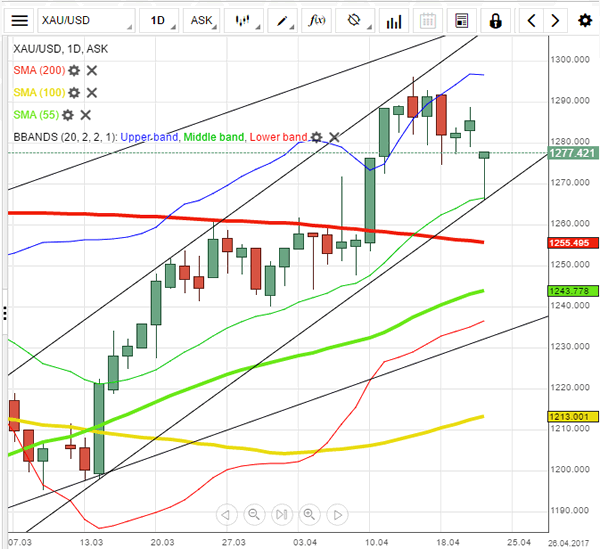
During the early hours of Tuesday's trading session the yellow metal's price declined. However, the bullion had found and revealed the proper borders of a medium term ascending channel pattern during Monday's trading. The lower trend line of the pattern provided support for a rebound of the metal, and it continued to support the bullion on Tuesday. It is highly possible that the trend line will push the commodity price through the resistance levels, which it faces from 1,274 to 1,278. On the other hand, if the support is passed, the bullion could fall to the weekly S2, which is located at 1,263.56.
Traders' Sentiment
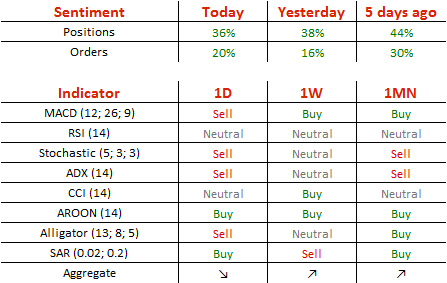
SWFX sentiment remains almost unchanged, as 56% of open positions are short, and 63% of set up orders are to buy the bullion.
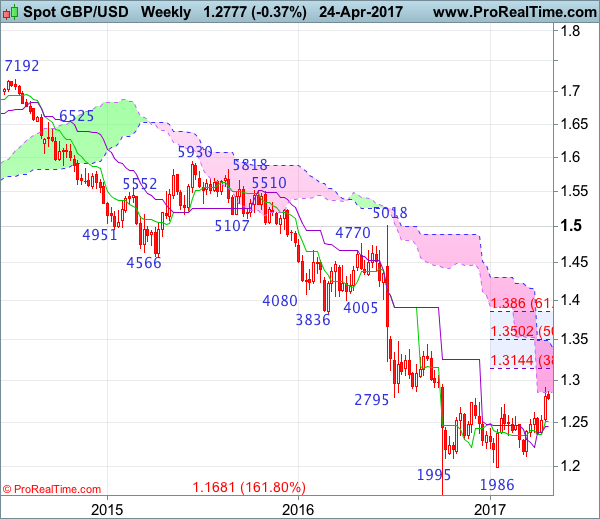
GBP/USD Candlesticks and Ichimoku Analysis
Weekly
• Last Candlesticks pattern: Long white candlestick
• Time of formation: 16 Jan 2017
• Trend bias: Down
Daily
• Last Candlesticks pattern: Long white candlestick
• Time of formation: 18 Apr 2017
• Trend bias: Near term up
GBP/USD – 1.2808
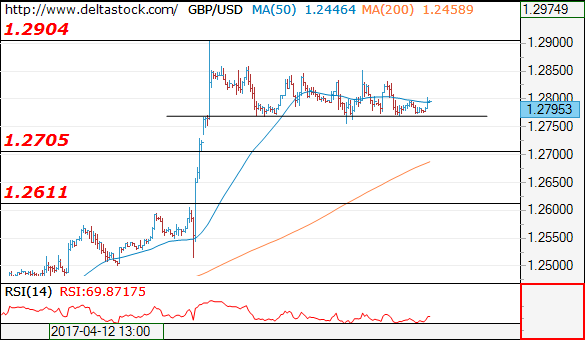
Last week’s rally to as high as 1.2906 adds credence to our view that another leg of the corrective rise from 1.1986 low (Jan low) is underway and upside bias remains for further gain to 1.2940-50, then towards 1.3000 psychological resistance, however, reckon upside would be limited to 1.3090-00 and 1.3140-50 (38.2% Fibonacci retracement of 1.5018-1.1986) would hold on first testing, risk from there is seen for a retreat to take place later.
On the downside, whilst initial pullback towards the Tenkan-Sen (now at 1.2693) cannot be ruled out, reckon downside would be limited to 1.2650-60 and bring another rise later. Below 1.2600-10 would defer and risk test of previous resistance at 1.2575, however, a daily close below this level is needed to suggest top is possibly formed, bring test of support at 1.2515. Only a drop below this level would add credence to this view, then subsequent fall towards 1.2440-50 but support at 1.2365 should remain intact, bring another rise later.
Recommendation: Buy at 1.2710 for 1.2910 with stop below 1.2610.
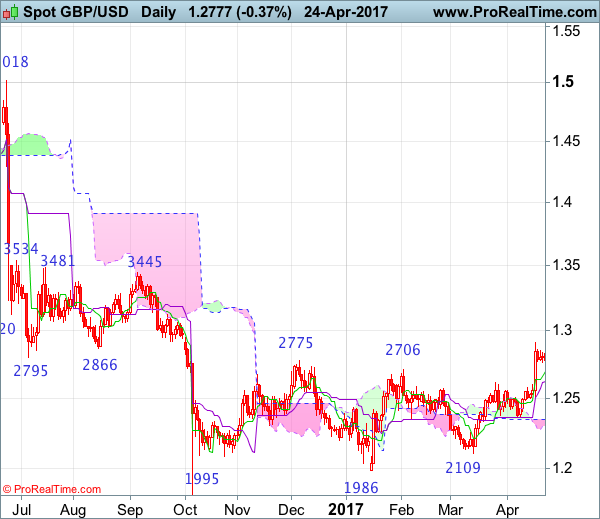
On the weekly chart, as cable has maintained a firm undertone after last week’s rally above resistance at 1.2706 and 1.2775, adding credence to our bullish view that the erratic rise from this year’s low at 1.1986 has resumed and near term upside bias remains for this rise to bring retracement of early decline and gain to 1.2900-10 and then 1.2940-50 would be seen, however, reckon psychological resistance at 1.3000 would limit upside and price should falter well below 1.3140-50 (38.2% Fibonacci retracement of 1.5018-1.1986), bring retreat later.
On the downside, although initial pullback to 1.2750 cannot be ruled out, reckon downside would be limited to another previous resistance at 1.2706 and bring another rise later. Below 1.2640-50 would risk test of previous resistance at 1.2616, break there would defer and suggest top is possibly formed, bring weakness to 1.2550-60 but last week’s low at 1.2515 should hold, bring another rise later. Only a drop below 1.2500 would abort and signal top is formed instead, then test of the Kijun-Sen (now at 1.2446) would follow but support at 1.2365 should remain intact.
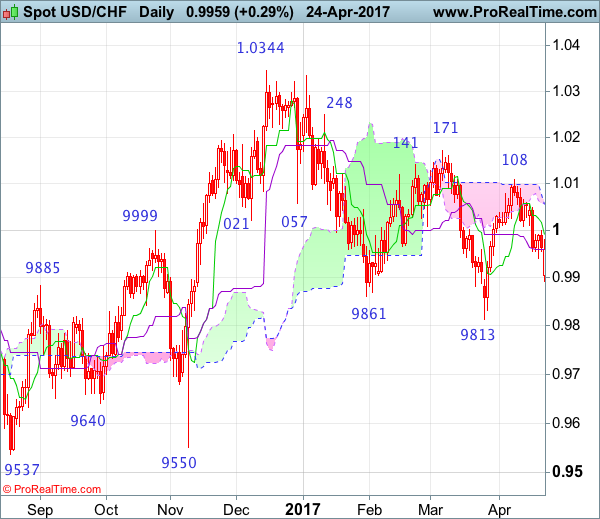
USD/CHF Candlesticks and Ichimoku Analysis
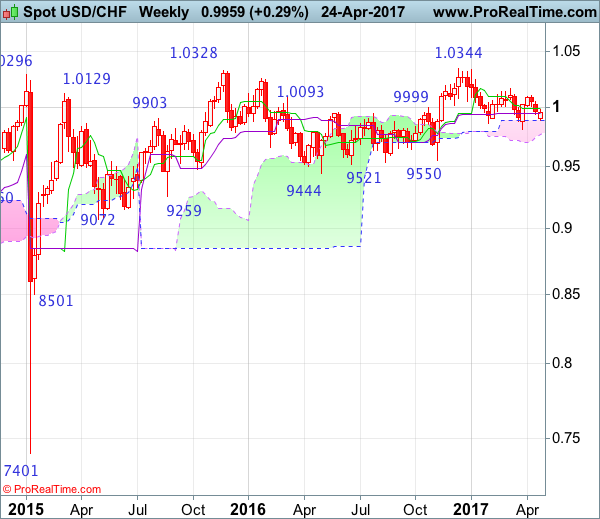
Weekly
• Last Candlesticks pattern: Doji
• Time of formation: 26 Sep 2016
• Trend bias: Sideways
Daily
• Last Candlesticks pattern: Shooting star
• Time of formation: 25 Oct 2016
• Trend bias: Near term up
USD/CHF – 0.9978
Although the greenback opened lower yesterday and fell to as low as 0.9893, the subsequent rebound suggests consolidation above this level would be seen and as long as this support holds, prospect of another bounce 1.0000-08 resistance remains, a daily close above there would signal low is formed, then gain to 1.0025-30 (61.8% Fibonacci retracement of 1.0108-0.9893) would be seen, however, break of 1.0067 is needed to retain bullishness and signal the retreat from 1.0108 has ended, bring retest of this level later, break there would extend the rebound from 0.9813 towards key resistance at 1.0171. Looking ahead, only a sustained breach above this level would add credence to our view that the erratic decline from 1.0344 top has ended at 0.9813, bring further rise to 1.0200-10, then 1.0250 but price should falter well below said resistance at 1.0344 (2016 high).
On the downside, below said support at 0.9893 would abort and signal the rebound from 0.9813 has ended instead, bring another fall to this level. Looking ahead, only a drop below said support at 0.9813 would revive bearishness and signal the decline from 1.0344 top has resumed instead and extend further fall to 0.9735-40 (76.4% retracement of 0.9550-1.0344) and later towards 0.9700 but reckon 0.9650-60 would hold.
Recommendation: Hold long entered at 0.9990 for 1.0190 with stop below 0.9890.
On the weekly chart, although dollar opened lower yesterday, still reckon the upper Kumo (now at 0.9886) would limit downside and bring rebound later to the Tenkan-Sen (now at 0.9992) but break of resistance at 1.0067 is needed to retain bullishness and signal the retreat from 1.0108 has ended, bring retest of this level. A break above 1.0108 would extend the rebound from 0.9813 to resistance at 1.0171, however, a weekly close above this level is needed to confirm the fall from 1.0344 top has ended at 0.9813, bring further subsequent rise towards key resistance at 1.0248. A sustained breach above this level would signal early upmove has possibly resumed, bring test of 1.0335-44 resistance area, above there would provide confirmation and headway to 1.0400-10 and later 1.0500 would follow.
On the downside, below the upper Kumo (now at 0.9886) would defer but only break of indicated support at 0.9813 would abort and signal the erratic fall from 1.0344 top is still in progress, bring further decline for retracement of early upmove to 0.9735-40, then 0.9700 but reckon downside would be limited to 0.9640-50 and price should stay well above support at 0.9550.
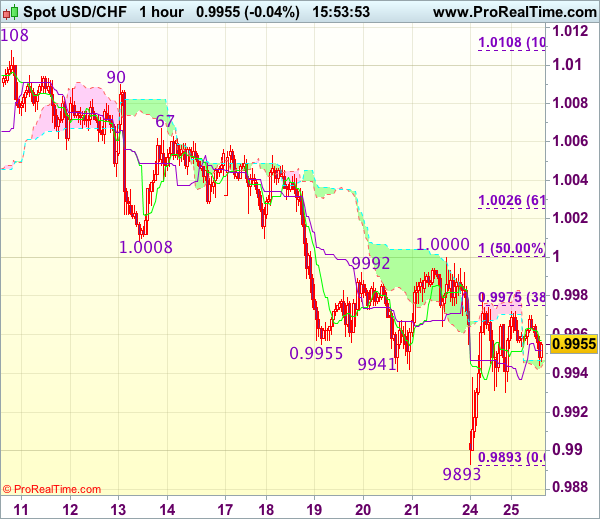
Trade Idea : USD/CHF – Stand aside
USD/CHF - 0.9954
Most recent candlesticks pattern : N/A
Trend : Near term down
Tenkan-Sen level : 0.9957
Kijun-Sen level : 0.9951
Ichimoku cloud top : 0.9947
Ichimoku cloud bottom : 0.9945
New strategy :
Stand aside
Position : -
Target : -
Stop : -
Despite dropping to 0.9893 yesterday, lack of follow through selling and the subsequent rebound suggest consolidation above this level would be seen and another bounce to 0.9975-80 cannot be ruled out, however, reckon 1.0000 (said resistance and 50% Fibonacci retracement of 1.0108-0.9893) would limit upside and bring another decline later. Below said support at 0.9893 would extend the fall from 1.0108 top to 0.9865-70 (2 times extension of 1.0108-1.0008 measuring from 1.0067) but support at 0.9831 would hold, bring rebound later.
In view of this, would be prudent to stand aside in the meantime. Above previous support at 1.0008 would suggest low is formed instead, bring rebound to 1.0025-30 (61.8% Fibonacci retracement of 1.0108-0.9893) but price should falter below resistance at 1.0067.
Trade Idea : GBP/USD – Buy at 1.2710
GBP/USD - 1.2807
Most recent candlesticks pattern : N/A
Trend : Near term up
Tenkan-Sen level : 1.2797
Kijun-Sen level : 1.2803
Ichimoku cloud top : 1.2808
Ichimoku cloud bottom : 1.2805
Original strategy :
Buy at 1.2710, Target: 1.2850, Stop: 1.2675
Position : -
Target : -
Stop : -
New strategy :
Buy at 1.2710, Target: 1.2850, Stop: 1.2675
Position : -
Target : -
Stop : -
Cable has remained confined within near term established range and further sideways trading is in store, whilst another test of Friday’s low at 1.2757 cannot be ruled out, reckon downside should be limited to 1.2700-10 (50% Fibonacci retracement of 1.2515-1.2906) and bring another rally, break of 1.2859 would signal the pullback from 1.2906 has ended, bring retest of this level, above there would extend recent upmove to 1.2920-30 (2 times extension of 1.2365-1.2575 measuring from 1.2500), then 1.2950 but loss of upward momentum should prevent sharp move beyond 1.2990-00 (1.236 times projection of 1.2109-1.2616 measuring from 1.2365 and psychological resistance).
In view of this, would not chase this rise here and would be prudent to buy cable on subsequent pullback as downside should be limited to 1.2710 (50% Fibonacci retracement of 1.2515-1.2906), bring another rise. Below 1.2700 would defer and signal top has been formed, risk correction to 1.2660-65 (61.8% Fibonacci retracement of 1.2515-1.2906) and price should stay well above 1.2608-16 (previous resistance now support).
Forex Technical Analysis: EUR/USD, USD/JPY, GBP/USD
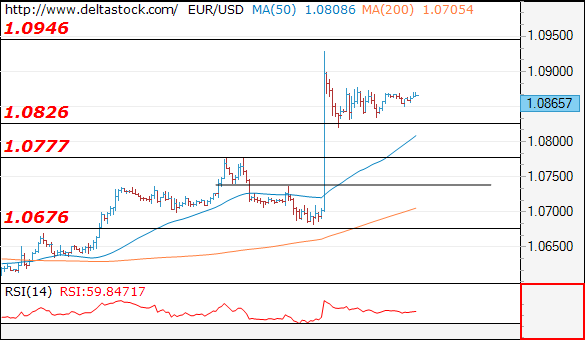
EUR/USD
Current level - 10865
The intraday bias is neutral above 1.0828 minor support, but a break through the latter will challenge 1.0780 area. Key resistance lies at 1.0940.
| Resistance | Support | ||
| intraday | intraweek | intraday | intraweek |
| 1.0940 | 1.0946 | 1.0826 | 1.0675 |
| 1.0946 | 1.1010 | 1.0780 | 1.0490 |
USD/JPY
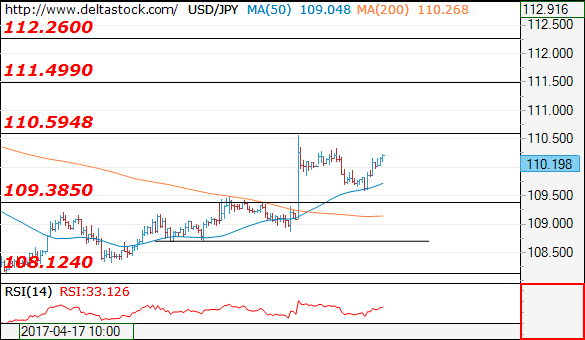
Current level - 110.19
Yesterday's corrective pullback filled the gap above 109.40 and the outlook is positive, for a rise towards 111.50 area.
| Resistance | Support | ||
| intraday | intraweek | intraday | intraweek |
| 110.55 | 112.26 | 110.10 | 109.40 |
| 111.50 | 113.50 | 109.40 | 108.12 |
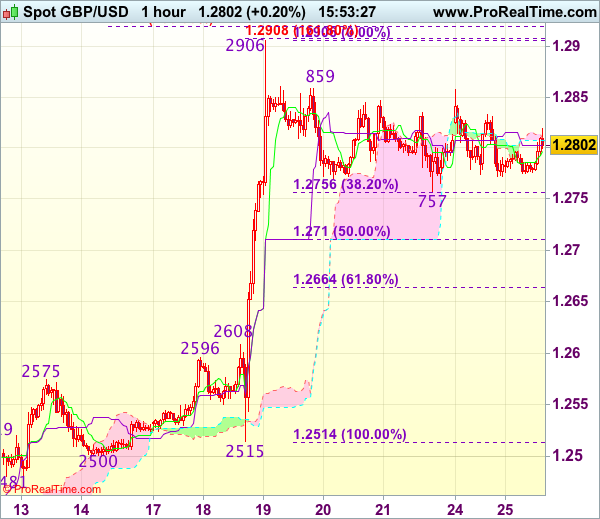
GBP/USD
Current level - 1.2795
The lack of trend dynamics here signals a break through 1.2770, for a dip to 1.2705 support area.
| Resistance | Support | ||
| intraday | intraweek | intraday | intraweek |
| 1.2904 | 1.3000 | 1.2770 | 1.2610 |
| 1.3000 | 1.3500 | 1.2705 | 1.2510 |