Sample Category Title
EUR/USD Analysis: Reaches 1.0950 Mark
'Investors' focus is now shifting to the European Central Bank's meeting later this week.'– Stefania Spezzati, Bloomberg
Pair's Outlook
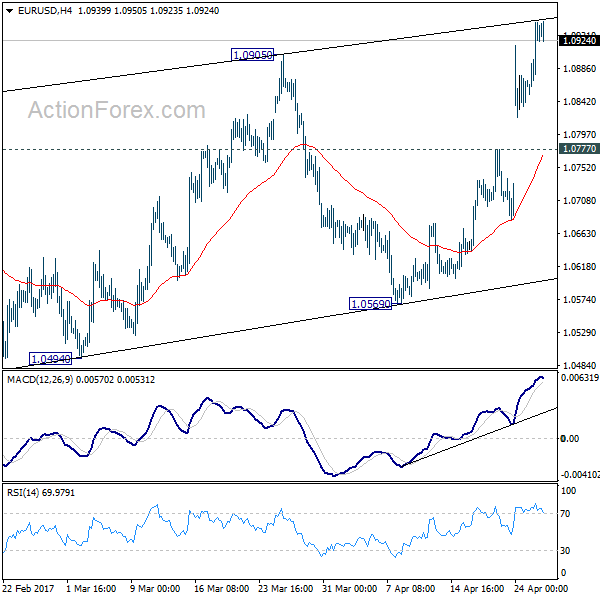
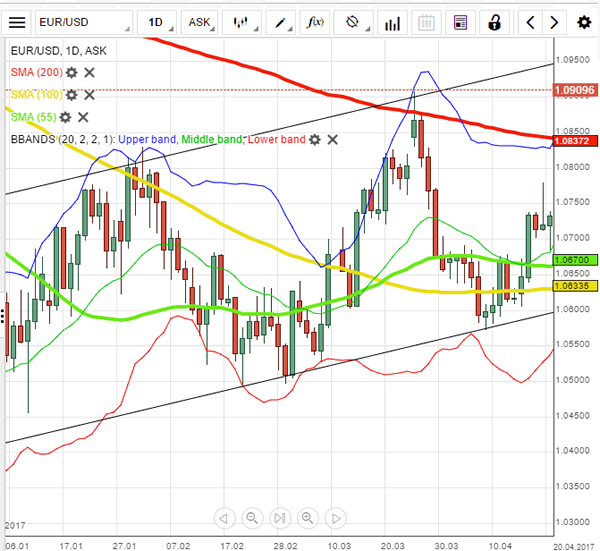
On Wednesday morning the common European currency had reached the 1.0950 mark against the US Dollar. Initially it might seem that the pair will surge to the weekly R3 and the 50.00% Fibonacci retracement level, which are both located at 1.0978. However, the pair faces the upper trend line of the long term ascending channel pattern. On Wednesday the trend line was located at the 1.0958 mark. Due to that reason a bounce off from the resistance level is possible. In that case the pair would retreat back to the 1.0880 level, where close by the weekly R2 and the monthly R1 are residing.
Traders' Sentiment
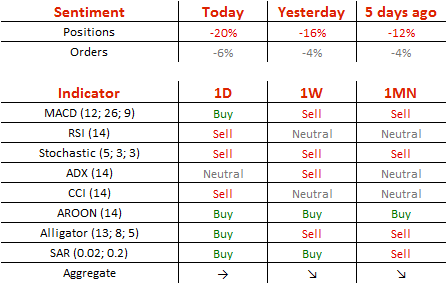
Traders remain bearish on the pair, as 60% of open positions are short. In addition, 53% of trader set up orders are to sell the Euro.
GBP/USD Analysis: To Bounce Back From 1.2850
'The pound's euphoric rally on last week's snap election news could be at further risk if the market loses confidence in the election's ability to make for easier negotiations with the EU.' – LMAX (based on Business Recorder)
Pair's Outlook
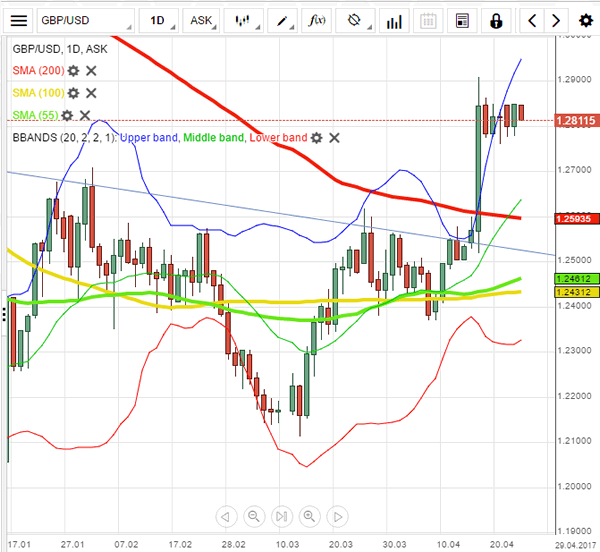
On Tuesday, the Cable behaved in accordance with expectations, having appreciating, but with the 1.2850 psychological level limiting the intraday gains. Consequently, since the pair reached its consolidation trend's upper border, a bearish development is now likely to prevail. The 1.2750 mark is the intraday bottom floor, but the exchange rate could also struggle moving below 1.2780. However, technical indicators are unable to confirm the possibility of the negative, as they keep giving bullish signals in the daily timeframe. As a result, we should not rule out the chance of the Pound breaking the 1.2850 handle and reclaiming the 1.29 mark, although this scenario is highly unlikely.
Traders' Sentiment
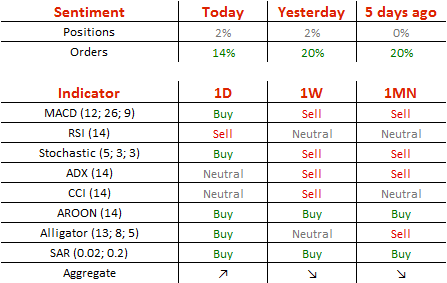
Traders remain relatively neutral, with 51% of all open positions being long and the other 49% being short the Sterling against the US Dollar.
USD/JPY Analysis: Attempts To Remain Above 111.00
'It's too early to say that the dollar will keep trending higher and head above the peak it saw in March [115.51 on March 10].' – Bank of Tokyo-Mitsubishi UFJ (based on Reuters)
Pair's Outlook
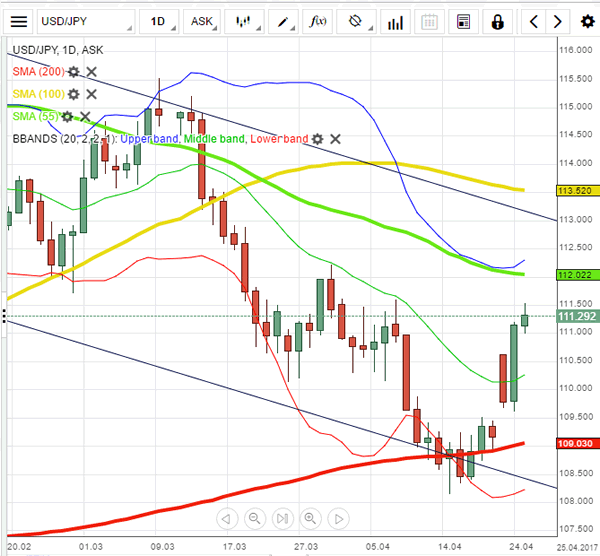
Yesterday the Buck slightly exceeded expectations, as it managed to appreciate beyond the 111.00 level against the Japanese Yen. With the breach of this mark the US Dollar now has the opportunity to continue outperforming the Yen. However, before reaching the descending channel's upper boundary, there is still one resistance the pair has to pierce on its path, namely the cluster around 112.15, formed by the 55-day SMA, the upper Bollinger band and the monthly pivot point. On the other hand, after Tuesday's strong rally the Greenback could take a breath and ease on gains, but ultimately no significant changes in either direction are expected today due to absence of solid market movers.
Traders' Sentiment
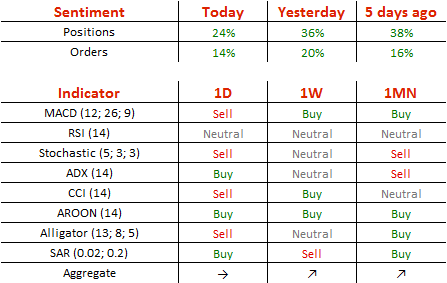
For the fifth consecutive time market sentiment worsened, with 62% of all open positons now being long (previously 68%).
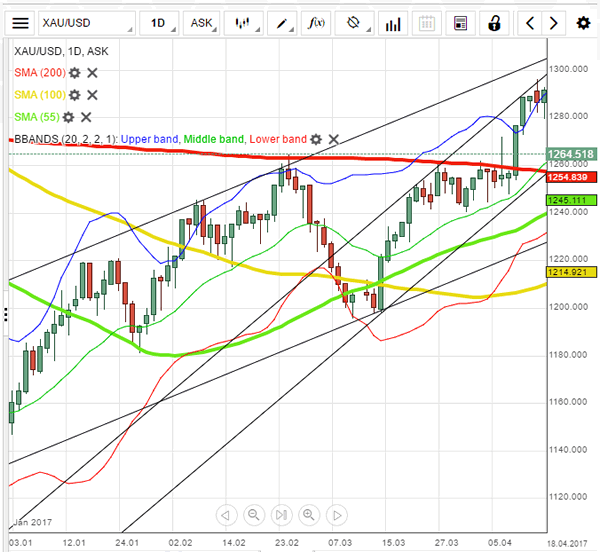
Gold Analysis: Falls Below 1,265
'Over the past two sessions, the momentum for gold to move ahead has actually faded away. We can see that risk appetite has increased after the easing situation in North Korea and French election results.' – Mark To, Wing Fung Financial Group (based on Reuters)
Pair's Outlook
The yellow metal's price has reached the second weekly support, which is located at the 1,263.56 level. If the bullion passes the support level, the commodity price is most likely going to retreat down to the combined support of the 200-day SMA at 1,263.35 and the weekly S3 at 1,252.84 level. On the other hand a rebound might occur. In the case of a rebound the bullion's price is most likely going to surge up to the 20-day SMA, which is located at the 1,269.90 level, and afterwards the weekly S1 at 1,274.27 would be the next target.
Traders' Sentiment
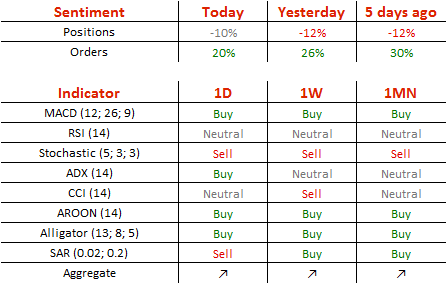
Trader open positions are 55% bearish. However, 60% of trader set up orders are to buy the metal.
US CB Consumer Confidence Index Drops 3.8% In April
'Consumer confidence is starting to reflect the realities of governing, not the hopes that the swamp will be drained.' - Joel Naroff, Naroff Economic Advisors
The Conference Board Consumer Confidence Index dropped more than experts estimated. In April, it lost 3.8% and reached 120.3, thus, marking the first decline since January. The fall was mainly attributable to the less optimistic view of business conditions and the labour market in the upcoming six months. As a result, the number of respondents, who evaluated business conditions as 'good', decreased from 32.4% to 30.2% and the share of those, who assessed the available number of jobs in the market as 'plentiful', plunged from 31.8% to 30.8%. In addition, the number of people who evaluated business conditions as 'bad' increased slightly from 13.1% to 13.8%. Yet, the share of consumers that believed jobs were 'hard to get' remained unchanged at 19.1%. The Conference Board's data confirmed the view that in the short-run consumers would likely to limit their spending and put more emphasis on savings accumulation. Tuesday's data also showed that the number of people, who thought that business conditions would worsen over the next six months, rose from 8.5% to 10.9%, while the share of those expecting weaker job creation surged from 12.7% to 13.1%. Nevertheless, the majority of respondents still believed that the economy would continue growing in the months ahead.
Forex Technical Analysis: EUR/USD, USD/JPY, GBP/USD
EUR/USD
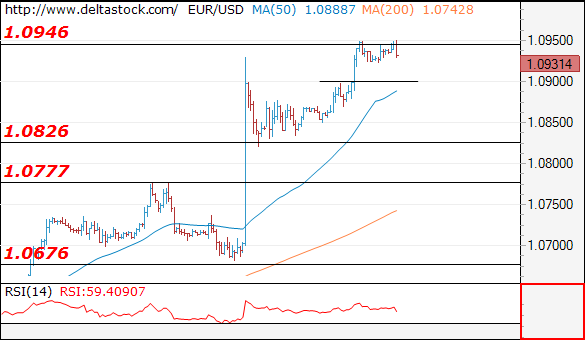
Current level - 10931
Yesterday's rise performed a precise test of 1.0950 resistance and the intraday bias is still positive with an initial support at 1.0900. Crucial on the downside is 1.0826.
| Resistance | Support | ||
| intraday | intraweek | intraday | intraweek |
| 1.0946 | 1.0946 | 1.0900 | 1.0780 |
| 1.1010 | 1.1010 | 1.0826 | 1.0676 |
USD/JPY
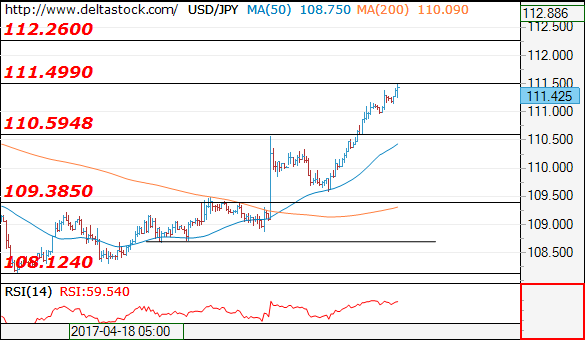
Current level - 111.42
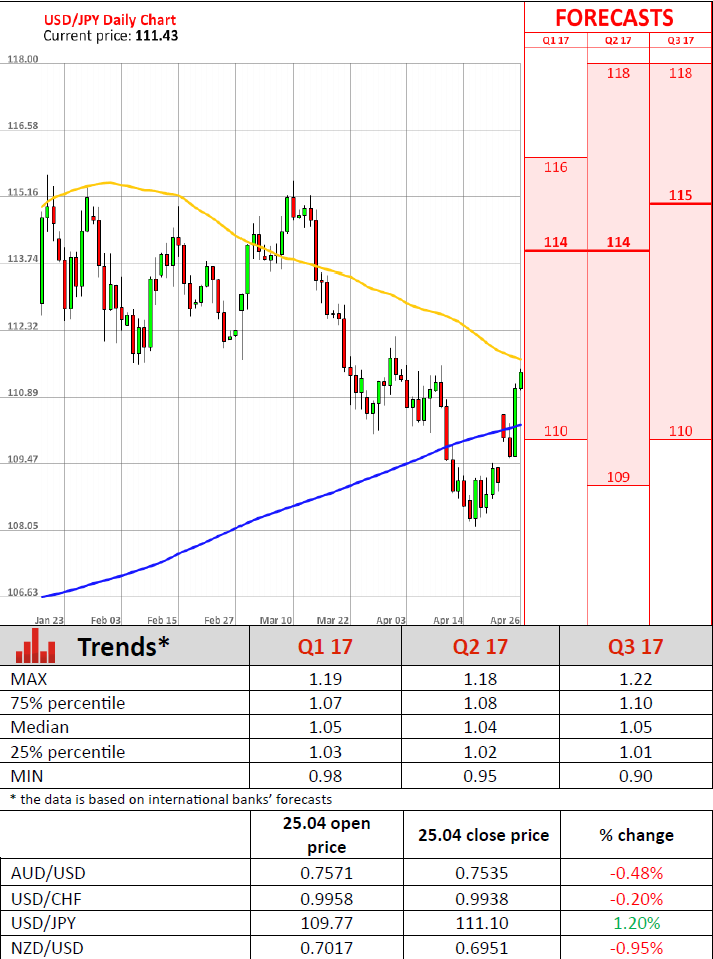
The uptrend is intact, ready for a break through 111.50, towards 112.26 resistance area. Initial support is projected at 110.50, followed by the crucial one at 109.40.
| Resistance | Support | ||
| intraday | intraweek | intraday | intraweek |
| 111.50 | 112.26 | 110.50 | 109.40 |
| 112.26 | 113.50 | 109.40 | 108.12 |
GBP/USD
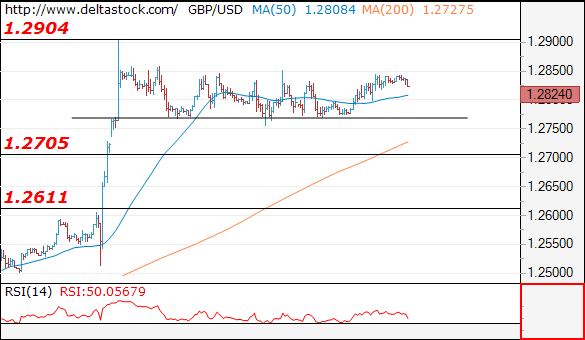
Current level - 1.2824
The bias remains neutral within the consolidation pattern below 1.2904 peak, with a risk of a dip towards 1.2705 area.
| Resistance | Support | ||
| intraday | intraweek | intraday | intraweek |
| 1.2904 | 1.3000 | 1.2770 | 1.2610 |
| 1.3000 | 1.3500 | 1.2705 | 1.2510 |
USDJPY Undergoing A Bullish Reversal, More Upside In View
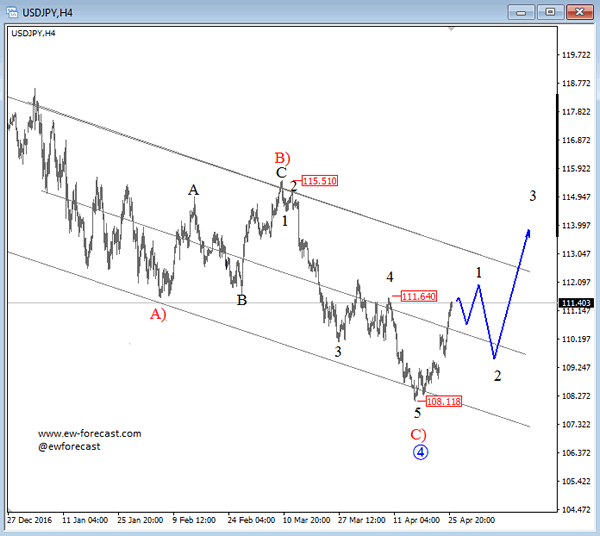
On the updated chart of USDJPY, we can see a strong recovery taking place, from around the 108.12 level where a bigger three wave A)-B)-C) pattern was completed. That said current reversal is viewed as wave 1, the first wave of a possible five wave development that may take weeks to follow. A breach above the previous wave 4 at 111.64 level would be a confirmation for higher levels to come.
USDJPY, 4H
USD/CAD Daily Outlook
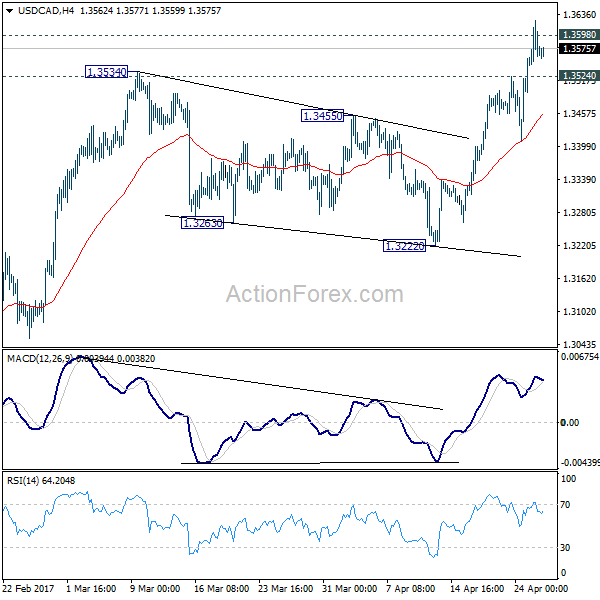
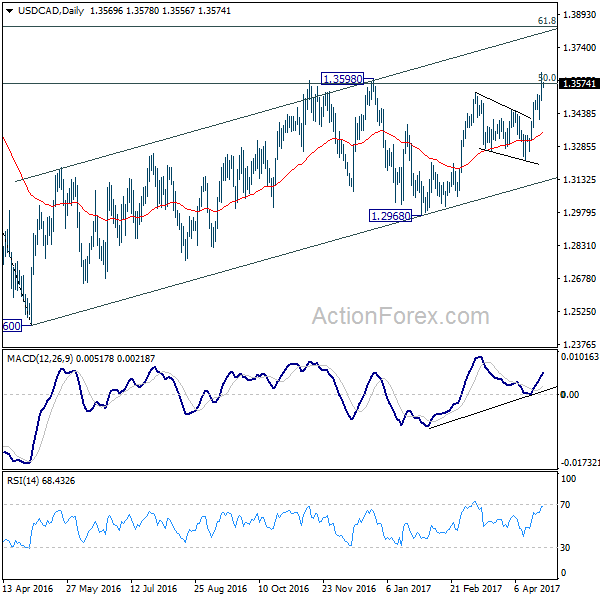
Daily Pivots: (S1) 1.3502; (P) 1.3564; (R1) 1.3635; More....
Intraday bias in USD/CAD remains on the upside for the moment. Sustained break of 1.3598 will confirm resumption of medium term rise from 1.2460. In that case, USD/CAD should target next medium term fibonacci level at 1.3838. On the downside, below 1.3524 minor support will turn bias neutral and bring retreat. But downside should be contained well above 1.3222 support and bring another rise.
In the bigger picture, price actions from 1.4689 medium term top are seen as a correction pattern. The first leg has completed at 1.2460. The second leg from 1.2460 is likely still in progress and could target 61.8% retracement of 1.4689 to 1.2460 at 1.3838. We'd look for reversal signal there to start the third leg. However, break of 1.2968 will argue that the third leg has already started and should at least bring a retest of 1.2460 low. Meanwhile, sustained trading above 1.3838 would pave the way to retest 1.4689 high.
AUD/USD Daily Outlook
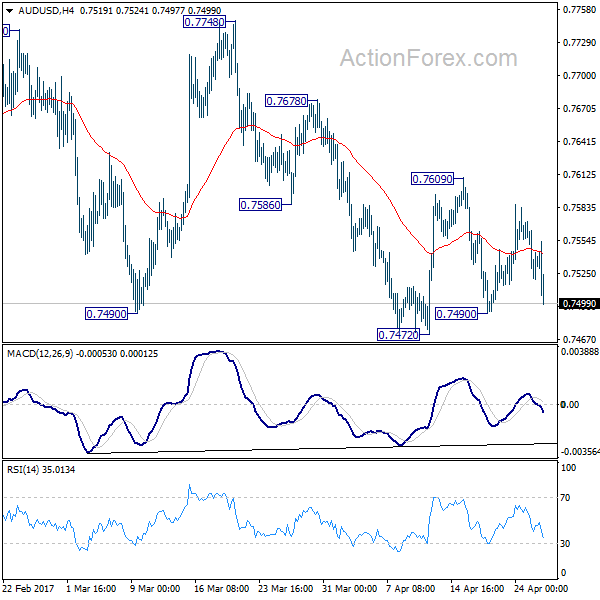
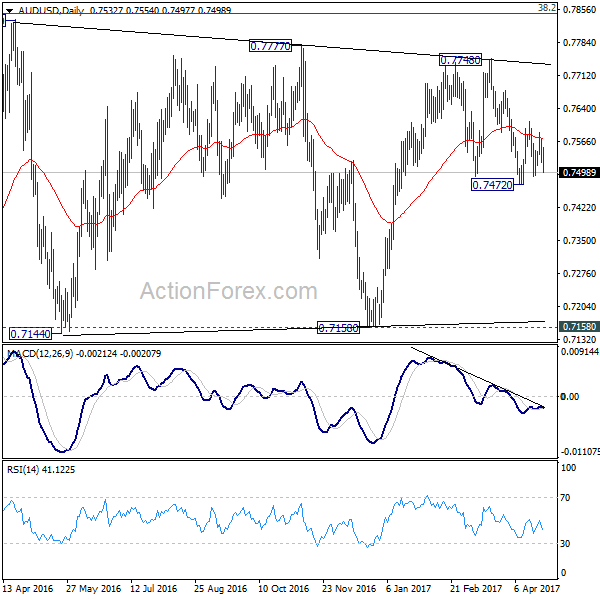
Daily Pivots: (S1) 0.7512; (P) 0.7542; (R1) 0.7564; More...
Intraday bias in AUD/USD is turned neutral first. On the downside, below 0.7490 minor support will likely send the pair through 0.7472 near term support. In that case, whole rise from 0.7150 should be completed at 0.7748. Outlook will then be turned bearish for retesting 0.7144/58 support zone. On the upside, above 0.7609 resistance will turn bias to the upside for retesting 0.7748 instead.
In the bigger picture, we're still treating price actions from 0.6826 low as a correction. And, as long as 38.2% retracement of 0.9504 to 0.6826 at 0.7849 holds, long term down trend from 1.1079 is expected to resume sooner or later. Break of 0.6826 low will target 0.6008 key support level. However, firm break of 0.7849 will indicate that rise from 0.6826 is developing into a medium term rebound, rather than a sideway pattern. In such case, stronger rise should be seen to 55 month EMA (now at 0.8144) and above.
EUR/USD Daily Outlook
Daily Pivots: (S1) 1.0868; (P) 1.0909 (R1) 1.0967; More....
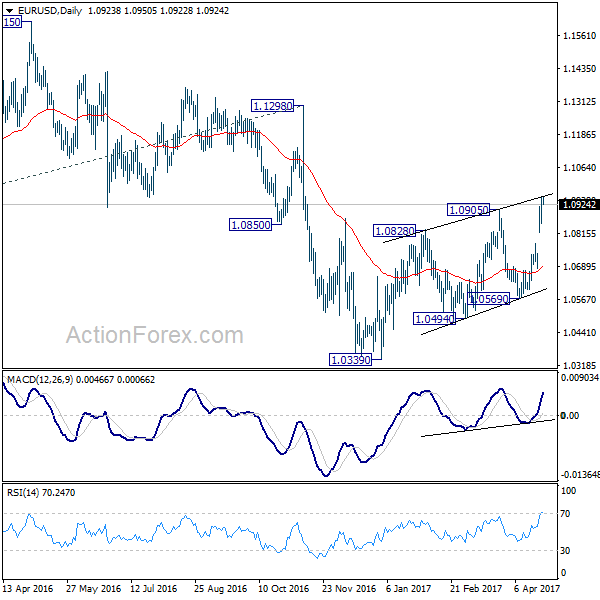
EUR/USD's rise is still in progress and intraday bias remains on the upside. Note again that rise from 1.0339 is in progress and would extend higher towards 1.1298 resistance. But still, such rally is seen as a corrective move. Hence, we'd pay attention to topping signal above 1.0905 and below 1.1298 key resistance. On the downside, below 1.0777 minor support will turn bias to the downside for 1.0569 support first.
In the bigger picture, as long as 1.1298 key resistance holds, whole down trend from 1.6039 (2008 high) is still expected to continue. Break of 1.0339 low will send EUR/USD through parity to 61.8% projection of 1.3993 to 1.0461 from 1.1298 at 0.9115. However, considering bullish convergence condition in weekly MACD, break of 1.1298 will indicate term reversal. this would also be supported by sustained trading above 55 week EMA.