Sample Category Title
Market Update – Asian Session: Australia CPI Returns To RBA Target Range
Asia Mid-Session Market Update: Australia CPI returns to RBA target range; Risk-on flows continue on earnings and Trump tax cut speculation
US Session Highlights
(US) Apr Philadelphia Fed Non-Manufacturing General Regional Business Conditions: 30.1 v 35.4 prior
(CO) Colombia Central Bank Gov Echavarria: Sees room to cut interest rates - financial press
(US) Weekly Redbook Sales w/e Apr 22nd +1.7% y/y; Apr MTD +1.2% m/m; Apr MTD +1.9% y/y
APR RICHMOND FED MANUFACTURING INDEX: 20 V 16E
(US) MAR NEW HOME SALES: 621K V 584KE (strongest level since July)
(US) APR CONSUMER CONFIDENCE: 120.3 V 122.5E (outlook for jobs market was also less upbeat)
Stock markets continue to extend the rally that started the week on renewed confidence in Euro area stability and strong earnings data expectations. S&P profits were estimated to have risen 11% in Q1, the most since 2011. Talk of a new tax deal also helped the Dow break 21,000 and the NASDAQ pierce the 6,000 ceiling for the first time.
US markets on close: Dow 1.1%, S&P500 0.6%, Nasdaq 0.7%
Best Sector in S&P500: Materials
Worst Sector in S&P500: Telecommunication
Biggest gainers: CAT +7.9%; FCX +7.1%; WAT +6.9%; NFLX +5.8%
Biggest losers: R -13.8%; ESRX -10.7%; TROW -4.2%; LH -3.9%
At the close: VIX 10.8 (-0.1pts); Treasuries: 2-yr 1.28% (+5bps), 10-yr 2.33% (+5bps), 30-yr 2.98% (+5bps)
US movers afterhours
IRBT Reports Q1 $0.58 v $0.26e, R$168.5M v $151Me; +9.9% afterhours
EW Reports Q1 $0.94 v $0.82e, R$884M v $777Me- Guides Q2 $0.82-0.92 v $0.86e, R$810-850M v $817Me - Raises FY17 $3.43-3.55 v $3.40e; +8.5% afterhours
DECK Announces review of strategic alternatives; +5.7% afterhours
CMG Reports Q1 $1.60 v $1.28e, R$1.07B v $1.05Be; Discloses recent incident of unauthorized activity on its payment network; +2.9% afterhours
COF Reports Q1 $1.75 v $1.93e, R$6.5B v $6.59Be; -3.3% afterhours
DFS Reports Q1 $1.43 v $1.42e, R$1.89B v $1.81Be; Provision for loan losses $586M v $424M y/y; -3.5% afterhours
CREE Reports Q3 $0.11 v $0.14e, R$341.5M v $325Me; to form JV with China's San'an Optoelectronics Co; -7.5% afterhours
X Reports Q1 -$0.83 v +$0.30e, R$2.73B v $2.92Be; Cuts FY17 adjusted EBITDA $1.1B v $510M y/y (prior FY17 adjusted EBITDA $1.3B); -16.9% afterhours
Key economic data
(AU) AUSTRALIA Q1 CONSUMER PRICES (CPI) Q/Q: 0.5% V 0.6%E; Y/Y: 2.1% (highest since Q2 of 2014) V 2.2%E; TRIMMED MEAN Q/Q: 0.5% V 0.5%E ; Y/Y: 1.9% (5-quarter high) V 1.8%E
(AU) AUSTRALIA MAR SKILLED VACANCIES M/M: -0.6% V -0.3% PRIOR
(NZ) New Zealand Mar Net Migration: 6.1K v 6.0K prior
(NZ) NEW ZEALAND MAR CREDIT CARD SPENDING M/M: +0.8% V -1.4% PRIOR; Y/Y: 7.1% V 5.3% PRIOR
(US) Kelley Blue Book: New-car sales to fall 3% to 1.45M units in April 2017; 2017 forecast calls for 16.8-17.3M in sales, first y/y decline after 7 years of increases
Asia Session Notable Observations, Speakers and Press
Asian equity indices remain bid, tracking 2nd straight day of strong gains on Wall St. Optimism from weekend French election has been displaced by expectation of pro-business tax reform announcement from the White House on Wednesday. One press report anticipates the plan to feature tax cuts for small pass-through businesses to 15% from 39.6%, along with a 10% levy on US companies offshore profits. Treasury Sec Mnuchin and EA Cohn have met with Congressional leaders Tues evening, and White House suggests "everyone is on the same page". The tax plan will also reportedly not contain House Speaker Ryan's border-adjustment proposal.
In FX, dollar majors were rangebound for much of the Asia session. USD/JPY tracked rick-on flows to the upside, regaining ¥111 handle to approach 111.50 for a 2-week high. AUD/USD was also volatile following mixed Q1 CPI data from Australia. While headline y/y moved back into RBA 2-3% target range for the first time in 2 years, it missed expectations, sending AUD down over 30pips toward $0.75 level. Analysts also noted that much of the price increase was in auto fuel and housing, ominously implying living costs are outpacing wage gains. Capital Economics said it no longer expects RBA rate cuts after the CPI data, but Barclays believes RBA will wait for CPI to be consistent above 2% before signalling policy shifts.
China
(CN) China Iron and Steel Association (CISA): Increase in domestic output and decline in export demand to weigh on prices - press
(CN) China NDRC: To monitor long term coal supply contract implementation
(CN) China's monetary policy does not need to be too tight - Chinese press citing unidentified analysts
Japan
(JP) Japan Fin Min Aso: Regional economies are experiencing moderate recovery
Australia/New Zealand
(AU) Capital Economics: No longer expect RBA to cut rates further after today's CPI data - SMH
(NZ) New Zealand's Home Loan Affordability Reports sees prices in Auckland the least affordable on record (since 2004) - NZ press
Korea
(KR) US military reportedly starts moving THAAD anti-ballistic missile system into planned site in South Korea - Korea press
Asian Equity Indices/Futures (00:00ET)
Nikkei +0.7%, Hang Seng +0.6%, Shanghai Composite +0.4%, ASX200 +0.7%, Kospi +0.3%
Equity Futures: S&P500 flat; Nasdaq flat, Dax +0.1%, FTSE100 flat
FX ranges/Commodities/Fixed Income (00:00ET)
EUR 1.0920-1.0945; JPY 110.95-111.35; AUD 0.7505-0.7555; NZD 0.6920-0.6955
June Gold -0.1% at 1,266/oz; June Crude Oil -0.2% at $49.44/brl; July Copper -0.1% at $2.60/lb
(US) Weekly API Oil Inventories: Crude: +0.9M v -0.8M prior; first buld in 4 weeks
SLV iShares Silver Trust ETF daily holdings rise to 10,178 tonnes from 10,119 tonnes prior
GLD SPDR Gold Trust ETF daily holdings fall 5.9 tonnes to 854.3 tonnes
USD/CNY (CN) PBOC SETS YUAN MID POINT AT 6.8845 V 6.8833 PRIOR
(CN) PBOC to inject combined CNY80B v CNY80B prior in 7-day, 14-day and 28-day reverse repos, 7th straight injection
(CN) China MoF sells 3-yr bonds; avg yield 3.23%; bid-to-cover 1.59x
Asia equities / Notables / movers by sector
Australia
A2 Milk (A2M) +6.7%; Harbour Asset Management announces notice of initial substantial holder with 5.1% stake
BHP (BHP) +0.7%; Q3 production
Beadell (BDR) -16.7%; Q3 production
Japan
Mitsui OSK (9104) +2.4%; FY17 earnings speculation
Hitachi (6501) +3.1%; May sell chip unit
Toshiba (6502) +2.7%; May change auditing firms
Asahi Kasei (3407) +1.4%; FY16/17 earnings speculation
Hong Kong
China Vanke (2202) -3.1%; suspected to sell property in 2 Xian projects illegally
Wynn Macau (1128) +4.8%; Q1 results
China CITIC (998) -0.8%; Q1 results
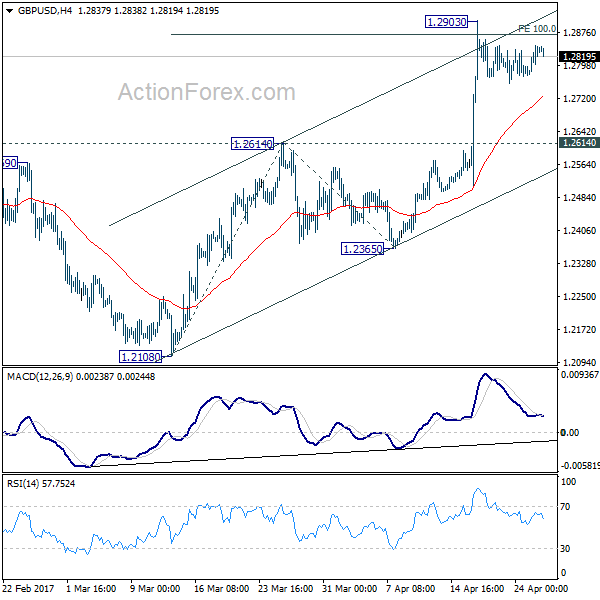
GBP/USD Daily Outlook
Daily Pivots: (S1) 1.2792; (P) 1.2818; (R1) 1.2863; More...
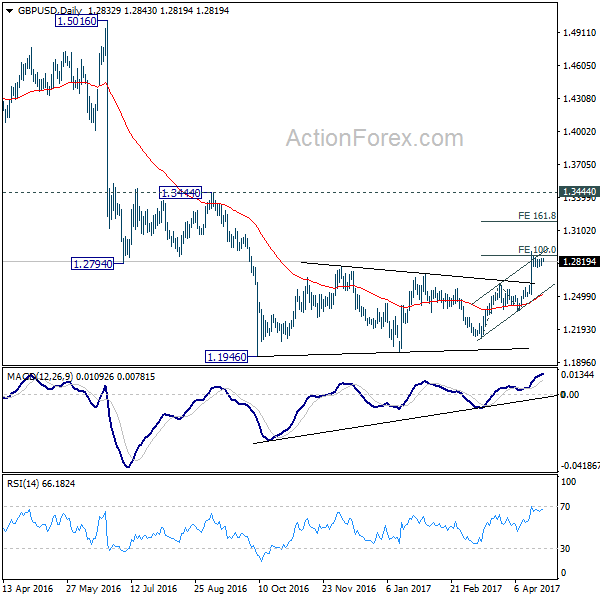
Intraday bias in GBP/USD remains neutral for consolidation below 1.2903. As long as 1.2614 resistance turned support holds, further rally is expected. Firm break of 100% projection of 1.2108 to 1.2614 from 1.2365 at 1.2871 will target 161.8% retracement at 1.3184. Still, price actions from 1.1946 are seen as a correction. Hence we'd expect strong resistance below 1.3444 to bring larger down trend resumption. On the downside, break of 1.2614 resistance turned support will turn bias back to the downside for 1.2365 support first.
In the bigger picture, fall from 1.7190 is seen as part of the down trend from 2.1161. There is no sign of medium term reversal yet. Sustained trading below 61.8% projection of 2.1161 to 1.3503 from 1.7190 at 1.2457 will target 100% projection at 0.9532. Overall, break of 1.3444 resistance is needed to confirm medium term bottoming. Otherwise, outlook will remain bearish.
USD/CHF Daily Outlook
Daily Pivots: (S1) 0.9911; (P) 0.9940; (R1) 0.9962; More.....
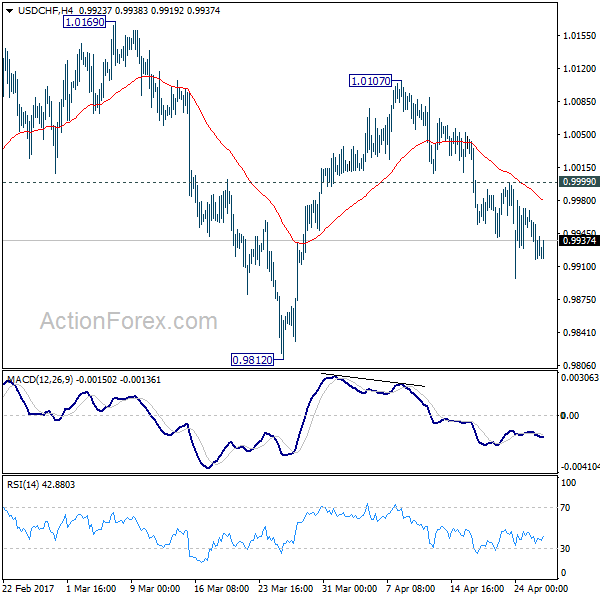
Downside momentum in USD/CHF remains a bit unconvincing as seen in 4 hour MACD. But with 0.9999 minor resistance intact, deeper fall is still expected. Current decline from 1.0107 will extend to 0.9812 support and below. Fall from 1.0342 is seen as a correction. Hence, we'll look for bottoming signal below 0.9812. Meanwhile, on the upside, above 0.9999 minor resistance will turn bias back to the upside for 1.0107 resistance instead.
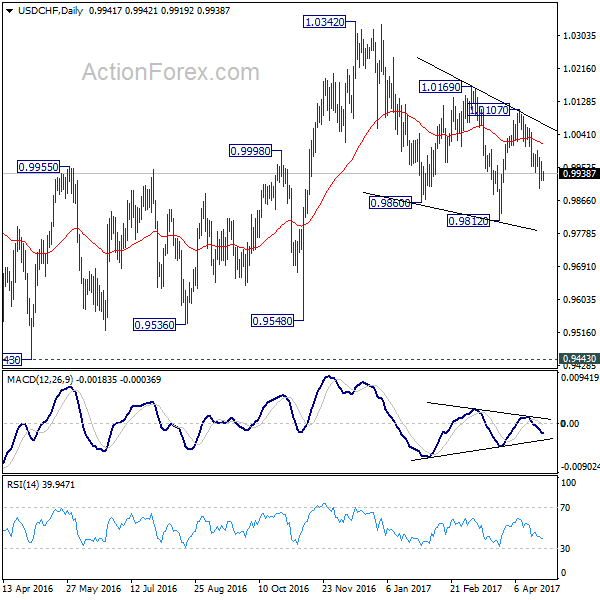
In the bigger picture, we're still maintaining that firm break of 1.0342 key resistance is needed to confirm underlying bullish momentum in the cross. However, the corrective nature of the fall from 1.0342 is starting to give the medium term outlook a bullish favor. Hence, in stead of looking for topping signal around 1.0342, we'd now pay closer attention to upside acceleration as USD/CHF approaches this level again.
USD/JPY Daily Outlook
Daily Pivots: (S1) 110.04; (P) 110.62; (R1) 111.65; More....
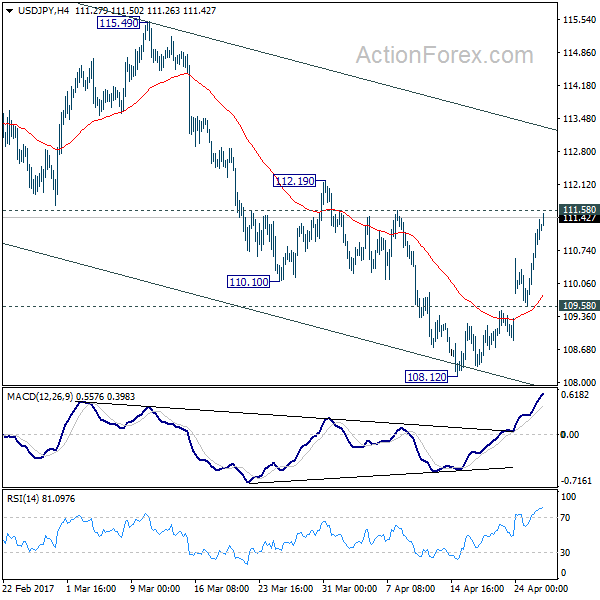
USD/JPY's rise is still in progress and reaches as high as 111.50 so far. Intraday bias remains on the upside for 111.58 support turned resistance. Decisive break there will indicate that t fall from 118.65 is merely a corrective move and has completed. Outlook will then be turned bullish for 115.49 resistance and above. Meanwhile, below 109.58 minor support will turn bias to the downside and extend the whole decline from 118.65 to 61.8% retracement of 98.97 to 118.65 at 106.48.
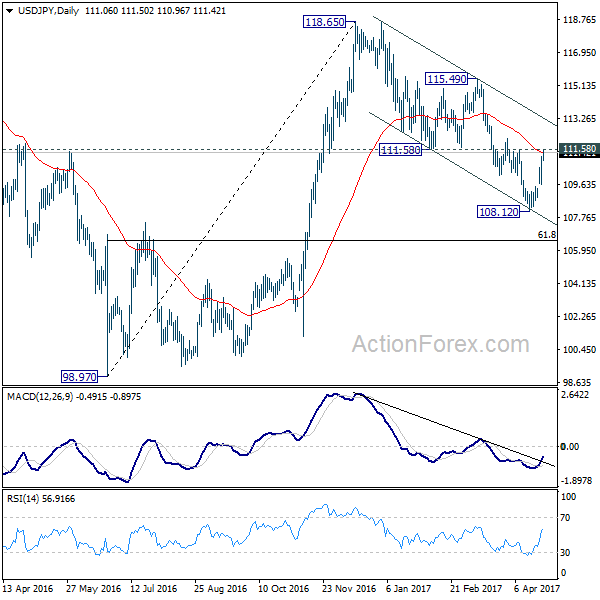
In the bigger picture, price actions from 125.85 high are seen as a corrective pattern. Current development suggests that it's not completed yet and is extending. In case of deeper decline, downside should be contained by 61.8% retracement of 75.56 to 125.85 at 94.77 to bring rebound. Rise from 75.56 is still expected to resume later after the correction from 125.85 completes.
Currencies: EUR/JPY Major Beneficiary As Risk-On Trade Continues
Sunrise Market Commentary
- Rates: European focus turns back to ECB
Investor's focus returns to the ECB's normalization process as the first round of the French presidential outcome nullified the Frexit risk. The German yield curve bear steepened as markets bet on another calibration of the ECB's QE programme. We don't expect any important communication at Thursday's meeting, but see scope for action in Summer. - Currencies: EUR/JPY major beneficiary as risk-on trade continues
Yesterday, EUR/USD and USD/JPY both profited as investors adapted positions further as EMU political event risk is out of the way. Today, the focus will be on the Trump's US tax plan. Will the plan be concrete enough to meet investor expectations on higher growth. A credible and realistic plan might again shift fortunes in favour of the dollar
The Sunrise Headlines
- US equities rallied 0.6% to 1.1% higher yesterday with Nasdaq closing above the 6000 mark for the first time ever. Overnight, Asian stock markets record similar gains with Japan outperforming on yen weakness.
- Three sources on and close to the ECB's Governing Council told Reuters that with the threat of a run‐off between two eurosceptic candidates in France averted, and with the economy on its best run in years, many rate setters see scope for sending a small signal in June towards reducing monetary stimulus.
- Australian CPI tiptoed atop 2% last quarter for the first time since 2014. Yet, key measures of core inflation stayed stubbornly short of the RBA's 2 to 3% target band. CPI outcomes slightly missed expectations.
- A federal judge ruled that President Trump's executive order threatening to pull funding from so‐called sanctuary cities is likely unconstitutional, delivering a fresh legal blow to the administration's immigration crackdown
- French presidential favourite Macron came under fire from both potential allies and his run‐off rival Le Pen for acting as if victory next month was already in the bag. Macron holds a 20 percentage points lead in opinion polls.
- BHP Billiton has cut production guidance for copper, iron ore and coking coal for the 2017 financial year due to industrial action at a copper mine Chile and bad weather in Australia, which affected its iron ore and coal mines.
- Today's eco calendar is empty. Finland and the US tap the market
Currencies: EUR/JPY Major Beneficiary As Risk-On Trade Continues
EUR/JPY major beneficiary of risk-on rally
On Tuesday, investors adapted positions further as the outcome of the first round of the French parliamentary elections substantially reduced political event risk. Later in the US, the rally got further traction as the good US corporate earnings accelerated the equity rally. The risk‐rally supported USD/JPY, EUR/JPY and at the same time also EUR/USD. USD/JPY succeeded a protracted intraday rise and closed the session at 111.09 (from 109.77 on Monday). EUR/USD also regained the 1.09 barrier and finished the day at 1.0926 (from 1.0868). Understandably, the gains in EUR/JPY were quite impressive (121.37 from 119.39)
Overnight, Asian equities join the risk rally. Japan still outperforms due to yen weakness. USD/JPY (111.35/40) is trading marginally higher. The global picture for the dollar remains mixed as the rebound of EUR/USD continues with the pair trading just below 1.0950. The trade‐weighted dollar struggles to keep above the 99/110 support area (currently 98.75). So, for now the prospect of a US spending bill and the announced Trump tax proposals aren't providing outright support for the dollar. The Q1 Australian CPI came out close to expectations at 0.5% Q/Q and 2.1% Y/Y. The weighed mean rose from 1.4% to 1.7%, but stays well below 2%. The Aussie dollar lost marginally ground upon the release and trades around AUD/USD 0.7520.
There are no important eco releases today, but the Trump administration will release the broad contours of its tax plan. Markets will try to get some insight whether the plan is a good starting point for negotiations with Congress. As the risks of a shutdown of the US government later have diminished, the assessment of the tax plan might be more positive. It also looks like the US government accepts a bigger deficit short‐term. Of course, markets will also keep an eye at the ECB policy meeting tomorrow. Earlier this week, trading in the major euro and dollar cross rates were driven by the global risk trade as (European) political event risk eased, rather than by US issues. This context supported USD/JPY but also EUR/USD and EUR/JPY. Market speculation that the decline in EMU political event risk could bring forward the ECB normalisation process supports the euro positive, too. ECB's Draghi will probably downplay this speculation. Question is whether the (FX) market will believe it. At the same time, if the Trump tax plans have a good chance to raise US growth, it might tilt the balance again in the advantage of the dollar. This might a fortiori be the case when a higher budget deficit would suggest more decisive action from the Fed. This scenario still needs to be confirmed. For now, the risk on trade is in the first place supporting EUR/JPY. Most of the gains go the USD/JPY, but EUR/USD is also a good secondary beneficiary. For now we don't row against this trend.
From a technical point of view, USD/JPY broke temporary below the 110 key support, making us downgraded our USD/JPY assessment to bearish. Next key support (62% retracement) comes in at 107.18. This week's rebound suggests that a bottoming out process might be in store. However, the pair needs to regain the 112.20 level (neckline ST double bottom) to really improve the technical picture. The odds for such a scenario are growing. EUR/USD extensively tested the topside of the MT range (1.0874/1.0906 area) late March, but the test was rejected and EUR/USD returned to the 1.06 area. The pair returned to the range top after the French election and the pair is currently setting minor new highs. We look out how this test turns out, but we are not convinced of a sustained break higher. If EUR/USD would regain the 1.10 barrier, next resistance comes in in the 1.1145/1.13 area (US pre/post‐election swings).
EUR/USD extends gains. Range top under heavy strain
EUR/GBP
Euro strength continues to drive EUR/GBP
The March UK budget deficit was slightly wider than expected at £5.1 bln yesterday. Disappointing VAT revenues might be another indication that UK consumers are pressured by rising prices. As usual, the impact of the report on sterling trading was limited. EUR/GBP initially held a tight range around the 0.85 big figure, but regained the big figure as the euro extended gains overall. The pair closed the session at 0.8509. Cable traded with a slight upward bias intraday and returned north of 1.28. The pair closed the session at 1.2842.
Today, there are no again no important eco data or BoE speeches. EU's Juncker and Barnier meet UK PM May in London. However, for now, Brexit is not really an issue for currency traders. Yesterday's gains in EUR/GBP were again mainly euro driven. The global performance of the euro (EUR/USD) will probably again be decisive for EUR/GBP trading today.
We had a neutral short‐term bias on EUR/GBP. Early last week, EUR/GBP dropped below EUR/GBP 0.84 support, (temporary) improving the sterling picture. The pair came within reach of the key 0.8305 support (Dec low), but no real test occurred. After this week's rebound, the range bottom looks better protected. Longer term, Brexit‐complications remain a potential negative for sterling. Of late, this was not the focus of sterling trading. Nevertheless on technical considerations we are inclined to reconsider a cautious EUR/GBP buyon‐ dips approach.
EUR/GBP jumps on French election. 0.83 range bottom looks safe for now. Rebound continues on euro strength
Bank Of Japan (BoJ) Monetary Policy Meeting
Market movers today
We have a relatively light calendar today, with only a few data releases in store. The aftermath of the French elections is likely to fade as focus shifts towards the ECB monetary policy meeting tomorrow.
In Sweden, April business and consumer confidence are due out . In general, especially business confidence has been very upbeat recently, not least after the Trump victory, and we might see some moderation of that going forward. Nevertheless, the macro situation in Sweden remains solid for the most part .
Bank of Japan monetary policy meeting. We expect the Bank of Japan (BoJ) to keep its monetary policy unchanged at its policy meeting ending early Thursday morning. This means that the BoJ will maintain its QQE and YCC with a target for the 10-year Japanese government bond yield of around 0%. This should not be a source of significant price action as this view is widely expected in the market . We still see USD/JPY in the 108-112 range in the near term.
Rate decision in Turkey. Turkey's central bank (TCMB) is due to announce its monetary policy decision. We expect the TCMB to keep its benchmark reporate at 8.00%, avoiding extra pressure on the banking and corporate sector as TRY has stabilised. Yet , as inflation remains in the double-digit territory, we expect the late liquidity lending rate to be hiked by 25bp to 12.00%.Consensus median has the rate staying unchanged.
Selected market news
The rally in risk assets was extended in the US session last night and Dow Jones and S&P 500 indices closed 1.2% and 0.6% higher, respectively, after European equity markets locked in minor gains yesterday. Markets in Asia also trade higher this morning after higher-than-expected earnings results and the hopes of a US tax reform has boosted opt imism.
The Trump administration is expected to present its tax plans today. According to the media, President Trump will call for cutting taxes for individuals and lowering the corporate rate to 15%, while the border-adjusted tax proposal will be scrapped. However, according to White House Budget director Mick Mulvaney we should only expect the administ rations ideas/principles to be announced today, while the full tax plan will not be released until June. We still expect Trumponomics to come later and be smaller than pledged due to disagreement within the Republican party.
In the fixed income markets, the yield on 10-year US treasuries added less than one basis point to 2.34% yesterday, while the sell-off in the European government bond space, not just the core but also the periphery bond markets, cont inued. The result was a further bear curve steepening with especially the 10-30Y segment under pressure with the 10Y German government bond yield trading nearly 5bp higher. European markets are likely to remain under pressure ahead of the ECB meeting tomorrow, as some investors might fear that the ECB could send small signals towards reducing monetary stimulus.
Daily Technical Analysis: EURUSD, GBPUSD, USDJPY, USDCHF
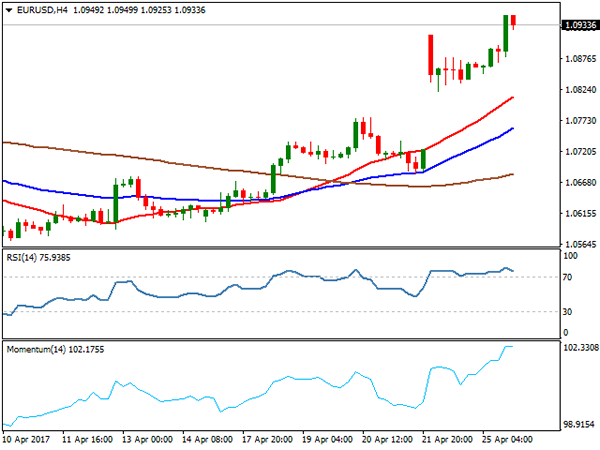
EURUSD
The EURUSD had a bullish momentum yesterday topped at 1.0949. The bias is bullish in nearest term testing 1.1000 – 1.1050 area. Immediate support is seen around 1.0900. A clear break back below that area could lead price to neutral zone in nearest term testing 1.0850. Price is in a tricky phase now. The gap as a result of fundamental event sometimes filled, which means we could see again the pre-gap level at 1.0730 this week. Any sustained movement below 1.0850 should support this scenario. On the other hand, a clear break and daily close above 1.1000 – 1.1050 could be an early signal of a new bullish trend which could mean that we may not see the pre-gap level again in the next few weeks or months.
GBPUSD
The GBPUSD had a moderate bullish momentum yesterday topped at 1.2845. The bias is bullish in nearest term testing 1.2900 area. A clear break and daily close above that area would expose 1.3000 – 1.3050 area and give us further confirmation of the double bottom bullish scenario. Immediate support is seen around 1.2800. A clear break below that area could lead price to neutral zone in nearest term but only a clear break back below 1.2750 could interrupt the double bottom bullish scenario.
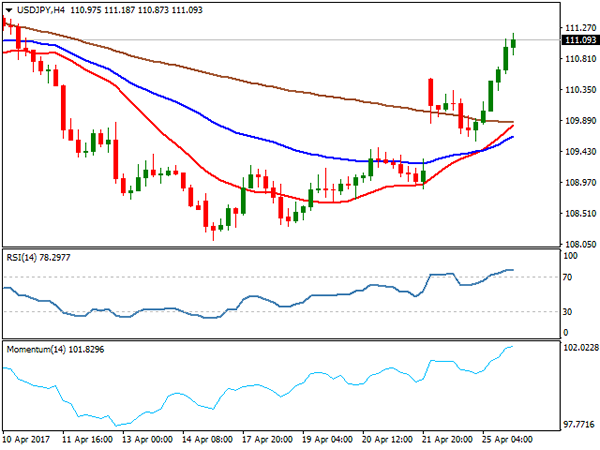
USDJPY
The USDJPY had a strong bullish momentum yesterday, topped at 111.18 and hit 111.38 earlier today in Asian session. The bias is bullish in nearest term. Price broke above the trend line resistance as you can see on my H1 chart below suggests a potential short-term bullish view retesting 112.20 area. Immediate support is seen around 110.85 (daily EMA 200). A clear break back below that area could lead price to neutral zone in nearest term as direction would become unclear.
USDCHF
The USDCHF was indecisive yesterday. The bias is neutral in nearest term probably with a little bearish bias testing 0.9880. A clear break and daily close below that area would expose 0.9813 area. Immediate resistance is seen around 0.9970 but key resistance is seen at 1.0020 area which remains a good place to sell with a tight stop loss. Overall I remain neutral.
Foreign Exchange Market Commentary: EUR/USD, USD/JPY, GBP/USD,AUDUSD, GBPCAD, GOLD, WTI CRUDE, DJIA, FTSE100, DAX
EUR/USD
The Euro soared to fresh 5 ½ month high at 1.0949 on Tuesday, on renewed strength after Monday's pullback from previous high at 1.0916 was contained by weekly Kijun-sen line at 1.0819. The single currency was driven by strong bullish sentiment on victory of centrist candidate Emmanuel Macron on the first round of French presidential election. In addition, the Euro got boosted from overall weaker dollar on mixed US data (Consumer Confidence dropped to 120.3 in April, well below forecast at 122.5) while US New Home Sales hit an eight month high at 621K compared to forecast at 583K, which added to the story of strengthening US economy.
Investors are awaiting more details about President Trump's tax reform which is expected to include a massive tax cut for individuals and businesses and is expected to be unveiled on Wednesday.
The EURUSD pair is on track for strong bullish close on Tuesday and eyeing psychological 110.00 barrier initially, as break higher would extend through Fibonacci 138.2%projection at 1.1034 towards magnetic weekly Ichimoku cloud base at 1.1067 (the cloud is thinning and is going to twist next week that would further attract the pair to test it).
Broken 200SMA offers solid support at 1.0837, with repeated close above it to confirm break higher and further bullish extension.
Support: 1.0900, 1.0870, 1.0837, 1.0820
Resistance: 1.0949, 1.1000, 1.1034, 1.1067
USD/JPY
The US dollar regained strength against Japanese yen on Tuesday and rallied strongly from double-bottom at 109.60 zone, where downside attempts were contained by north-turned daily Tenkan-sen. The pair surged through Fibonacci 61.8% and 76.4% barriers at 110.25 and 110.76 and also probed above round-figure 111.00 barrier.
Fresh strength of the dollar came after traders started exit long in safe haven yen and focused riskier assets that strongly lifted the price for the biggest one-day gains since Feb 9.
Fresh rally is approaching key barriers at 111.36/57 ( top of thick weekly Ichimoku cloud / previous double upside rejection), break of which would signal stronger correction of 115.50/108.11 downleg on extension to 112.00+ levels.
Broken daily Kijun-sen offers support at 110.48, which should ideally contain corrective dips.
Support: 111.00, 110.48, 110.00, 109.60
Resistance: 111.18, 111.36, 111.57, 112.00
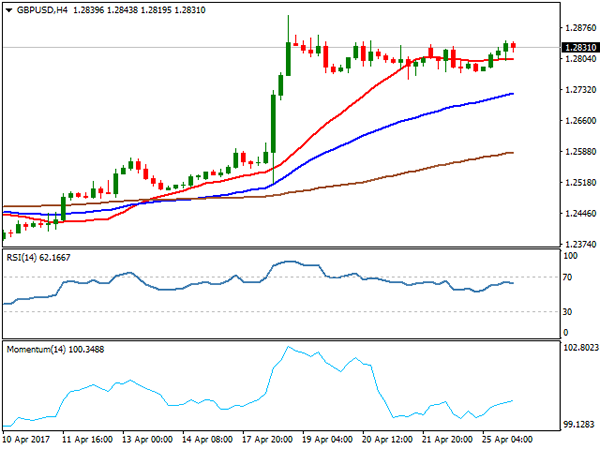
GBP/USD
GBPUSD stayed within 1.2770/1.2859 range on Tuesday, showing no significant changes in its near-term directionless mode. Strong support has established at 1.2770, where multiple downside rejections occurred in recent days, with support being reinforced by Fibonacci 38.2% of 1.2514/1.2905 upleg at 1.2755.
Tuesday's action was slightly positive and on track for bullish end of the day, however, clearer direction signal could be expected on break of either range boundary.
Technical studies are bullish on near-term and daily timeframes, however, reversal of slow stochastic from overbought zone on daily chart continues to weigh and maintain risk of deeper pullback which may extend towards 1.2700 (ascending daily Tenkan-sen).
Conversely, firm break above near-term congestion would shift focus higher for retest of multi-month high at 1.2905 and look for psychological 1.3000 barrier in extension.
Support: 1.2770, 1.2755, 1.2700, 1.2663
Resistance: 1.2845, 1.2859, 1.2905, 1.3000
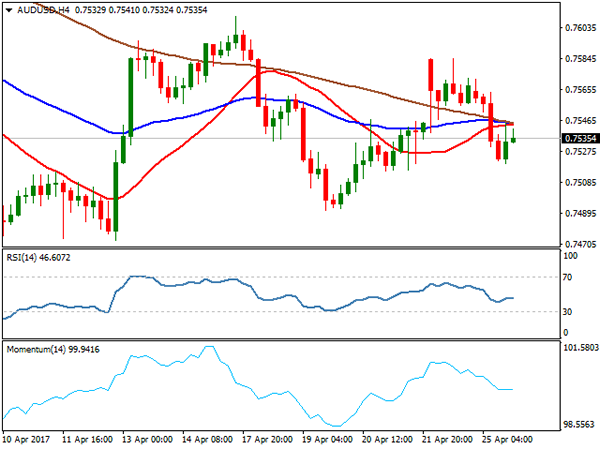
AUDUSD
The AUDUSD pair lost traction and fell through several strong points (200SMA / 100SMA) to test key support at 0.7518 (base of ascending and thick daily Ichimoku cloud. Hanging Man candlestick that was formed on Monday, generated strong bearish signal for today's fall which cracked Fibonacci 61.8% retracement of 0.7492/0.7584 upleg.
Break and close below daily cloud is needed to confirm an end of 0.7492/0.7584 corrective phase and expose key supports, bases at 0.7492 and 0.7470.
Broken 200SMA now offers solid resistance which is expected to keep the upside attempts limited.
Support: 0.7518, 0.7492, 0.7470, 0.7435
Resistance: 0.7550, 0.7560, 0.7584, 0.7610
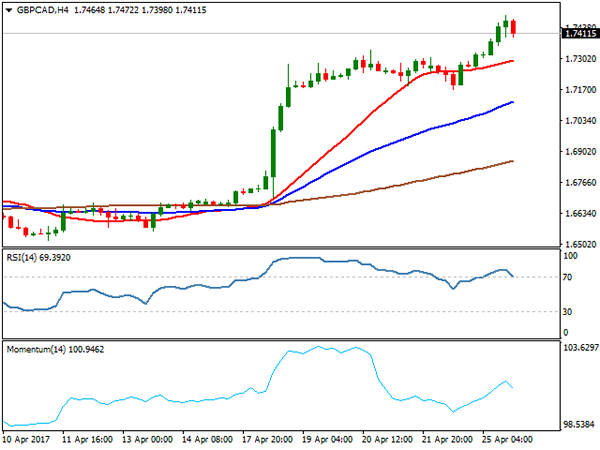
GBPCAD
The GBPCAD pair continues to trend higher and rallied strongly on Tuesday to fresh high near 1.7500 barrier, posting the highest levels since mid-Sep. Loonie remains under pressure which has intensified on Tuesday amid concerns over an escalating dispute with the U.S. over the terms of the North American Free Trade Agreement.
Fresh strength that neared round-figure 1.7500 level, is looking for extension towards next targets at 1.7524/42 (highs of Sep 11 / July 31 2016), as strong acceleration from 1.6535/15 higher base may extend towards next strong barrier at 1.7835 (Fibonacci 61.8% retracement of larger 1.9127/1.5745 descend). Monday's low that was left after strong downside rejection at 1.7167, marks initial support, with broken weekly Ichimoku cloud base at 1.7078, expected to contain extended dips.
Support: 1.7400, 1.7340, 1.7200, 1.7167
Resistance: 1.7491, 1.7524, 1.7542, 1.7600
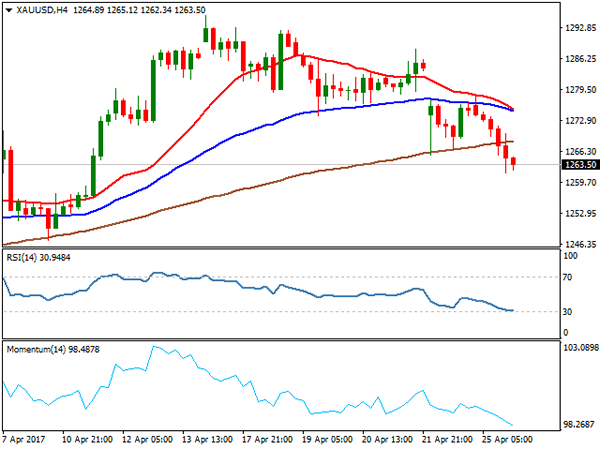
GOLD
Spot Gold fell further on Tuesday and ended day firmly in red, on fresh bearish acceleration that hit low at $1261 (rising daily Kijun-sen / Fibonacci 61.8% retracement of $1239/$1295 rally. Fresh weakness was triggered after repeated upside rejection of attempts to fill Monday's gap, as rallies were capped by broken daily Tenkan-sen line and on heavy migration from safe haven gold into riskier assets on renewed risk-appetite in the markets.
Tuesday's fall (the biggest one-day loss since Mar 2) has weakened Gold's structure. Near-term technicals turned into firm bearish mode, while daily studies are losing traction and see risk of extension towards key supports at $1254 (200SMA) and $1247 (Apr 10 trough). Break and close below $1261 pivot is needed to confirm scenario.
Double upside rejection at $1277 marks strong resistance.
Support: 1261, 1258, 1254, 1247
Resistance: 1266, 1271, 1277, 1284
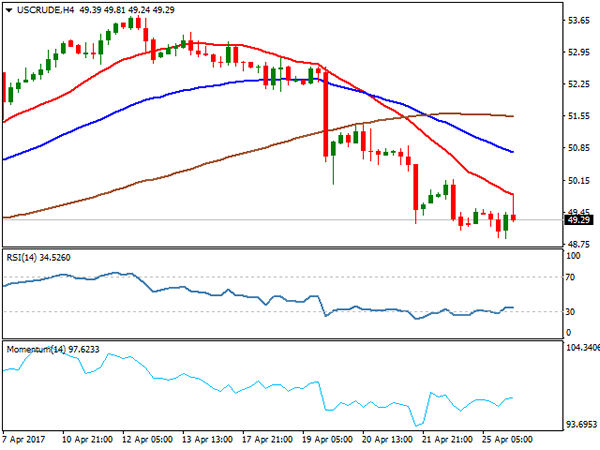
WTI CRUDE OIL
WTI crude oil showed initial signals of stabilization after steep fall from recovery top at $53.74 was contained by 200SMA at $49.01. Subsequent bounce that is eyeing psychological $50.00 barrier is on track for the first bullish daily close after six straight days in red.
Strong bearish sentiment that has been established of recent bearish acceleration, driven by fears in the markets about extension of OPEC's production cut and rising production of US shale oil, keeps risk at the downside, as firm break below 200SMA pivot would trigger fresh acceleration lower and expose key supports at $47.07.
Meantime, current bounce is seen as corrective action which should be ideally capped by daily Kijun-sen at $50.41 and base of widening daily Ichimoku cloud at $50.74.
Otherwise, stronger correction of $53.74/$49.01 downleg could be anticipated and may extend gains towards next pivot at $51.05 (daily Ichimoku cloud top).
Support: 49.01, 48.7, 48.64, 48.37
Resistance: 50.00, 50.17, 50.74, 51.05
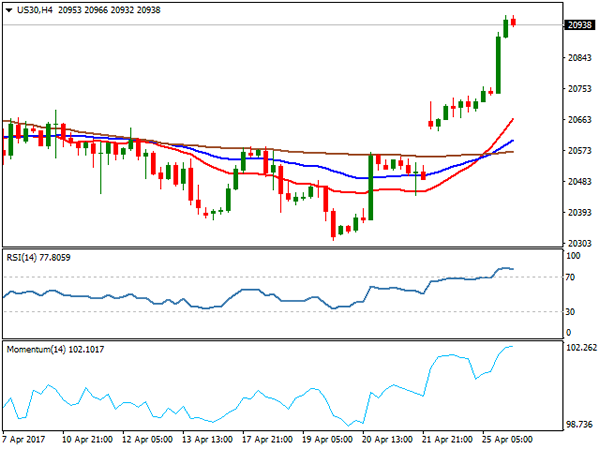
DJIA
Dow Jones surged on Monday and registered the biggest one-day rally since Mar 1 on acceleration through daily Ichimoku cloud top pivot at 20774 and peaked at 20966 (Fibonacci 76.4% of pullback from fresh record high at 21160 to 20310 (Apr 19 correction low).
Extension of strong recovery rally from 20310, which included Monday's gap-higher opening, maintains strong bullish sentiment for return to 21160 peak. The notion is supported by close above daily cloud and fresh bullish momentum on daily studies that underpins the action.
Broken daily cloud top is now acting as strong support which is seen containing corrective dips on overbought daily conditions.
Support: 20669, 20630, 20552, 20442
Resistance: 20966, 21028, 21160, 21361
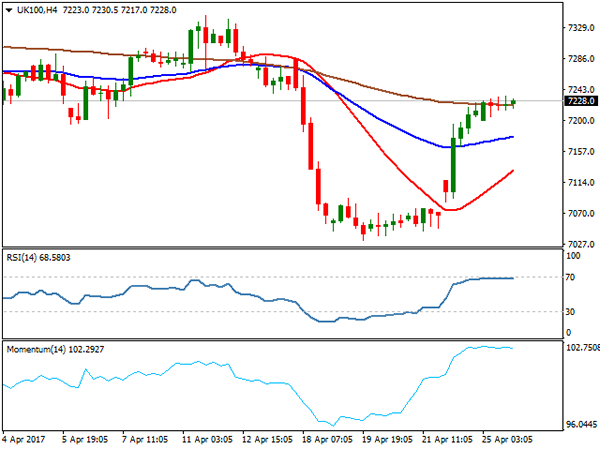
FTSE100
FTSE index extended recovery on Tuesday and 7264, to retrace over 76.4% of last week's 7285/7032 fall. Extension of Monday's strong rally signals strong bullish sentiment on brighter outlook in European politics (French election) that drives the price higher and signals final push towards key barrier at 7285, Apr 18 pre-fall high, also top of daily Ichimoku cloud.
Cloud's base at 7234 has capped today's bullish extension and the price may show hesitation here, however, bullish outlook keeps near-term focus firmly at the upside.
Broken Tenkan-sen at 7189 is expected to contain dips and keep the structure intact.
Support: 7200, 7189, 7158, 7129
Resistance: 7234, 7257, 7285, 7341
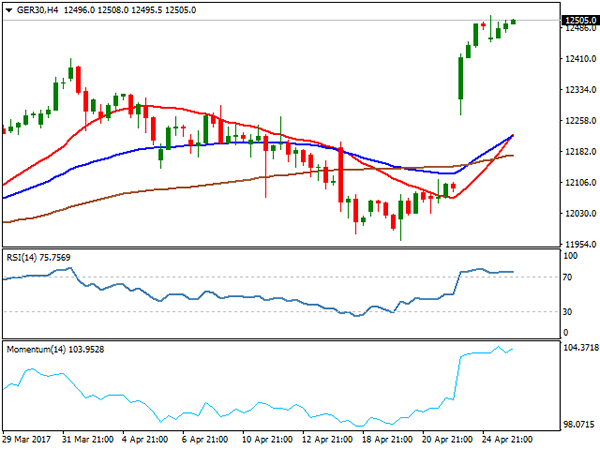
DAX
DAX maintains strong bullish tone and extended gains on Tuesday to fresh record high at 12518. Dax appreciated relief in the markets on fading fears of possible Frexit scenario on victory of anti-EU candidate on French election.
Technical studies maintain firm bullish structure on larger timeframes and series of higher highs suggest further upside, driven by fresh bullish sentiment. Fresh bullish extension is looking for projected level at 12581 and 12687 (Fibonacci 138.2% and 161.8% projection of the upleg from 11962 respectively), with shallow corrective dips expected to hold above 12300 handle (Fibonacci 38.2% of 11962/12518 rally).
Support: 12452, 12400, 12300, 12240
Resistance: 12518, 12581, 12687, 12858
EUR/CHF Daily Outlook
Daily Pivots: (S1) 1.0822; (P) 1.0846; (R1) 1.0878; More...
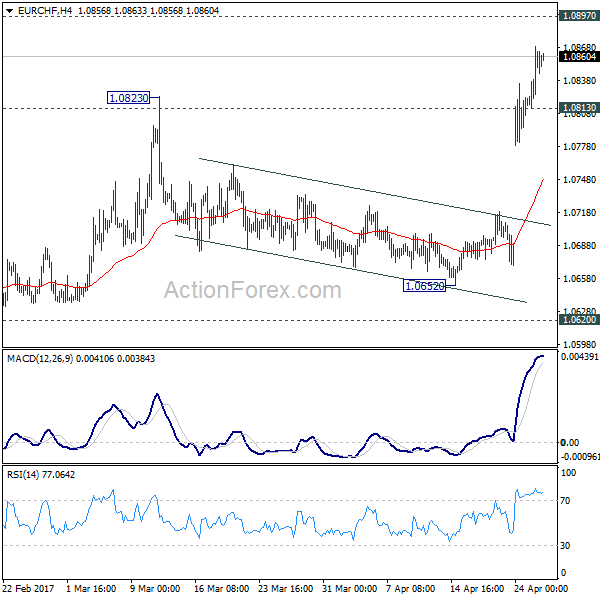
Intraday bias in EUR/CHF remains on the upside for the moment. The break of 1.0823 resistance indicates resumption of rise from 1.0629 and carries larger bullish implication. Further rise should now be seen to 1.0897 resistance next. On the downside, below 1.0813 minor support will turn intraday bias neutral and bring retreat first, before staging another rally.
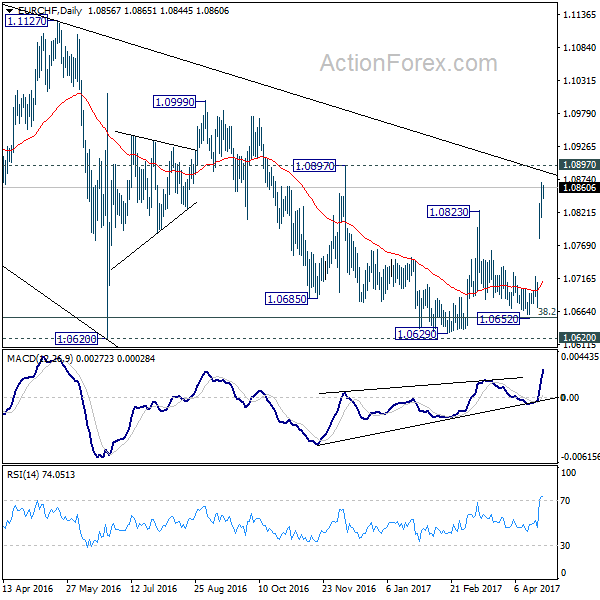
In the bigger picture, the price actions from 1.1198 are seen as a corrective move. Current strong rebound is raising the chance that it's completed after defending 38.2% retracement of 0.9771 to 1.1198 at 1.0653. Decisive break of 1.0823 resistance will affirm this bullish case. Further break of 1.0999 will target a test on 1.1198 high. For now, this will be the preferred case as long as 1.0652 support holds.
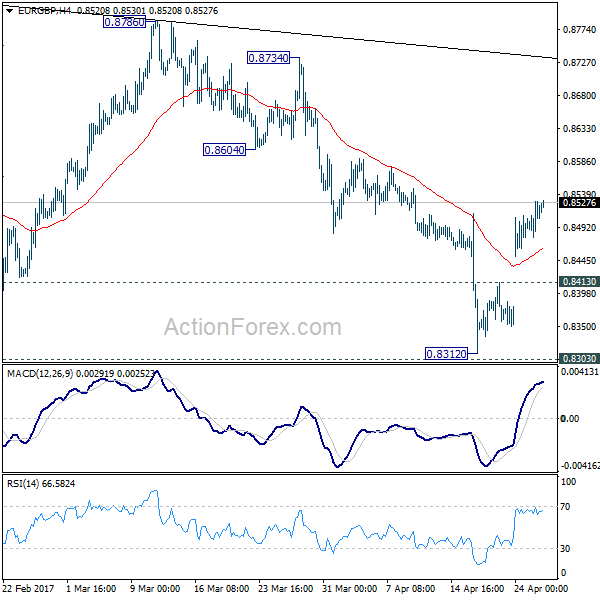
EUR/GBP Daily Outlook
Daily Pivots: (S1) 0.8482; (P) 0.8506; (R1) 0.8535; More...
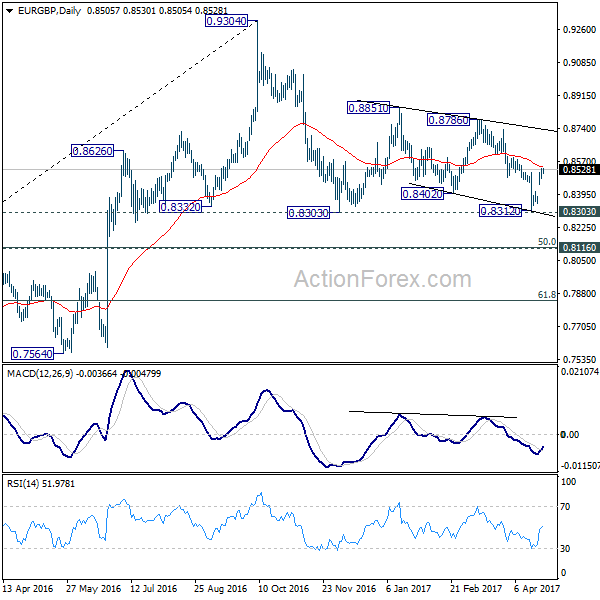
The break of 0.8511 minor resistance indicates near term reversal in EUR/GBP. And the corrective pattern from 0.8851 could be finished with three waves down to 0.8312, just ahead of 0.8303 support. Intraday bias is turned back to the upside for 0.8786 resistance next. Firm break there could bring further rally towards 0.9304 high. Nonetheless, price actions from 0.9304 are seen as a corrective pattern and there is no clear sign of up trend resumption yet. Hence, even in that case, we'll stay cautious on strong resistance below 0.9304. On the downside, below 0.8413 minor support with turn focus back to 0.8303 instead.
In the bigger picture, price actions from 0.9304 are viewed as a medium term corrective pattern. In any case, we'd expect strong support from 0.8116 cluster support (50% retracement of 0.6935 to 0.9304 at 0.8120) to contain downside. Rise from 0.6935 (2015 low) will resume at a later stage to 0.9799 (2008 high). However, sustained break of 0.8116 could bring deeper decline to next key support level at 0.7564 before the correction completes.