Sample Category Title
Market Update – European Session: Awaiting Trump Tax Plan
Notes/Observations
Focus on Trump administration's tax reform plan
Overnight:
Asia:
Australia Q1 CPI data was a slight miss but annual inflation has risen to RBA's 2-3% target range in 2 years (YoY: 2.1% v 2.2%e). **Insight: RBA focuses more closely on core inflation
Japan Fin Min Aso reiterated view that regional economies were experiencing moderate recovery; still heightened sense of caution due to geopolitical risks. Extremely important to ensure continuous wage increases to spur consumption and investment
South Korea Defense Ministry: Confirmed that some elements of THAAD missile defense system had been moved to the planned site
Europe:
UK may face EU budget payments until 2020 following Brexit negotiations to secure favorable Brexit transition deal
Greece PM Tsipras: govt will legislate additional austerity sought by creditors in 2019 and 2020 but will only implement them if there is a debt relief deal
France IFOP daily presidential poll: Second round poll: Macron 61.0%; Le Pen 39%
Americas:
President Trump's tax plan said to reduce rate for pass-through businesses (category said to include mom-and-pop grocers and also hedge funds) to 15% from 39.6%; proposes 10% tax on some $2.6T in earnings that US companies have booked offshore. Tax plan to include 15% tax rate for corporations but no border-adjustment proposal.
Commerce Sec Ross: Trade national security probes could extend to semiconductors and aluminum. Considering ramping up free-trade talks with EU, Japan and UK. UK bilateral trade pact unlikely to come soon
Energy:
Weekly API Oil Inventories: Crude: +0.9M v -0.8M prior; first buld in 4 weeks
Economic Data
(NL) Netherlands Apr Producer Confidence: 8.3 v 7.8 prior
(FR) France Apr Consumer Confidence: 100 v 100e
(SE) Sweden Apr Consumer Confidence: 103.4 v 103.5e; Manufacturing Confidence: 123.2 v 113.4e, Economic Tendency Survey: 112.8 v 109.5e
(PL) Poland Mar Unemployment Rate: 8.1% v 8.2%e
(CH) Swiss Apr Credit Suisse Expectation Survey: 22.2 v 29.6 prior
Fixed Income Issuance:
(ES) Spain Debt Agency (Tesoro) opened its book to sell Nov 2027 Inflation-linked bonds; guidance seen -94 to -92 bps vs. linker SPGB
(IN) India sold total INR140B vs. INR140B indicated in 3-month and 12-month Bills
(SE) Sweden sold SEK10B in 3-month bills; Avg Yield: -0.6795% v -0.6714% prior; bid-to-cover: 2.75x v 2.36x prior
(NO) Norway sold NOK3.0B vs. NOK3.0B indicated in 2027 Bonds; Avg Yield: 1.65% v 1.70% prior; Bid-to-cover: 2.22x v 2.30x prior
(IT) Italy Debt Agency (Tesoro) sold €6.0B vs. €6.0B indicated 6-month Bills; Avg Yield: -0.326% v -0.294% prior; Bid-to-cover: 1.86x v 1.59x prio
SPEAKERS/FIXED INCOME/FX/COMMODITIES/ERRATUM
Index snapshot (as of 10:00 GMT)
Indices [Stoxx50 -0.2% at 3,577, FTSE flat at 7,277, DAX flat at 12,465, CAC-40 +0.1% at 5,280, IBEX-35 -0.2% at 10,758, FTSE MIB -0.6% at 20,687, SMI +0.2% at 8,793, S&P 500 Futures -0.1%]
Market Focal Points/Key Themes: European equity indices are trading mixed after a raft of corporate earnings premarket, and as market participants await US President Trump's tax reform plans; Asian equity indices ending positive across China and Japan; Banking stocks generally lower across the board adding to losses seen in the heavily peripheral lender weighted FTSE MIB and IBEX indices; shares of Deutsche Bank however trading notably higher; shares of GKN the notable laggard in the FTSE 100 after releasing a trading update; shares of LSE trading higher in the index after releasing Q1 results; Commodity and mining stocks trading mixed as copper prices open higher but trade lower intraday.
A plethora of upcoming scheduled US earnings (pre-market) include Alaska Air, Anthem, Amphenol Corp, Avery Dennison, Axalta Coating Systems, Boeing, Baxter International, BCE, Brink's Company, Bloomin' Brands, Cullen/Frost Bankers, Cenovus Energy, Dr Pepper Snapple, DTE Energy, Entergy, FLIR Systems, General Dynamics, WR Grace, Hess, Hershey Foods, Huntsman, Ingersoll-Rand, Coca-Cola FEMSA, Lear, Magellan Health Services, M/I Homes, NASDAQ OMX, Northrop Grumman, Norfolk Southern, New York Community Bancorp, Owens Corning, Oshkosh, Penske Auto, Pepsico, Procter & Gamble, Restaurant Brands, Rockwell Automation, Rollins, Sonic Automotive, Santander Consumer USA, Silgan Holdings, State Street, Seagate Technology, TE Connectivity, Timken, Thermo Fisher Scientific, Tri Pointe Homes, Twitter, United Therapeutics, United Technologies, Vantiv, Waste Management, Westrock, and Wyndham Worldwide.
Equities (as of 09:50 GMT)
Consumer Discretionary: [Air Liquide AI.FR +0.8% (Q1 sales), Boohoo.com BOO.UK -3.2% (FY16/17 results), Dufry DUFN.CH +1.5% (HNA Group exceeds 15% holding), XXL XXL.NO -3.0% (Q1 results)]
Financials: [Banco Santander SAN.ES -0.5% (Q1 results), Credit Suisse CSGN.CH +2.5% (Q1 results, job cuts), London Stock Exchange LSE.UK +1.1% (Q1 results), Standard Chartered STAN.UK +4.5% (Q1 results)]
Industrials: [Antofagasta ANTO.UK -0.1% (Q1 production), Assa Abloy ASSAB.SE +0.8% (Q1 results), Daimler DAI.DE -0.5% (Q1 results, raises outlook), GKN GKN.UK -1.4% (trading update), Kloeckner & Co KCO.DE +0.8% (Q1 results), PSA UG.FR -1.9% (Q1 sales), Saab SAABB.SE +5.5% (Q1 results), Wartsila WRT1V.FI -3.1% (Q1 results), Yara YAR.NO -5.5% (Q1 results)]
Materials: [Fresnillo FRES.UK -0.9% (Q1 production)]
Technology: [Cap Gemini CAP.FR +1.3% (Q1 sales), Dassault Systems DSY.FR -5.5% (Q1 results)]
Telecom: [Royal KPN KPN.NL +1.3% (Q1 results)]
Utilities: [Iberdrola IBE.ES -0.7% (Q1 results)]
Speakers
Brexit Sec Davis: Compromise will be needed by both sides in upcoming negotiations. UK will not take "divide and rule" approach
Russia Foreign Min Lavrov: Use of force in North Korea would have catastrophic consequences
China Foreign Ministry continued to oppose deployment of THAAD in South Korea; Urging US and South Korea to withdraw system
Saudi Oil Min Al-Falih reiterated view that Saudi Arabia was interested in continuing talks to stabilize oil prices between OPEC and non-OPEC members
Currencies
The USD was firmer heading into the NY morning with focus turning to details on the Trump administration's tax reform plan. The greenback was firmer as reports indicated that Trump would provide an incentive to repatriate accumulated foreign profits for US companies
EUR/USD did hit fresh 5-1/2 month at 1.0950 during the Asian session aided by receding concerns about the risks posed by the French presidential election. The pair moved off its best levels ahead of the US open.
USD/JPY continued its winning streak after hitting a 5-month low of 108.13 back on April 17th. The Nikkei225 Index registered its 4th straight 1% gain a feat last done back in Mid-2013. The Trump trade aiding the pair.
Fixed Income
Bund futures trade at 161.01 up 3 tick recovering from earlier losses as Equities reverse earlier gains to trade slightly lower for the day in what has been a busy day for corporate earnings. Continued downside targets yesterday low at 160.65 followed by 160.15. Resistance moves to 161.12 followed by 161.63 with eventual target of 162.52 gap fill.
Gilt futures trade at 128.14 down 7 ticks consolidating above the 128 level. Continuation with the downward trend eyes 127.94 followed by 127.74. Resistance stands at 128.58 then 128.81 followed by 129.14. Short Sterling futures trade flat with Jun17Jun18 remaining at 12.5/13bp.
Wednesday's liquidity report showed Tuesday's excess liquidity rose to €1.604T a rise of €28B from €1.576T prior. Use of the marginal lending facility fell to €120M from €207M prior.
Corporate issuance saw $3.33B come to market via 2 issuers in another quiet day. Issuance comprised of Kaiser 2 part 2.08B offering and Nextera Energy $1.25B 10 year. Monthly issuance tops $62B, almost half of the issuance seen in March.
Looking Ahead
(UK) EU's Juncker to visit UK PM May in London
(IT) Italy PM Gentiloni in Parliament on Brexit - 05:30 (ZA) South Africa Mar PPI M/M: 0.6%e v 0.6% prior; Y/Y: 5.5%e v 5.6% prior
05:30 (UK) DMO to sell £800M in 1.8% 2046 I/L Gilts
06:00 (FI) Finland to sell €1.5B in 2022 and 2047 RFGB bonds
06:00 (CZ) Czech Republic to sell 2020, 2025 and 2030 bonds
06:00 (RU) Russia to sell combined RUB45B in OFZ bonds
06:45 (US) Daily Libor Fixing
07:00 (US) MBA Mortgage Applications w/e Apr 21st: No est v -1.8% prior
07:00 (TR) Turkey Central Bank (CBRT) Interest Rate Decision: Expected to leave Benchmark Repurchase Rate unchanged at 8.00% (all key rates unchanged)
07:00 (BR) Brazil Apr FGV Consumer Confidence: No est v 85.3 prior
07:00 (BR) Brazil Apr FGV Construction Costs M/M: 0.0%e v 0.4% prior
07:00 (UK) PM May weekly question Time in House of Commons
07:30 (CL) Chile Central Bank's Traders Survey
08:15 (UK) Baltic Dry Bulk Index
08:30 (CA) Canada Feb Retail Sales M/M: 0.0%e v 2.2% prior; Retail Sales Ex Auto M/M: -0.3%e v +1.7% prior
09:00 (MX) Mexico Feb Retail Sales M/M: +0.6%e v -1.1% prior; Y/Y: 3.0%e v 4.9% prior
09:30 (BR) Brazil Mar Total Outstanding Loans (BRL): No est v 3.07T prior; M/M: No est v -0.1% prior
10:00 (US) Revisions: Retail Sales
10:00 (TR) EU Parliament debates situation in Turkey
10:30 (US) Weekly DOE Crude Oil Inventories
11:30 (US) Treasury to sell 2-Year Floating Rate Notes
12:00 (FR) France Mar Net Change in Jobseekers; -13.8Ke v -3.5K prior, Total Jobseekers: 3.447Me v 3.46M prior
12:00 (CA) Canada to sell 10-Year Bonds
13:00 (US) Treasury to sell 5-Year Notes
DAX Quiet As Investors Search For Cues, ECB Policy Meeting Next
The DAX has edged lower in the Wednesday session, as the index is currently trading at 12,462. It’s another quiet day on the release front, with no German or Eurozone indicators on the schedule. The markets will have some data to digest on Thursday, as Germany releases Consumer Confidence and Preliminary CPI As well, the ECB will make an interest rate announcement.
The ECB will set interest rates on Thursday, with the markets expecting more of the same. The benchmark rate has been pegged at a flat 0.0% since March 2016, and no changes are expected. With the eurozone showing stronger inflation and growth numbers in the first quarter, there has been speculation that the ECB might taper its asset-purchase program, which runs until December, ahead of schedule. However, the ECB appears in no rush to make any monetary moves, particularly with the current French election and the German election in September.
Investors cheered the results of the first round of the French presidential election. The first round winners, centrist Emmanuel Macron and far-right Marie Le Pen, will face off on May 7, with the winner becoming president. French voters will have a crystal-clear choice between the candidates, who want to take France in very different directions. Macron served as a minister under President Francois Hollande. He favors deregulation and is a staunch supporter of the European Union. Le Pen, who heads the National Front, has campaigned on a ‘France first’ platform, vowing to curb immigration and take France out of the eurozone. Hollande and Francois Fillon, who ran in the first round, have thrown their support behind Macron and asked voters to reject ‘extremism’. Macron is a heavy favorite to win the second round and become president, with polls giving him a comfortable lead of above 60%. Since opinion polls were accurate ahead of the first round of voting, the markets appear to relying on the current polls as well, meaning that the markets have priced in a Macron victory. Unless this sentiment drastically changes during the week, the election will be a non-event for the market. At the same time, nothing is a sure thing in politics, as underscored by the Brexit vote and the election of Donald Trump, two events which stunned the markets and triggered strong market movement.
President Trump will have to reach out to the Democrats in order to avoid a shutdown of the federal government on Saturday. Congress must pass a spending bill which will fund the government until October, but the bill requires the backing of 60 senators. This means that the Republicans (who control 52 seats) will need the support of 8 Democrats. This has led to bipartisan negotiations, and it’s reasonable to expect that these talks could go down to the wire, as both sides try to stick to their positions and try not to blink first. The last shutdown was in 2013, lasting 17 days. Another shutdown would be embarrassing for Trump, as it would start on his 100th day in office and would cast doubts on his ability to push his budget and tax plan through Congress.
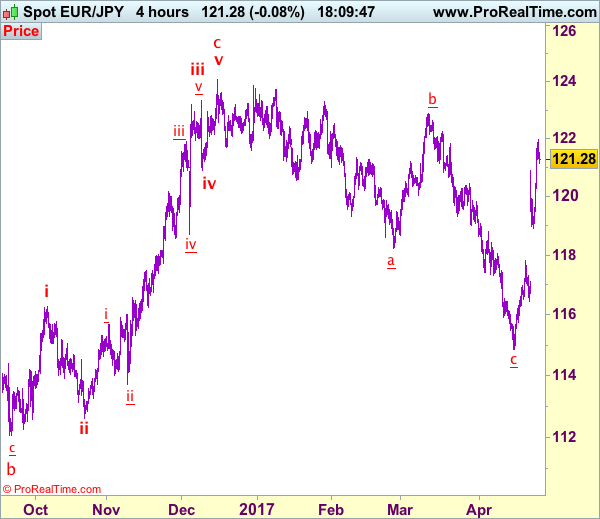
Trade Idea: EUR/JPY – Buy at 120.30
EUR/JPY - 121.11
Recent wave: wave v of (C) ended at 94.12 and major correction in wave A has ended at 149.79
Trend: Near term down
New strategy :
Buy at 120.20, Target: 122.20, Stop: 119.60
Position: -
Target: -
Stop:-
As the single currency surged again yesterday and broke above previous resistance at 120.88, suggesting the rise from 114.85 low (wave c trough) is still in progress and upside bias is seen for further gain to resistance at 122.26, above there would encourage for headway to 122.50-60 but loss of momentum should prevent sharp move beyond 123.00-10, risk from there is seen for a retreat to take place later.
In view of this, would not chase this rise here and would be prudent to buy euro on pullback as 120.20-30 should limit downside. Only below 119.45-50 would abort and suggest top is formed instead, risk weakness to support at 118.92, break there would add credence to this view and suggest at least the first leg of 114.85 has ended, bring weakness to 118.40-50 first.
Our latest preferred count is that wave (ii) is ABC-X-ABC which ended at 123.33 and wave (iii) is unfolding with wave iii ended at 100.77, followed by wave iv at 111.57 and wave v as well as the wave (iii) has ended at 97.04, followed by wave (iv) at 111.43 and wave (v) has ended at 94.12 which is also the end of the larger degree v, this also implied the major wave (C) has also ended there, hence major correction has commenced from there with (A) leg unfolding in its lower degree wave c which has possibly ended at 145.69. Under this count, A-B-C wave (B) has commenced with A leg ended at 136.23, wave B at 143.79 and wave C has possibly ended at 149.79.
Our larger degree count is that the decline from 139.26 is wave (C) and is sub-divided into a diagonal triangle i-ii-iii-iv-v with wave i - 105.44, wave ii- 123.33, wave iii - 97.03, wave iv - 111.43, followed by the final wave v as well as the end of wave (C) at 94.12, this also mark the bottom of larger degree wave B. Under this count, major rise in wave C has commenced as an impulsive wave with minor wave III ended at 145.69, wave V is still in progress for further gain to 150.00. Having said that, this so-called wave V could well be the first leg of larger degree 5-waver wave C and this wave C should bring at least a retest of wave A top at 169.97 (July 2008).
Daily Technical Analysis: GBP/JPY Strong Bullish Zig Zag Pattern
The GBP/JPY has been bought on dips after Macron won the first round of French elections. Our Session Recap setup went as expected and now we see a continuation. Equities went bullish and GBP/JPY followed, reaching 143.00 zone. At this point we see a huge MACD divergence which might drop the pair towards POC zone. POC 141.60-90 (D L3, ATR low, trend line, 50.0) could spike the price towards 142.50, 143.00 and 143.80. If we don’t see an entry within POC zone watch for 4h close above 143.30. That should also be a sign for continuation towards above mentioned targets.
GOLD Short-Term Bearish In A Bullish Mediumterm Trend, SILVER Continued Weakness, CRUDE OIL Consolidating Below 50.
GOLD Short-term bearish in a bullish mediumterm trend.
Gold keeps on weakening since the yellow metal has faded near the hourly resistance at 1295 (18/04/2017 high). Support can be located at 1261 (intraday low). The road is wideopen for further decline.
In the long-term, the technical structure suggests that there is a growing upside momentum. A break of 1392 (17/03/2014) is necessary ton confirm it, A major support can be found at 1045 (05/02/2010 low).
SILVER Continued weakness.
Silver has broken strong support at 18.16 (rising trendline) indicating further downside risk. Strong support is given far away at 16.82 (15/03/2017 low). Strong resistance is given at a distance at 19.00 (09/11/2017 high). Expected to see continued bearish pressures.
In the long-term, the death cross indicates that further downsides are very likely. Resistance is located at 25.11 (28/08/2013 high). Strong support can be found at 11.75 (20/04/2009).
CRUDE OIL Consolidating below 50.
Crude oil has declined sharply, breaking the support at 50.71, yet now has paused. Support now lies at 48.87 (25/04/2017 low). Resistance for a short-term bounce can be found at 50.71 (old support) and 53.70 (12/04/2017 high).
In the long-term, crude oil has recovered after its sharp decline last year. However, we consider that further weakness are very likely. Strong support lies at 24.82 (13/11/2002) while resistance can now be found at 55.24 (03/01/2017 high).
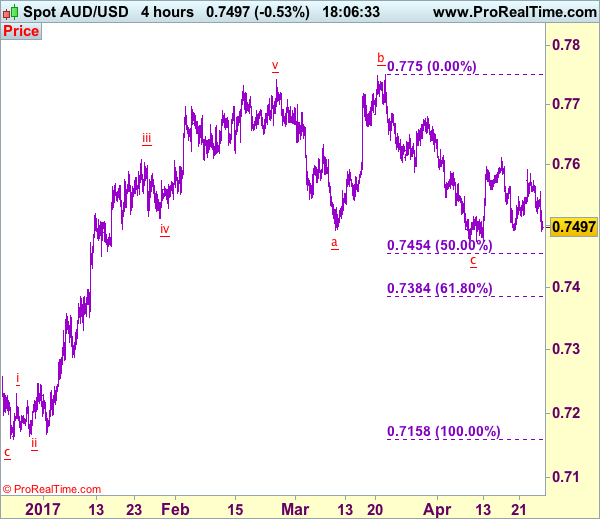
Trade Idea: AUD/USD – Stand aside
AUD/USD – 0.7497
Recent wave: Wave 5 ended at 1.1081 and major correction has commenced for fall to 0.7000 and then towards 0.6500-10
Trend: Near term down
New strategy :
Stand aside
Position: -
Target: -
Stop:-
Although aussie has slipped again after meeting resistance at 0.7556 earlier today and test of indicated support at 0.7473 cannot be ruled out, break there is needed to retain bearishness and signal recent decline from 0.7750 has resumed and extend weakness to 0.7450-55 (50% Fibonacci retracement of 0.7158-0.7750) but reckon downside would be limited to 0.7380-85 (61.8% Fibonacci retracement) and 0.7350 should hold, risk from there is seen for a rebound later.
On the upside, expect recovery to be limited to 0.7555-60 and price should falter well below resistance at 0.7592. Above 0.7592 would bring test of indicated previous resistance at 0.7611 would signal low has been formed at 0.7473, bring a stronger rebound to 0.7650 but resistance at 0.7680 should hold from here, price should stay well below 0.7700-10, bring another decline later. As near term outlook is still mixed, would be prudent to stand aside in the meantime.
On the 4-hour chart, the move from 0.8066 is the wave 5 with i: 0.8860, ii: 0.8315, wave iii is an extended move ended at 1.0183, iv: 0.9706 and wave v has ended at 1.1081 (also the top of entire wave 5). The subsequent selloff is the major correction which is unfolding as ABC-X-ABC and 2nd A leg has ended at 0.8848, followed by a-b-c wave B which ended at 0.9758, hence, 2nd C wave is now in progress and indicated downside target at 0.7000 and 0.6950 had been met, so further fall to 0.6710-20 cannot be ruled out.
EUR/USD – Euro Hugging 1.09 Ahead Of ECB Rate Meeting
The euro has reversed directions on Wednesday and has posted slight gains. Currently, the pair is trading at the 1.09 line. On the release front, the markets will have little data to analyze, with just one event on the schedule, Crude Oil Inventories. There’s plenty of activity on Thursday, as Germany releases Preliminary CPI and the ECB will make an interest rate announcement. In the US, the major indicators are Core Durable Goods Orders and unemployment claims.
The ECB meets for its monthly rate meeting on Thursday, but the markets are not expecting any dramatic news. The benchmark interest rate has been pegged at a flat 0.0% since March 2016, and no changes are expected. With the eurozone showing stronger inflation and growth numbers in the first quarter, there has been speculation that the ECB might taper its asset-purchase program, which runs until December, ahead of schedule. However, the ECB appears in no rush to make any monetary moves, particularly with the current French election and the German election in September.
The markets have been focused on the French presidential election, which began on Sunday. The first round winners, centrist Emmanuel Macron and far-right Marie Le Pen, will face off on May 7, with the winner becoming president. French voters will have a crystal-clear choice between the candidates, who want to take France in very different directions. Macron served as a minister under President Francois Hollande. He favors deregulation and is a staunch supporter of the European Union. Le Pen, who heads the National Front, has campaigned on a ‘France first’ platform, vowing to curb immigration and take France out of the eurozone. Hollande and Francois Fillon, who ran in the first round, have thrown their support behind Macron and asked voters to reject ‘extremism’. Macron is a heavy favorite to win the second round and become president, with polls giving him a comfortable lead of above 60%. Since opinion polls were accurate ahead of the first round of voting, the markets appear to relying on the current polls as well, meaning that a Macron victory has been priced in. Unless this sentiment drastically changes during the week, the election will be a non-event for the market. At the same time, nothing is a sure thing in politics, as underscored by the Brexit vote and the election of Donald Trump, two events which stunned the markets and triggered strong market movement.
US consumer confidence levels remain high, but there was some disappointment as CB Consumer Confidence dropped to 120.3 in April, missing the estimate of 123.7. The softer than expected reading boosted the euro in the Monday session. What is troubling analysts is that strong consumer confidence numbers have not translated into increased consumer spending, a key component of economic growth. This trend has been labeled the “hard/soft discrepancy” (confidence being ‘soft’, while actual spending being ‘hard’). This was underscored in March retail sales numbers, which came in at a flat 0.0%, shy of the forecast. Next up is Preliminary GDP on Thursday, which is expected at 1.3 percent. An unexpected GDP reading could have a sharp impact on EUR/USD.
Will the lights stay on in Washington this weekend? President Trump will have to punch in some overtime this week to avoid a shutdown of the federal government on Saturday. Congress must pass a spending bill which will fund the government until October, but the bill requires the backing of 60 senators. This means that the Republicans (who control 52 seats) will need the support of 8 Democrats. This has led to intensive bipartisan negotiations, and it’s reasonable to expect that these talks could go down to the wire, as both sides try to stick to their positions and try not to blink first. The last shutdown was in 2013, lasting 17 days. Another shutdown would be embarrassing for Trump, as it would start on his 100th day in office and would cast doubts on his ability to push his budget and tax plan through Congress.
EUR/JPY Strong Bullish Pressures, EUR/GBP Short-Term Bullish Pressures, EUR/CHF Strengthening.
EUR/JPY Strong bullish pressures.
EUR/JPY is back around 120.00. Key resistance stands at 123.31 (27/01/0217 high). Major support is given at 114.90 (18/04/2017low). Expected to see short-term bearish pressures.
In the longer term, the technical structure validates a medium-term succession of lower highs and lower lows. As a result, the resistance at 149.78 (08/12/2014 high) has likely marked the end of the rise that started in July 2012. Strong support at 94.12 (24/07/2012 low) looks nonetheless far away.
EUR/GBP Short-term bullish pressures.
EUR/GBP is slowly recovering after unsuccessfully challenged its key support at 0.8304. The pair now lies in a short-term bullish pattern. Yet, the technical structure is negative as long as the resistance at 0.8596 holds. Expected to show renewed weakness.
In the long-term, the pair has largely recovered from recent lows in 2015. The technical structure suggests a growing upside momentum. The pair is trading above from its 200 DMA. Strong resistance can be found at 0.9500 psychological level.
EUR/CHF Strengthening.
EUR/CHF continues to push higher, yet very slightly. However, despite the sharp increase and the bullish breakout which is very likely psychological, we believe that the medium-term pattern suggests us to see at some point renewed bearish pressures towards key support that can be found at 1.0623 (24/06/2016 low).
In the longer term, the technical structure is mixed. Resistance can be found at 1.1200 (04/02/2015 high). Yet,the ECB's QE programme is likely to cause persistent selling pressures on the euro, which should weigh on EUR/CHF. Supports can be found at 1.0184 (28/01/2015 low) and 1.0082 (27/01/2015 low).
USD/CHF Trading Sideways, USD/CAD Lack Of Follow-Through, AUD/USD Continued Decline.
USD/CHF Trading sideways.
USD/CHF keeps on declining despite strong volatility. The short-term technical structure is negative as long as prices remain below the hourly resistance at 1.0171 (07/03/2017). Monitor strong support given at 0.9814 (27/03/2017 low).
In the long-term, the pair is still trading in range since 2011 despite some turmoil when the SNB unpegged the CHF. Key support can be found 0.8986 (30/01/2015 low). The technical structure favours nonetheless a long term bullish bias since the unpeg in January 2015.
USD/CAD Lack of follow-through.
USD/CAD has broken key resistance given at 1.3599 (28/12/206 high). Yet, the pair has failed to go any higher. There is still a strong upside momentum. Hourly support can be found at 1.3411 (24/04/2017 high) then 1.3353 (20/01/2017 high). Expected to show renewed bullish pressures as long as the pair remains above 1.3411.
In the longer term, there is a golden cross with the 50 dma crossing the 200 dma indicating further upside pressures. Strong resistance is given at 1.4690 (22/01/2016 high). Long-term support can be found at 1.2461 (16/03/2015 low).
AUD/USD Continued decline.
AUD/USD is still trying to bounce off strong support at 0.7473 (12/04/2017 low). However, as long as prices remain below the resistance at 0.7608 (17/04/2017 high), the short-term technical structure is negative. Key resistance stands at 0.7681 (30/03/2017 high).
In the long-term, we are waiting for further signs that the current downtrend is ending. Key supports stand at 0.6009 (31/10/2008 low) . A break of the key resistance at 0.8295 (15/01/2015 high) is needed to invalidate our long-term bearish view.
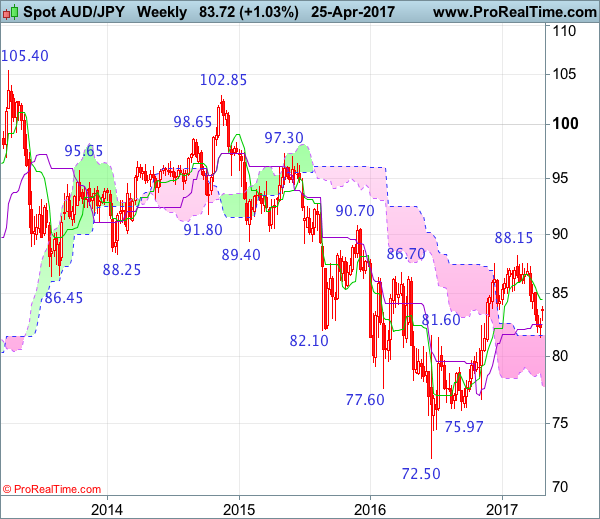
AUD/JPY Candlesticks and Ichimoku Analysis
Weekly
• Last Candlesticks pattern: Shooting star
• Time of formation: 13 Mar 2017
• Trend bias: Down
Daily
• Last Candlesticks pattern: Bearish engulfing pattern
• Time of formation: 16 Feb 2017
• Trend bias: Near term down
Although the Australian dollar opened higher this week and rose to as high as 83.95 earlier this week, as this move is viewed as retracement of recent decline, reckon upside would be limited to the Kijun-Sen (now at 84.37) and bring retreat later, a daily close below the Tenkan-Sen (now at 82.72) would bring test of 82.00 but break of latter level is needed to signal the rebound from 81.49 low has ended, bring retest of this level later. A drop below this level would extend recent decline from 88.15 top to support at 81.10-15, however, near term oversold condition should limit downside and reckon 80.00 psychological support would hold from here, bring rebound later.
On the upside, whilst initial marginal recovery cannot be ruled out, reckon the Kijun-Sen (now at 84.30) would limit upside and bring another decline to aforesaid downside targets. Only a daily close above resistance at 84.41 would abort and suggest low is formed instead, risk a stronger rebound to 85.00-10 but said resistance at 85.75 should remain intact, bring another decline later.
Recommendation: Hold short entered at 83.65 for 81.65 with stop above 84.65.
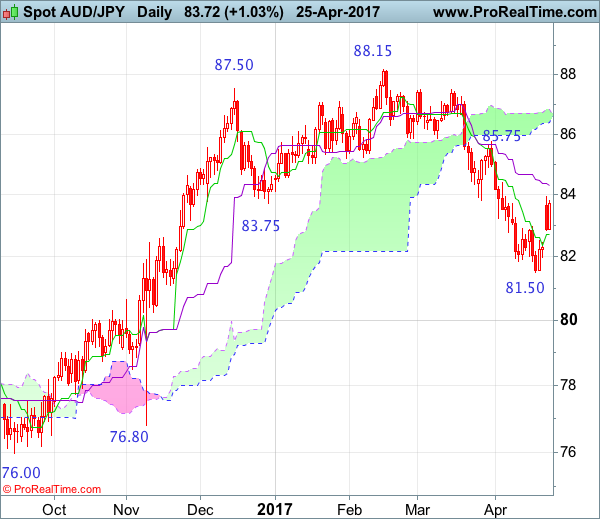
On the weekly chart, after finding support at 81.49 last week, aussie found good support there and has rebounded, suggesting consolidation above this level would be seen, however, still reckon upside would be limited to the Tenkan-Sen (now at 84.50) and bring another decline later, below the Kijun-Sen (now at 82.49) would bring weakness to 82.00 but break there is needed to signal the rebound from 81.49 has ended, bring retest of this level later. A drop below this level would extend the fall from 88.15 top to support at 81.10-15, a weekly close below there would retain bearishness and suggest the rise from 72.50 has ended, then further fall to 80.50 and possibly psychological support at 80.00 would follow.
On the upside, expect recovery to be limited to the Tenkan-Sen (now at 84.50) and bring another decline. A weekly close above this level would suggest low is formed instead, bring a stronger rebound to 85.00, then towards resistance at 85.75 but only break there would abort and signal low is formed instead, bring further subsequent gain to 86.00 and then 86.50-60, however, price should falter below resistance at 87.50.