Sample Category Title
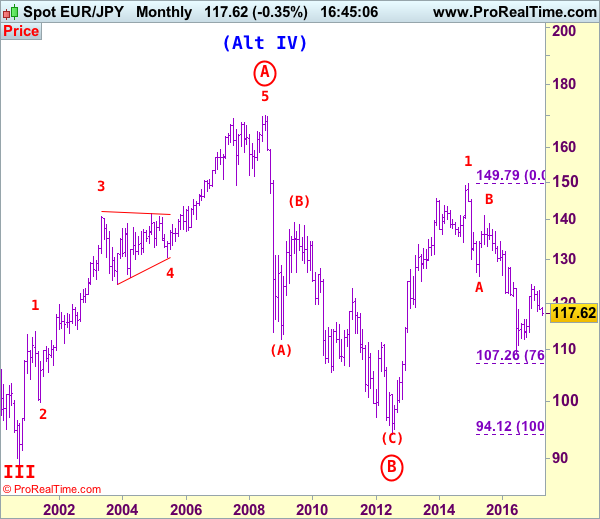
EUR/JPY Elliott Wave Analysis
EUR/JPY - 116.72
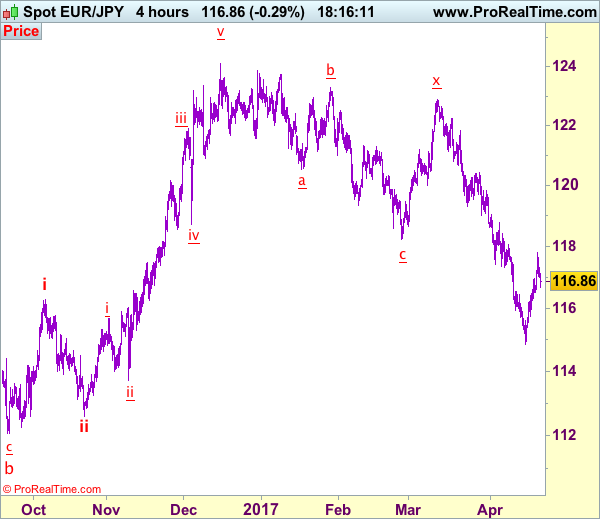
EUR/JPY: Wave v as well as larger degree wave (C) ended at 94.11 and first leg of larger degree wave C upmove has possibly ended at 149.79 and wave 2 correction has possibly ended at 109.49.
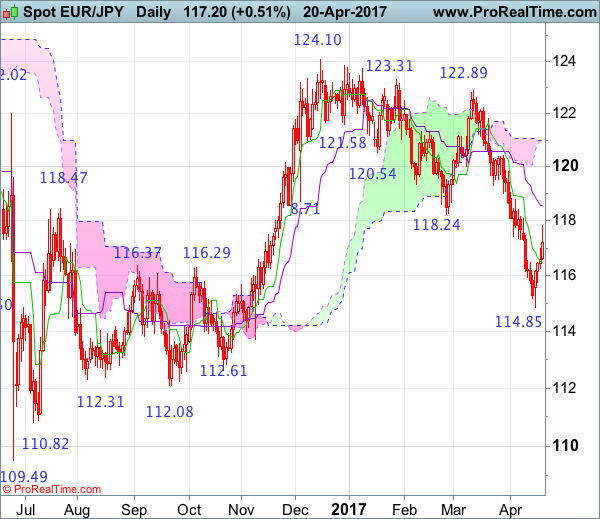
Although the single currency extended recent decline to 114.85, as euro found good support there and has rebounded, suggesting consolidation above this level would be seen with initial upside bias for recovery to 118.00-10, however, reckon upside would be limited to 118.70-80 and bring another decline later, below 115.75-80 would bring another fall to 114.85 support but break there is needed to confirm the decline from 124.10 top has resumed for further fall to 113.72 (previous support0 and possibly towards 113.00-10 but price should stay above previous chart support at 112.61.
The daily chart is labeled as attached, early selloff from 169.97 (July 2008) to 112.08 is wave (A) of B instead of end of entire wave B and then the rebound from there to 139.26 is wave (B), hence, wave (C) has possibly ended at 94.12 with a diagonal triangle as labeled in the daily chart, hence upside bias is seen for further gain. Recent rally above indicated retracement level at 116.69 (50% Fibonacci retracement of the intermediate fall from 139.26-94.12) adds credence to this view and signal major reversal has commenced but first leg of this wave C has possibly ended at 149.79, hence wave 2 has commenced with wave A ended at 126.09, followed by wave B at 141.06, wave C commenced and could have ended at 109.49, above 125.00 would add credence to this view.
On the upside, whilst initial recovery to 117.30-40, then 118.00 cannot be ruled out, reckon upside would be limited to 118.70-80 and bring another decline later. Above previous support at 119.32 would defer and suggest low is possibly formed, risk a stronger rebound to 119.80-85 but only a daily close above indicated resistance at 120.44 would provide confirmation, bring a stronger rebound to 120.90-00 and possibly 121.30-35 but price should falter well below resistance at 121.84.
Recommendation: Sell euro at 118.80 for 116.00 with stop above 119.80.

To re-cap the corrective upmove from the record low of 88.93 (18 Oct 2000), the wave A from there is subdivided as: 1:88.93-113.72, 2:99.88 (1 Jun 2001), 3:140.91 (30 May 2003), 4:124.17 (10 Nov 2003) and 5 ended at record high of 169.97 (21 Jul 2008). The brief but sharp selloff to 112.08 is viewed as a-b-c x a-b-c wave (A) of B. The subsequent rebound to 139.26 is (B) of B and (C) of (B) has possibly ended at 94.12 and in any case price should stay well above previous chart support at 88.93, bring rally in larger degree wave C towards 150.00.
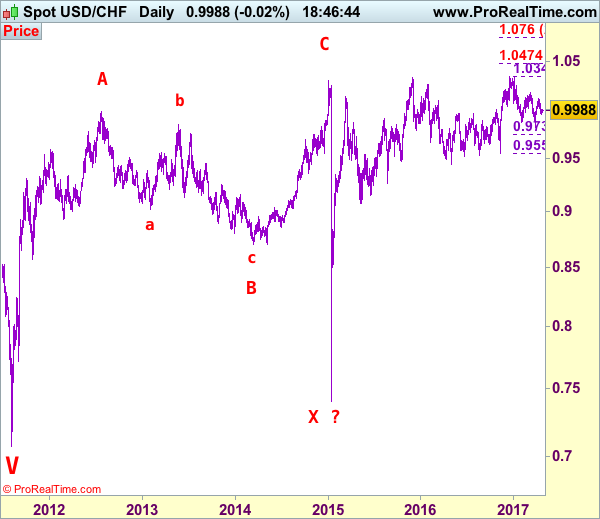
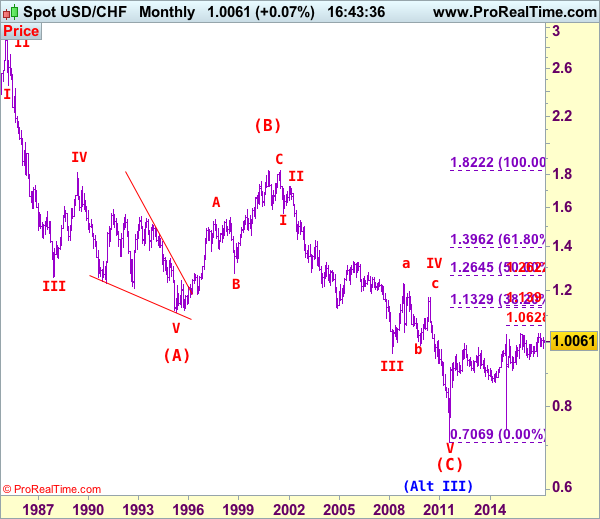
USD/CHF Elliott Wave Analysis
USD/CHF – 0.9987
USD/CHF – Wave IV ended at 1.1730 and wave V has possibly ended at 0.7068
Although the greenback has retreated after meeting resistance at 1.0108 earlier this month and consolidation with initial downside bias is seen for weakness to 0.9940-45, if our view that low has been formed at 0.9813 is correct, downside should be limited to 0.9900-05 and bring another rebound later. A daily close above 1.0065-70 would suggest the retreat from 1.0108 has ended, bring test of this level, having said that, price should falter below resistance at 1.0171, bring retreat later. In the event dollar breaks above said resistance at 1.0171, this would revive our bullish view for the erratic rise from 0.9861 to extend further gain to 1.0200 and possibly test of resistance at 1.0248, however, a daily close above there is needed to signal the retreat from 1.0344 has ended at 0.9861, bring eventual retest of 1.0344.
Our preferred count on the daily chart is that early selloff to 0.9630 is an end of the larger degree wave III and major correction is unfolding from there with a leg ended at 1.2298 (Nov 2008 with (a): 1.0625, (b):1.0011 and (c):1.2298), wave b ended at 0.9910 with (a): 1.0370, (b): 1.1967, (c): 0.9910. The rise from there to 1.1730 is the wave c which also marked the end of wave IV and wave V has possibly ended at 0.7068.
On the downside, whilst pullback to 0.9940 cannot be ruled out, reckon downside would be limited to 0.9900 and bring another rise later. Below 0.9850-60 would suggest the rebound from 0.9813 has ended instead bring another fall towards said support at 0.9813. Looking ahead, only a break below this level would confirm another leg of major fall from 1.0344 top is underway for further fall to 0.9735-40, however, oversold condition should prevent sharp fall below 0.9675-80 and price should stay well above 0.9600, bring rebound later.
Recommendation: Buy at 0.9905 for 1.0105 with stop below 0.9805
Dollar's long-term downtrend started from 2.9343 (Feb 1995) and it was unfolding as a (A)-(B)-(C) with (A): 1.1100, (B): 1.8310 (26 Oct 2000), then followed by another impulsive wave (C) with wave III ended at 0.9630 (Mar 2008). Under this count, correction in wave IV has possibly ended at 1.1730 and wave V already broke below support at 0.9630 and met indicated downside target at 0.7500 and 0.7400. The reversal from 0.7068 suggests the wave V has possibly ended and the breach of resistance at 0.9595 add credence to this view and indicated upside target at 1.0000 had been met, however, the sharp retreat from 1.0296 to 0.7401 suggests choppy trading would be seen but price should stay above said record low at 0.7068.
Technical Outlook: AUDUSD – Recovery Remains Limited Despite Thursday’s Close Above 100SMA
The Aussie remains constructive on Friday and extends recovery rally from 0.7490 low, following Thursday's close above initial barrier at 0.7521 (100SMA) that generated bullish signal. However, bulls were so far capped by daily Tenkan-sen line (0.7540) which was cracked on yesterday's spike to 0.7545, but without sustained break. Bullishly aligned hourly studies are supportive but mixed setup of 4-hr indicators and overall bearish structure on daily chart suggest limited recovery before fresh push lower. Extended upticks should remain capped under 200SMA (0.7548) to keep bears intact. Otherwise, further retracement of 0.7608/0.7489 downleg could be expected. Sustained break above 200SMA would open 0.7565 (Fibo 61.8%, reinforced by falling 20SMA) and confirm reversal on break higher.
Res: 0.7540, 0.7550, 0.7565, 0.7580
Sup: 0.7521, 0.7513, 0.7490, 0.7471
Strategy: Winds Of Political Change Blowing Over Europe
Key points
- Elections in Europe come against the backdrop of the global business cycle looking to lose momentum.
- First round of French presidential elections too close to call.
- Relief rally expected if mainstream candidates go to second round.
- A run-off between Marine Le Pen and Jean-Luc Mélenchon cannot be precluded and could set off a major market correction.
- The UK election is likely to strengthen Theresa May's hand in the upcoming Brexit negotiations
This week is dominated by political headlines in Europe. The first round of the French presidential election is upon us on Sunday. It has been awaited (or feared) for months, or basically since last year's surprise Brexit outcome and Donald Trump's victory, which served as a reminder that populist movements are taking hold in western politics. Also, as if the political calendar was not crowded enough already, UK Prime Minister Theresa May has called a general election for 8 June. In the midst of this frantic European political calendar, economic data releases and central bank views are almost taking a backseat to political events. Hence, the title of our FX Forecast Update this week: Political risks are in charge. However, before turning to the likely outcome and market implications of these key political events, it is worth taking a look at our latest take on the global business cycle.
Our global business cycle model points to weakening growth momentum ahead
Our leading macroeconomic model MacroScope this week pointed to further weakening momentum in the global business cycle in the period ahead. The model paints a picture of the underlying macro environment on a three- to six-months horizon. While the underlying macro environment is getting more bullish, the market has already rallied and is in neutral to slightly overbought territory now. This points to a rising risk that we are moving into a scenario that tends to entail more frequent corrections in risk markets. In other words, the sensitivity to external shocks such as perceived adverse political events will increase
Stakes are high and outcomes unpredictable ahead of first round of the French presidential election
Although Macron seems set to be the likely winner of the French presidential elections, none of the leading four candidates can be written off at this time. The race between the four leading candidates Marine Le Pen, Emmanuel Macron, François Fillon and Jean-Luc Mélenchon has narrowed over the past month and the outcome is likely to be tight (see French Election Monitor No. 3: Markets hold their breath as first election round draws near, 21 April). Also, the terror event in Paris last night may swing some voters towards Le Pen. Recent weeks have seen a surge in the polls of the far left-wing candidate after a strong performance in the TV debates. Although a run-off on 7 May between Le Pen and Macron still seems to be the most likely outcome according to the polls, the other two major candidates cannot be written off, especially as almost a quarter of the voters are still undecided and the turnout is expected to be low due to widespread dissatisfaction with the established political class. Also, as we know from last year's elections, some caution should be taken with regard to polls.
The different election outcomes could have widespread implications for France and the EU more generally. Both Mélenchon and Le Pen share a similar EU-sceptic and antiglobalisation stance. Mélenchon wishes to renegotiate EU treaties and hold a subsequent EU referendum on the result as well as ending the independence of the ECB. Both candidates support expansionary fiscal policies with little regard to the EU deficit rules. They also liken a ‘France-first' to public procurement and investment policies. On the other hand, a victory by Fillon and to some extent Macron would be likely to be followed by a reform drive in the French economy and the EU more generally.
We have divided the range of possible outcomes into three scenarios: a ‘low-risk' scenario entailing no EU-sceptic candidates making it to the second round; a ‘mediumterm' risk scenario where an EU-sceptic candidate makes it to the second round but an established candidate looks likely to be the winner; and a ‘high-risk' scenario, where Le Pen and Mélenchon face each other in the second round or if one of them receives much stronger than expected support in the first round (30-49% of the votes), increasing the chances that they will beat either Macron or Fillon in the second round.
What is the initial market reaction following the first round likely to be? In the ‘lowrisk' scenario, we will probably see a relief rally, sending equities and the EUR up, while fixed income markets would be likely to see some sell-off. In the ‘medium-risk' scenario, we expect the market reaction to be fairly modest, as markets are most likely positioned for this already. However, in the high-risk scenario, we may easily see a sharp equity market sell-off given possible ramifications for the French economy and the EU as well as the euro. We think there will be a sell-off in French government bonds. We see the EUR/USD falling to the lower part of the current range of 1.04-1.10 in this scenario.
UK election likely to strengthen Theresa May's hand in the upcoming Brexit negotiations
The surprise of the week was the decision by UK Prime Minister Theresa May to call snap elections scheduled for 8 June. This move is no doubt an attempt to strengthen her powers both within and outside the conservative party, as the polls point to a solid victory for the Conservative Party. Such a victory, increasing the party's majority in parliament beyond the current 330 seats (32 seats required for majority), would make her less vulnerable during the upcoming Brexit negotiations to the threat from fractions within the Conservative Party that either want a tougher line in the Brexit negotiations (e.g. UKIP) or seeking to soften terms or even to reverse the Brexit decision. Such a scenario is by no means guaranteed, as the Conservative Party may fail to clinch as strong a victory as expected (leaving a status quo situation) or we could even see Labour, the Liberal Democrats and possibly the SNP forming some sort of a coalition that would allow them to reverse the Brexit decision. The market is clearly positioning for a weakening of the Brexit terms as the GBP has strengthened on the back of the news. Short term, the general election means there is one more uncertainty factor for the GBP, as the sample space for UK-EU relations has suddenly widened again, with a chance now that Brexit may be softened (or cancelled altogether should the May government be ousted). However, our base case remains that May will stay in power and negotiate a ‘decent Brexit' (neither too hard nor too soft). This would mean a level shift higher for EUR/GBP post the June election. However, the probability of other outcomes has clearly risen
Trade Idea: EUR/JPY – Sell at 118.40 or buy at 115.80
EUR/JPY - 117.77
Recent wave: wave v of (C) ended at 94.12 and major correction in wave A has ended at 149.79
Trend: Near term down
Original strategy:
Sell at 118.40, Target: 116.40, Stop: 119.00
O.C.O.
Buy at 115.80, Target: 117.80, Stop: 115.20
Position: -
Target: -
Stop: -
New strategy :
Sell at 118.40, Target: 116.40, Stop: 119.00
O.C.O.
Buy at 115.80, Target: 117.80, Stop: 115.20
Position: -
Target: -
Stop:-
As the single currency has finally retreated after rising to 117.82 yesterday, suggesting consolidation below this level would be seen and pullback to 116.00-10 cannot be ruled out, however, if our view that a temporary low formed at 114.85 is correct, downside should be limited to 115.70-75 and bring another rebound later, above said resistance would extend the rebound from 114.85 to 118.00-10 but reckon upside would be limited to 118.40-50 and bring retreat later.
In view of this, whilst we are looking to turn long on dips, we would also sell euro on subsequent rebound towards 118.40-50. Only below said support at 114.85 would signal recent entire fall from 124.10 top is still in progress and downside risk remains for further weakness to 114.40-50, then towards 114.00-10, however, near term oversold condition should prevent sharp fall below latter level and risk from there is seen for a much-needed rebound to take place later.
Our latest preferred count is that wave (ii) is ABC-X-ABC which ended at 123.33 and wave (iii) is unfolding with wave iii ended at 100.77, followed by wave iv at 111.57 and wave v as well as the wave (iii) has ended at 97.04, followed by wave (iv) at 111.43 and wave (v) has ended at 94.12 which is also the end of the larger degree v, this also implied the major wave (C) has also ended there, hence major correction has commenced from there with (A) leg unfolding in its lower degree wave c which has possibly ended at 145.69. Under this count, A-B-C wave (B) has commenced with A leg ended at 136.23, wave B at 143.79 and wave C has possibly ended at 149.79.
Our larger degree count is that the decline from 139.26 is wave (C) and is sub-divided into a diagonal triangle i-ii-iii-iv-v with wave i - 105.44, wave ii- 123.33, wave iii - 97.03, wave iv - 111.43, followed by the final wave v as well as the end of wave (C) at 94.12, this also mark the bottom of larger degree wave B. Under this count, major rise in wave C has commenced as an impulsive wave with minor wave III ended at 145.69, wave V is still in progress for further gain to 150.00. Having said that, this so-called wave V could well be the first leg of larger degree 5-waver wave C and this wave C should bring at least a retest of wave A top at 169.97 (July 2008).
Trade Idea: AUD/USD – Stand aside
AUD/USD – 0.7522
Recent wave: Wave 5 ended at 1.1081 and major correction has commenced for fall to 0.7000 and then towards 0.6500-10
Trend: Near term down
New strategy :
Stand aside
Position: -
Target: -
Stop:-
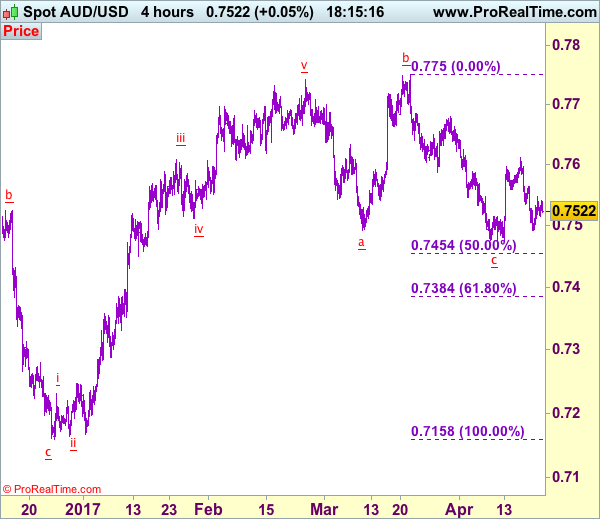
Although aussie fell quite sharply this week and dropped to as low as 0.7491, the subsequent recovery from there suggests consolidation would be seen, above 0.7550 would bring another bounce to 0.7570-75 but price should falter well below resistance at 0.7611, bring another decline later.
Below said support at 0.7491 would bring test of indicated previous support at 0.7473, however, break there is needed to retain bearishness and extend the fall from 0.7750 top to 0.7450-55 (50% Fibonacci retracement of 0.7158-0.7750) but oversold condition should limit downside to 0.7380-85 (61.8% Fibonacci retracement), risk from there is seen for a rebound later. As near term outlook is mixed, would be prudent to stand aside in the meantime.
On the 4-hour chart, the move from 0.8066 is the wave 5 with i: 0.8860, ii: 0.8315, wave iii is an extended move ended at 1.0183, iv: 0.9706 and wave v has ended at 1.1081 (also the top of entire wave 5). The subsequent selloff is the major correction which is unfolding as ABC-X-ABC and 2nd A leg has ended at 0.8848, followed by a-b-c wave B which ended at 0.9758, hence, 2nd C wave is now in progress and indicated downside target at 0.7000 and 0.6950 had been met, so further fall to 0.6710-20 cannot be ruled out.
Euro In Tight Range Ahead Of French Election
EUR/USD is showing little movement in the Friday session. Currently, the pair is trading just above the 1.07 line. On the release front, Eurozone and German Manufacturing PMIs both beat their estimates, and the Eurozone current account surplus was much higher than expected. In the US, today's key event is Existing Home Sales, which is expected to climb to 5.61 million. On Saturday, US Treasury Secretary Robert Mnuchin will speak at the International Monetary Fund meeting in Washington. On Sunday, France goes to the polls for the first round of the presidential election.
Sunday is Election Day across France, which holds the first round of the presidential election. The election campaign has been divisive and charged, so perhaps it's fitting that the four front-runners (in a crowded field of 11) are all within a few percentage points of one another. Given the tightness of the race, final opinion polls have become market-movers. An opinion poll on Thursday showed centrist Emmanuel Macron with 25% of the vote, just ahead of far-right candidate Marie Le Pen with 22%. Le Pen's platform includes sharp curbs on immigration and a referendum on France's membership in the European Union. If Le Pen does better than predicted, investor sentiment could sour and send the euro sharply lower. A shooting in Paris on Thursday which killed a policeman and a tourist have stretched taught nerves even further, as security and the terrorism threat remain one of the key issues in the campaign. The markets are expecting more volatility ahead of and following the election, and French banks will be staffed throughout Sunday night in order to respond quickly to developments in the currency markets after the election results.
OANDA's Senior Currency Analyst Alfonso Esparza provides further analysis of the election in French Presidential Election Outcome Raising Market Anxiety.
PMI reports for March from the eurozone, France and Germany all pointed to expansion in the services and manufacturing sectors, underscoring an improving eurozone economy. Manufacturing data was particularly encouraging, as Eurozone and German Manufacturing PMIs came in at 56.8 and 56.2 respectively, as both readings beat their estimates. The strong PMI numbers have helped support the euro on Friday, as cautious investors keep a close eye on Sunday's vote in France. There was more positive news as the eurozone's current account surplus jumped to EUR 37.9 billion, well above the estimate of EUR 26.3 billion.
The Federal Reserve has broadly hinted that it will gradually raise rates in 2017, but it's unclear how many times Janet Yellen will press the rate trigger. Most analysts are expecting two more moves this year, but there have been calls from some Fed policymakers for three more hikes. However, soft retail sales and CPI numbers in March are likely to make the Fed more dovish, and on Tuesday, the Atlanta and New York Federal Reserve lowered their outlook for US economic growth for the first quarter. The Fed can point to a labor market that is close to capacity as well as strong consumer confidence, but surprisingly, this has not translated into stronger consumer spending, a key driver of economic growth. Will the Fed raise rates in June? The odds of a June move are showing a surprising amount of volatility, and the latest CME Group reading shows the likelihood a 1/4 point hike have jumped to 58%, up from 45% earlier this week.
EUR/JPY Candlesticks and Ichimoku Analysis
Weekly
• Last Candlesticks pattern: Hammer
• Time of formation: 19 Sep 2016
• Trend bias: Down
Daily
• Last Candlesticks pattern: Doji
• Time of formation: 28 Mar 2017
• Trend bias: Near term up
EUR/JPY – 117.65
As the single currency has finally rebounded after falling to 114.85 (a white candlestick with a long lower shadow was formed on the daily chart), suggesting consolidation above this level would be seen and another bounce to 118.00 cannot be ruled out, however, reckon upside would be limited to the Kijun-Sen (now at 118.56) and bring another decline later, below 115.75-80 would bring retest of 114.85 but break there is needed to signal recent decline has resumed and extend further weakness to 114.00 and possibly towards 113.40-50.
On the upside, whilst initial recovery to 118.00 cannot be ruled out, reckon upside would be limited to the Kijun-Sen (now at 118.56) and bring another decline later. A daily close above resistance at 118.80 would defer and risk a stronger rebound to previous support at 119.32 but resistance at 119.85 should remain intact, bring another decline later. Only above resistance at 120.44 would abort and signal recent decline has ended instead, bring further gain towards the Ichimoku cloud (now at 120.99-121.01).
Recommendation: Sell at 118.70 for 116.70 with stop above 119.70.
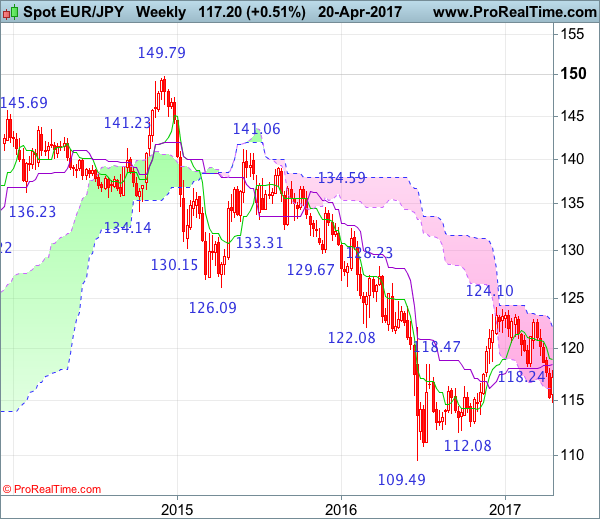
On the weekly chart, euro’s rebound after falling to 114.85 looks set to form a white candlestick this week, hence consolidation with mild upside bias is seen for retracement to 118.00, then test of the Kijun-Sen (now at 118.47) but reckon renewed selling interest should emerge around the Tenkan-Sen (now at 118.87) and bring another decline later. Below 115.50-55 would bring retest of 114.85 but break there is needed to signal recent decline from 124.10 has resumed and extend further weakness to 114.00, then 113.70-75. Looking ahead, below the latter level is needed to signal the rebound from 109.49 has ended at 124.10, bring further fall to 113.00 and then 112.50-60.
On the upside, expect recovery to be limited to the Kijun-Sen (now at 118.47) and the Tenkan-Sen (now at 118.87) should hold, bring another decline later. Only above previous support at 119.32 would defer and suggest low is possibly formed instead, risk a stronger rebound to 120.00 but break of resistance at 120.44 is needed to confirm and suggest recent decline from 14.10 has ended instead, bring a stronger rebound to 121.15-20 but resistance at 121.84 should remain intact.
Technical Outlook: USDJPY – Recovery Rally Shows Initial Signs Of Stall, Overall Picture Remains Negative
The pair is back to red in early Friday's trading, after two day recovery rally showed signs of stall after peaking at 109.47 and being unable to close above falling 10SMA (currently at 109.16).
Near-term risk is turning again towards 200SMA (108.88), return below which would weaken near-term structure.
Overall bias remains shifted lower as daily technicals are negative and last week's long bearish candle weighs heavily on the market.
The pair may hold in extended consolidation before fresh attack at this week's low at 108.11 and extension of broader downtrend an break below 108.11 and next target at 107.84 (Fibo 61.8% retracement of Jun/Dec 2016 101.17/118.65 rally).
Alternative scenario requires strength through psychological 110.00 barrier at 110.20 (falling 20SMA) to neutralize immediate downside threats and signal stronger correction of 111.56/108.11 downleg.
Res: 109.47, 109.84, 110.00, 110.20
Sup: 108.88, 108.63, 108.30, 108.11
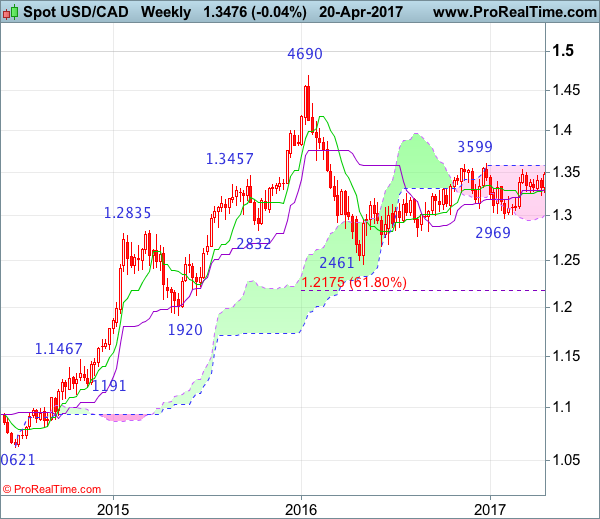
USD/CAD Candlesticks and Ichimoku Analysis
Weekly
• Last Candlesticks pattern: Bullish engulfing
• Time of formation: 02 May 2016
• Trend bias: Up
Daily
• Last Candlesticks pattern: Hammer
• Time of formation: 19 Oct 2016
• Trend bias: Up
USD/CAD – 1.3395
The greenback found decent demand at 1.3223 early last week and has staged a strong rebound (a hammer and a long white candlestick bullish patterns were formed on the daily chart), the subsequent breach of previous resistance at 1.3456 confirms the correction from 1.3535 has ended at 1.3223, bring retest of this level later. Looking ahead, a break of the level would retain bullishness and extend early erratic upmove from 1.2461 low to 1.3599, then 1.3660-70 but still reckon upside would be limited to 1.3700 and risk from there is seen for a retreat later.
On the downside, whilst pullback to 1.3400 cannot be ruled out, reckon the Kijun-Sen (now at 1.3362) would contain weakness and bring another rise later. A daily close below the upper Kumo (now at 1.3339) would defer and prolong consolidation, risk weakness to 1.3262 support but last week’s low at 1.3223 should remain intact, bring another rebound later. In the event the pair drops below said support at 1.3223, this would shift risk back to the downside for the erratic fall from 1.3535 to bring correction of early upmove to 1.3200, then 1.3160-65 but reckon downside would be limited to 1.3100 and price should stay well above support at 1.3056, bring rebound later.
Recommendation: Buy at 1.3400 for 1.3590 with stop below 1.3300.
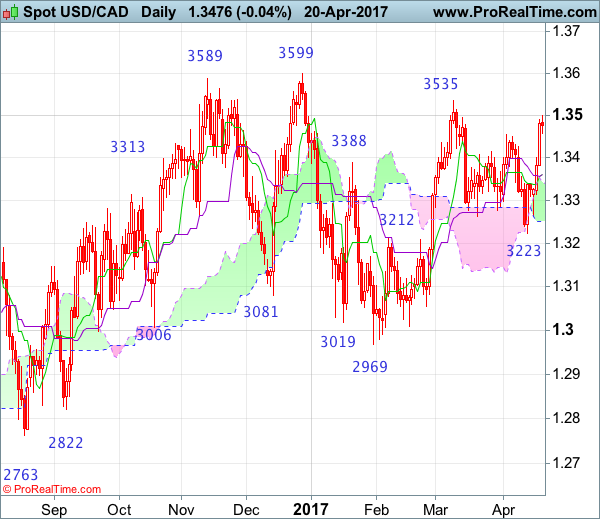
On the weekly chart, as the greenback has staged another strong rebound after finding good support at 1.3223 last week, suggesting the pullback from 1.3535 has ended there and consolidation with upside bias is seen for further gain towards said resistance, however, break there is needed to retain bullishness and extend the rise from 1.2969 to indicated previous resistance at 1.3599 but only a break of this resistance would signal upmove from 1.2461 (2016 low) has resumed for headway to 1.3700 and later towards 1.3835-40 (61.8% Fibonacci retracement of 1.4690-1.2461) which is likely to cap upside.
On the downside, expect pullback to be limited to 1.3400-10 and 1.3360-65 should hold, bring another rise later. Below the Kijun-Sen (now at 1.3284) would bring test of said support at 1.3223 should remain intact, bring another rebound later. A weekly close below this support would signal top has been formed at 1.3535 and test of previous resistance at 1.3210 would follow, however, break there is needed to add credence to this view, bring further fall to 1.3150-60, break there would signal the rebound from 1.2969 has ended, bring subsequent decline towards 1.3083 but indicated support at 1.3056 should hold from here, risk from there has increased for a rebound later.