Sample Category Title
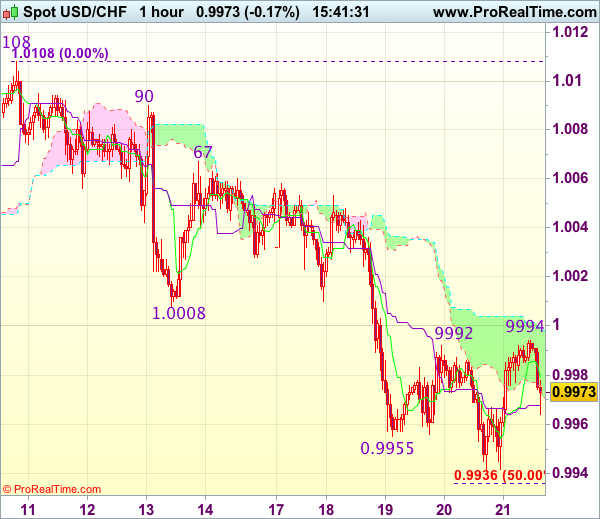
Trade Idea : USD/CHF – Stand aside
USD/CHF - 0.9977
Most recent candlesticks pattern : N/A
Trend : Near term down
Tenkan-Sen level : 0.9955
Kijun-Sen level : 0.9967
Ichimoku cloud top : 1.0004
Ichimoku cloud bottom : 0.9978
New strategy :
Stand aside
Position : -
Target : -
Stop : -
The greenback rebounded after holding above yesterday’s low at 0.9941, suggesting consolidation above this level would be seen and test of previous support at 1.0008 (now resistance) cannot be ruled out, however, break there is needed to signal low is formed and bring retracement of recent decline from 1.0108 to 10030 but resistance at 1.0067 should remain intact.
On the downside, below said support at 0.9941 would extend recent decline to 0.9935-38 (50% projection of 1.0067-0.9955 measuring from 0.9992) and then 0.9926 (61.8% Fibonacci retracement of 0.9813-1.0108) but reckon 0.9900-05 (1.618 times projection of 1.0108-1.0008 measuring from 1.0067) would hold, bring rebound later. As near term outlook is mixed, would be prudent to stand aside for now.
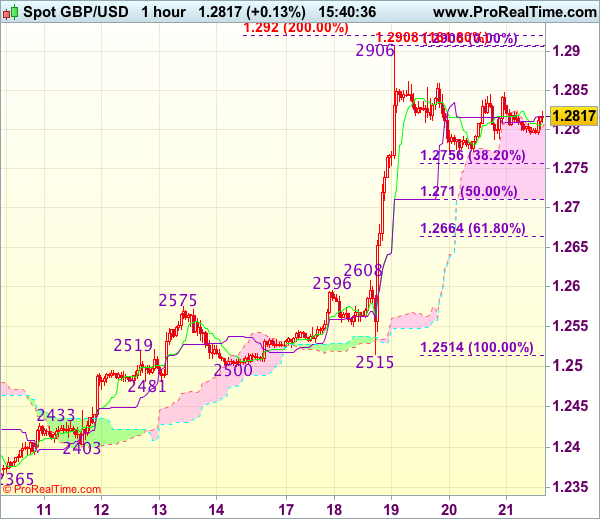
Trade Idea : GBP/USD – Buy at 1.2710
GBP/USD - 1.2827
Most recent candlesticks pattern : N/A
Trend : Near term up
Tenkan-Sen level : 1.2814
Kijun-Sen level : 1.2817
Ichimoku cloud top : 1.2810
Ichimoku cloud bottom : 1.2711
Original strategy :
Buy at 1.2710, Target: 1.2850, Stop: 1.2675
Position : -
Target : -
Stop : -
New strategy :
Buy at 1.2710, Target: 1.2850, Stop: 1.2675
Position : -
Target : -
Stop : -
Cable has remained confined within familiar range and further sideways trading is in store, however, downside should be limited to 1.2755-60 (38.2% Fibonacci retracement of 1.2515-1.2906) and reckon 1.2700-10 would hold, bring another rally, break of 1.2755069 would signal the pullback from 1.2906 has ended, bring retest of this level, break there would extend recent upmove to 1.2920-30 (2 times extension of 1.2365-1.2575 measuring from 1.2500), then 1.2950 but loss of near term upward momentum should prevent sharp move beyond 1.2990-00 (1.236 times projection of 1.2109-1.2616 measuring from 1.2365 and psychological resistance).
In view of this, would not chase this rise here and would be prudent to buy cable on subsequent pullback as downside should be limited to 1.2710 (50% Fibonacci retracement of 1.2515-1.2906), bring another rise. Below 1.2700 would defer and signal top has been formed, risk correction to 1.2660-65 (61.8% Fibonacci retracement of 1.2515-1.2906) and price should stay well above 1.2608-16 (previous resistance now support).
All Eyes On The 1st Round Voting Of The French Election
The first round of the French presidential election will be held this Sunday, April 23rd. The market consensus for the first-round of the election is that the Centrist Macron and the far-right wing Le Pen will both capture enough votes to proceed to the second round, but this is very much still a four-horse race.
Recent polls have shown there is still the possibility that the far-left wing Mélenchon could be a contender and make it into the final two, though vastly different from Le Pen, his policies would be likely to have a similar result to Le Pen with the markets seeing rallies of safe havens (such as gold, the yen and the Swiss franc), with lower European stocks and a falling Euro.
The far-right Le Pen looks set to make the second round, the markets will be keeping any eye out for any possible increase of more than her expected share of vote, this would likely lead to some worry within the markets which are likely to be spooked by the possibility of a Le Pen presidency.
The independent centrist candidate Macron is in favour of free trade and the integrity of the EU. HIs measures aim to change the country’s long-standing bureaucracy and excessive government control to revive the sluggish economic performance. At the moment, Macron or his compatriot Fillion are the best outcome for the Euro and the single market.
Non-voting share and undecided voters are likely to play decisive roles in this election. The IFOP polls showed there are about 31% non-voting and 28% undecided voters. We are a long way from the finish line but the future fate of France and to some extent the Euro itself will be a little closer after Sundays first round of the election.
Asia Très Calme Ahead Of French Vote
Euro and GBP are unchanged, and most asset classes in Asia are almost so, as markets await France's 1st round presidential runoff this weekend.
If the price action on most G-10 currency pairs and precious metals were an electrocardiogram printout today, the Doctor would be screaming 'code blue' and reaching for the electric paddles; such has been the quietness of the price action. Asia has any positioning it wants (or not) into this weekend's French election, or they are content to let early Europe lead the way. With currencies and metals becalmed, only equity indices have shown signs of life, moderately up following Wall Street's performance overnight.
On the data front, it is strictly 2nd tier with PMI's from the eurozone, Germany, France and the U.S. Canada releases its March CPI which might spark some activity for traders of the loonie persuasion. Otherwise, we expect markets to move on headlines and final rejigging of positions into this weekend's 'Le Crunch.'
FX
EUR/USD
Monday morning's price action may well be 'exciting' to say the least in the twilight zone of early New Zealand and Australia when the results come out. It's worth, therefore, taking a look at some of the bigger picture levels.
EUR has resistance at yesterday's high of 1.0780 followed by the 200-day moving average (DMA) at 1.0845 and then March's high of 1.0905.
Support sits at the 100-DMA at 1.0633 ahead of the rising trendline back to December at 1.0610. After this, we have 1.0490 and then 1.0390.
A Melenchon vs. Le Pen run-off may well render these levels academic I will add.
USD/JPY
Has been gratefully out of the limelight this week as Europe takes the limelight. Easing tensions in the region have also helped USD/JPY paint a fairly constructive short-term technical picture this week, with a series of higher daily lows. Depending on Sunday's result, USD/JPY may not be it's own on Monday, pushed around by EUR/JPY flows.
Nevertheless, in the bigger picture USD, the technical outlook still looks bearish with the descending trendline coming in at around 110.00, the breakout from last week and resistance anyway. From a technical perspective, USD/JPY would need a couple of daily closes above this area to imply the worst may be over for now.
Support is at yesterday's low and also the 200-DMA, at 108.78. Below here next support is at 108.08.
INDICES
ASX 200
The ASX enjoyed a positive day following on from a frothy Wall Street. The exchange down under got another boost in Asia as resource stocks rallied with copper and iron ore. The Dalian iron ore futures rallying a whopping 7% on the day.
Zooming out to the longer term chart, the ASX continues to trade constructively from a technical perspective. The ascending wedge formation is clear to see on the daily chart.
The ASX enjoys trendline support at 5740 with the 100-DMA at 5711 just behind.
Above, the April highs at 5950 form the top of the wedge and the next longer term resistance.
NIKKEI 225
A constructive week as a weaker Yen has boosted Japan exporter stocks. The Nikkei is closing in on its pivot level, just above, at 18,790 with the 100-DMA above at 19153. Above there we see resistance at 19,355 and then 19,720, which has been a multiple daily high since December.
Support appears at 18,265 followed by the 200-DMA at 18,160.
The Nikkei should be a high-beta to the results in France on early Monday, given its sensitivity to the movements of the Yen.
PRECIOUS METALS AND OIL
No change from this morning's missive which can be found here. Wolves Circle Oil and Gold Ahead of Le Crunch. The chart perspectives are not constructive for precious metals or oil, but we may have to wait until Monday for our answer.
SUMMARY
Asia has remained in a holding pattern as the markets settle down to see if French voters storm The Bastille, or stay 'on message.' Early Monday trading, with its usual much-reduced liquidity at the best of times, should see some volatility. The question will be how orderly or disorderly it will be, and only the French can tell us that. Merci beaucoup et bon weekend..
EUR/JPY Short-Term Bullish Momentum Continues, EUR/GBP Moving Sideways, EUR/CHF Moving Sideways.
EUR/JPY Short-term bullish momentum continues.
EUR/JPY has broken the resistance at 117.43 (23/11/2016 low). Other resistance stands at 122.88 (13/03/0217 high). Major support is given at 114.90 (18/04/2017low).
In the longer term, the technical structure validates a medium-term succession of lower highs and lower lows. As a result, the resistance at 149.78 (08/12/2014 high) has likely marked the end of the rise that started in July 2012. Strong support at 94.12 (24/07/2012 low) looks nonetheless far away.
EUR/GBP Moving sideways.
EUR/GBP is now pausing after unsuccessfully challenged its key support at 0.8304. Resistances for a temporary rebound are given by 0.8400 (intraday high) and 0.8512 (18/04/2017 reaction high). The short-term technical structure is negative as long as the resistance at 0.8596 holds. Expected to show continued weakness.
In the long-term, the pair has largely recovered from recent lows in 2015. The technical structure suggests a growing upside momentum. The pair is trading above from its 200 DMA. Strong resistance can be found at 0.9500 psychological level.
EUR/CHF Moving sideways.
EUR/CHF is in an uptrend as long as the support at 1.0693 (19/04/2017 low and declining trendline) holds. The medium-term pattern suggests us to see continued bearish pressures towards key support that can be found at 1.0623 (24/06/2016 low). Key resistance is given by 1.0720.Expected to see further decline.
In the longer term, the technical structure is mixed. Resistance can be found at 1.1200 (04/02/2015 high). Yet,the ECB's QE programme is likely to cause persistent selling pressures on the euro, which should weigh on EUR/CHF. Supports can be found at 1.0184 (28/01/2015 low) and 1.0082 (27/01/2015 low).
Gold Drifting Towards Support, Silver Breaks Rising Trendline, Crude Oil Weak Bounce.
Gold Drifting towards support.
Gold has faded near the hourly resistance at 1295 (18/04/2017 high), suggesting a pickup in selling pressures. Support can be located 1272 (08/04/2017 low). Another hourly support lies at 1270 (rising trendline). An hourly resistance can now be found at 1295 (range high).
In the long-term, the technical structure suggests that there is a growing upside momentum. A break of 1392 (17/03/2014) is necessary ton confirm it, A major support can be found at 1045 (05/02/2010 low).
Silver Breaks rising trendline.
Silver has broken strong support at 18.16 (rising trendline) indicating further downside risk. Key support is given at 17.78 (10/04/2017 low) then 16.82 (15/03/2017 low). Strong resistance is given at a distance at 19.00 (09/11/2017 high).
In the long-term, the death cross indicates that further downsides are very likely. Resistance is located at 25.11 (28/08/2013 high). Strong support can be found at 11.75 (20/04/2009).
Crude oil Weak bounce.
Crude oil has declined sharply, breaking the support at 50.71, yet now has paused. Support now lies at 49.63 (08/12/2017 low). Resistance for a short-term bounce can be found at 50.71 (old support) and 53.70 (12/04/2017 high).
In the long-term, crude oil has recovered after its sharp decline last year. However, we consider that further weakness are very likely. Strong support lies at 24.82 (13/11/2002) while resistance can now be found at 55.24 (03/01/2017 high).
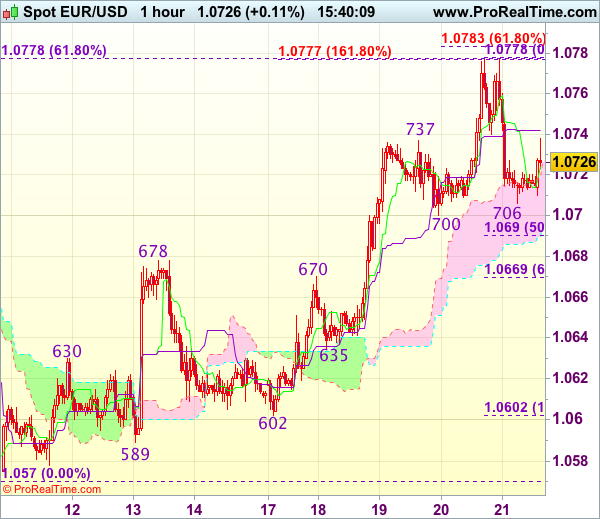
Trade Idea : EUR/USD – Buy at 1.0690
EUR/USD - 1.0725
Most recent candlesticks pattern : N/A
Trend : Near term up
Tenkan-Sen level : 1.0724
Kijun-Sen level : 1.0742
Ichimoku cloud top : 1.0726
Ichimoku cloud bottom : 1.0695
Original strategy :
Buy at 1.0690, Target: 1.0790, Stop: 1.0655
Position : -
Target : -
Stop : -
New strategy :
Buy at 1.0690, Target: 1.0790, Stop: 1.0655
Position : -
Target : -
Stop : -
Euro’s retreat after rising to 1.0778 yesterday suggests a temporary top has been made there and consolidation with mild downside bias is seen for correction to 1.0690-00 (50% Fibonacci retracement of 1.0602-1.0778 and previous support), however, renewed buying interest should emerge there and bring another rise later to 1.0783-85 (61.8% projection of 1.0602-1.0737 measuring from 1.0700), then 1.0800-10 but loss of near term upward momentum should prevent sharp move beyond 1.0825-30, risk from there is seen for a retreat to take place later.
In view of this, would not chase this rise here and would be prudent to buy euro on pullback as 1.0690-00 should limit downside. Only below previous resistance at 1.0670 (now support) would abort and signal top is formed instead, bring correction towards previous support at 1.0635 which is likely to hold from here.
USD/CHF Bouncing Off Support, USD/CAD Consolidating, AUD/USD Failing To Find Demand.
USD/CHF Bouncing off support.
USD/CHF has declined toward the hourly support at 0.9955 (30/03/2017 base low) before bouncing. The short-term technical structure is negative as long as prices remain below the hourly resistance at 1.0171 (07/03/2017). Monitor hourly support is given at 0.9955 (30/03/2017 base low) then 0.9814 (27/03/2017 low).
In the long-term, the pair is still trading in range since 2011 despite some turmoil when the SNB unpegged the CHF. Key support can be found 0.8986 (30/01/2015 low). The technical structure favours nonetheless a long term bullish bias since the unpeg in January 2015
USD/CAD Consolidating
USD/CAD has increased sharply this week. The pair is now consolidating. There is still a strong upside momentum. Resistances can now be found 1.3535 (09/03/2017 high). Hourly support can be located at 1.3456 (04/04/2017 high) then 1.3353 (20/01/2017 high).
In the longer term, there is a golden cross with the 50 dma crossing the 200 dma indicating further upside pressures. Strong resistance is given at 1.4690 (22/01/2016 high). Long-term support can be found at 1.2461 (16/03/2015 low).
AUD/USD Failing to find demand.
AUD/USD is still trying to bounce off strong support at 0.7494. However, as long as prices remain below the resistance at 0.7608 (17/04/2017 high), the short-term technical structure is negative. Key resistance stands at 0.7681 (30/03/2017 high).
In the long-term, we are waiting for further signs that the current downtrend is ending. Key supports stand at 0.6009 (31/10/2008 low) . A break of the key resistance at 0.8295 (15/01/2015 high) is needed to invalidate our long-term bearish view.
EUR/USD Choppy Trading, GBP/USD Consolidation, USD/JPY Grinding Higher.
EUR/USD Choppy trading.
EUR/USD has reversed course. Hourly support can be found at 1.0703 (20/04/2017 base) then 1.0576 (11.04.2017 low). Stronger support can be found at 1.0494 (22/02/2017 low). Key resistance stands at 1.0776 (20/04/2017 high) then 1.0906 (27/03/2017 high).
In the longer term, the death cross late October indicated a further bearish bias. The pair has broken key support given at 1.0458 (16/03/2015 low). Key resistance holds at 1.1714 (24/08/2015 high). Expected to head towards parity.
GBP/USD Consolidation.
GBP/USD has pause after sharp bullish rally. Resistance stands at 1.2953. Monitor the hourly support at 1.2775 (intraday base) as a break would confirm a weakening short-term bullish momentum. Hourly resistance is located at 1.2905 (18/04/2017 reaction high).
The long-term technical pattern is even more negative since the Brexit vote has paved the way for further decline. Long-term support given at 1.0520 (01/03/85) represents a decent target. Long-term resistance is given at 1.5018 (24/06/2015) and would indicate a long-term reversal in the negative trend. Yet, it is very unlikely at the moment.
USD/JPY Grinding higher.
USD/JPY has drifted higher. Hourly resistance stands at 109.10 (18/04/2017 high). Other resistance can be found at 110.11, while a key resistance stands at 112.20 (31/03/2017 high). Next support can be located at 108.22 (17/04/2017 low). Other key supports lie at a distant 106.04 (11/11/2016 low).
We favor a long-term bearish bias. Support is now given at 96.57 (10/08/2013 low). A gradual rise towards the major resistance at 135.15 (01/02/2002 high) seems absolutely unlikely. Expected to decline further support at 93.79 (13/06/2013 low).
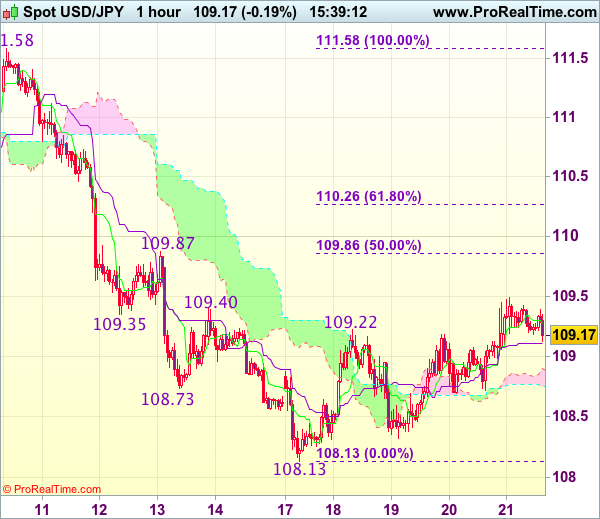
Trade Idea : USD/JPY – Stand aside
USD/JPY - 109.17
Most recent candlesticks pattern : N/A
Trend : Near term down
Tenkan-Sen level : 109.27
Kijun-Sen level : 109.11
Ichimoku cloud top : 108.90
Ichimoku cloud bottom : 108.75
New strategy :
Stand aside
Position : -
Target : -
Stop : -
Although yesterday’s anticipated rebound to 109.49 adds credence to our near term bullish view for the erratic rise from 108.13 to bring retracement of recent decline, reckon upside would be limited to 109.86-87 (50% Fibonacci retracement of 111.58-108.13 and previous resistance), however, price should falter below 110.25-30 (61.8% Fibonacci retracement) and bring retreat later.
In view of this, would not chase this rise here and would be prudent to stand aside for now. Below 108.65-70 would suggest top is formed, bring weakness to 108.30-32, break there would signal the rebound from 108.13 has ended, bring retest of this level first.