Sample Category Title
Investors Take Their Breath Before French Election
EUR holds ground ahead of busy week-end
The Asian session was extremely calm on Friday as traders adjusted their positions ahead of the first round of the French presidential election that will take place on Sunday. The single currency edged slightly higher against most of its peers with the exception (obviously) of the Swiss franc. EUR/CHF was trading sideways at around 1.07.
On the surface, there is no evidence to suggest that the market is worried: the yellow metal is down 0.15%, the Japanese yen edges down 0.05% against the EUR and equities are treading water. However, in the option market it is a complete different story. The 1-week implied volatility (ATM) on EUR/USD hit 18% overnight, compared to 6.37% a week ago. The 1-week 25-delta risk reversal measure (the difference between the volatility of a call and a put) collapsed to -3.90%, indicating that investors rushed to buy insurance against further downside in EUR/USD. The same phenomenon happened to USD/JPY as traders braced themselves for a massive flight to safe-haven in case of pro-business candidates get squeeze out. Indeed, if none of Emmanuel Macron and François Fillon make it to the second round, and assuming that Benoît Hammond is already out, the EUR will take a wild ride. The worst scenario for the euro would be Le Pen and Mélenchon at the second round.
In EUR/USD, the key support stands at around 1.06-1.0630 (previous low and bottom of uptrend channel). Lower, a support can be found at 1.0341 (low from January 3rd). Investors will react violently to a squeeze out of pro-business candidates and we won’t be surprise to see EUR/USD free falling toward the 1.03 threshold. On the other hand, we’ll see a relief rally should Macron or Fillon make it to the second round (a Fillon/Macron second round would be a blessing for the EUR and French bonds). In any case, be ready for some opening gap on Monday morning.
Short JPY
The EURJPY remains the currency to watch for the market view on the French Presidential elections. Recent polls that suggest market friendly Macron has a slight lead gave Euro a boost however, terrorist acts in Paris reintroduced uncertainty (Fillon and Le Pen have suspended campaigning). Developments in European also support our short JPY call. We had anticipated a pullback in USD demand but that downwards correction in USDJPY has outpaced our expectations. We anticipate a recovery to resistance at 112.15. The JPY has been supported less by growing inflation expectations but rather weakening in global risk environment. JPY remains the dominate risk aversion trade above gold, USD and CHF (however, we are not seeing significant JPY buying on fluctuations in French polls). Clearly rising geopolitical worries have caused investors to rotating out of risky asset and into JPY. We suspect tensions have reached a peak and suspect that the historically customary path of diplomacy with takeover. IMM positioning indicates that the JPY is well overbought suggesting room for readjustments. This week BoJ meeting will bring no bring meaningful adjustment to the current strategy as policy board member are likely to shift focus on personal changes rather than monetary policy. Last week the BoJ nominated two very dovish member show support aggressive balance sheet expansion to its committee. For now the realization that the BoJ ¥80trn annual balance sheet expansion was unstable leading to a switch to yields curve control will dictate strategy. While the ECB inches towards tapering and Fed contemplate the next 25bps hike the BoJ policy continue to be the loosest. This strategy should remain supportive of USDJPY.
Yet, it is not the BoJ that will drive USDJPY higher but the reactions of the US economy and interest rate. US economy seems to have slipped into a period of cyclical softness which should organically pick-up in early summer. However, while investors have all but thrown the Trump-reflation trade always there is still the probability that that the Trump administration gets a pro-growth win (tax reform remains the clearest). IMM data indicates that USD is oversold indicating room for additional demand. In addition implied yields on Fed Futures for 2017 are near the lowest they have been in 2017 and 2018 suggesting it would not take much for markets to quickly reprice the pace of Fed interest rates hikes. Sending USDJPY higher.
Daily Technical Analysis: EUR/JPY Could Spike On Renewed Volatility
We have seen this week, that during risk-off as a result of uncertainty from the French elections that Equities has fallen, the JPY has strengthened and the Japanese Trade Balance has fallen. Despite this, PMI data in both the EU and Japan has been solid. Perhaps the EUR has already priced the French election risk, and the JPY has strengthened accordingly. Depending on first election results, we might see renewed volatility and possible spike.
In the wake of the first round of French elections, the EUR/JPY has been bought on dips, although the daily chart still shows a downtrend so this up-move might be just a correction. The POC is 116.20-35 (ATR low, D L4, 50.0) and it is the last POC zone for bulls. Rejection from POC should get the price to 116.80, 117.00 and 117.80 on higher volatility. Breakout should happen only above 117.85. If the price gets below 115.85 (D L5 support), 115.50 might be tested as the last line of defense for bulls. Be careful.
French Elections: Round 1
On Sunday, French citizens are called to elect their government leader, but the final outcome is unlikely to be sealed on that day. According to the opinion polls, there is no candidate gaining the absolute majority, so a second round between the two leading candidates is very likely to be held on the 7th of May.
A couple of weeks ago, the leading candidates were three: Emmanuel Macron, Marine Le Pen, and Francois Fillon. Nevertheless, following a strong performance in the TV debates, left-wing candidate Jean-Luc Melenchon enjoyed a stellar rise of support. His program displays a similar Eurosceptic stance to Le Pen’s. He advocates for holding a 'Frexit' referendum as well. Therefore, a run-off between him and Le Pen seems to be the biggest risk scenario for the financial world.
If something like that takes flesh and bones, we expect the euro to sink as investors will likely price in a much greater risk of European disintegration. A general risk-aversion mood is likely to dominate as well. Safe-havens like the yen are likely to benefit, while equity markets, especially European indices, could take the down road. The other side of the coin is a Macron - Fillon second round. In this case, the opposite market reaction may be observed, as this run-off combination may eliminate the risk for any 'Frexit' referendum.
However, at the moment, polls suggest that the most likely outcome is for Macron and Le Pen to make it to the second round, with the former winning by a large margin. In general, Macron is seen as the winner against any other of the candidates. So if Macron makes it on Sunday, this could cause a market relief and the common currency may open Monday with a gap up. In the less likely scenario of him being kicked out, the only combination that could be seen as relatively pro risk is a Fillon - Le Pen run off, given that polls give the final victory to Fillon. In a Fillon - Melenchon race, Melenchon is preferred.
EUR/JPY is one of the best proxies to play this election in our view. At the time of writing, the pair is trading near the support level of 117.00 (S1). We believe that due to the elections on Sunday, the pair may enjoy a quiet Friday session in the absence of any surprise news. If Sunday’s combination favors a risk-averse mood in the financial community, the pair is possible to tumble and perhaps challenge the psychological territory of 115.00. On the other hand, a pro-risk result could cause the pair to rally and break the downtrend line taken from the peak of the 13th of March. This could be the trigger for a short-term trend reversal.
Of course, much will depend on who gets the first place in the aforementioned combinations, and by how much margin.
As for today’s events:
During the European morning, we get the preliminary Markit manufacturing and services PMIs for April from several European nations and the Eurozone as a whole. Given that investors are likely to be on the edge of their seats for Sunday’s outcome, we don’t expect a major euro reaction from these releases.
In the UK, retail sales are forecast to have fallen somewhat in March, which could cause the pound to erase some of the gains it posted after PM Theresa May called for snap elections.
From Canada, we get CPI data for March. Expectations are for the headline rate to have declined somewhat, while no forecast is available for the core rate. The nation’s Markit manufacturing PMI for the month indicated that manufacturers raised the prices on final products at the steepest rate in three years.
So, although temporary factors may have dragged down the headline rate, the core rate may have remained unchanged or even ticked up, which could prove CAD-positive. USD/CAD could correct back below the 1.3455 (S1) support and perhaps challenge as a support the prior downside resistance line taken from the peak of the 9th of March.
From the US, we get the preliminary Markit manufacturing and services PMIs for April, and existing home sales for March.
We have several speakers at the G20 meeting and the IMF/World Bank conference, including ECB President Mario Draghi and ECB Board member Benoit Coeure.
EUR/JPY
Support: 117.00 (S1), 116.45 (S2), 115.75 (S3)
Resistance: 117.85 (R1), 118.45 (R2), 119.00 (R3)
USD/CAD
Support: 1.3455 (S1), 1.3425 (S2), 1.3345 (S3)
Resistance: 1.3500 (R1), 1.3535 (R2), 1.3600 (R3)
Bank Of England Governor Mark Carney Delivers Speech In Washington
'Brexit will be a litmus test of the future of international cooperation.' - Marc Carney, Bank of England
On Thursday, the Bank of England Governor Marc Carney delivered a speech at the Institute of International Finance in Washington. In his speech, Carney said that financial regulations implemented after the global financial crisis should be able to transform in accordance with unexpected changes. He also stated that the Bank of England would stick to a 'dynamic' approach towards financial regulations, ensuring the global financial system's stability. Meanwhile, in the US, Donald Trump started the process of creating new financial regulations, arguing that financial restrictions are hampering economic growth. Carney also claimed the global financial system was at a 'fork in the road', providing boost to mutual suspicion between regulators. In addition, he highlighted that Britain's withdrawal from the European Union would be a test for cooperation between financial regulators. The BoE Governor said that the Financial Stability Board was working on a revamp of the current financial regulations since the financial crisis, stressing that the FSB do not have the authority to force countries to act in accordance with its view. Back in January, the Congressman Patrick McHenry urged the Fed Chair Janet Yellen to stop cooperating with the FSB, claiming that the FSB's rules run counter to the US interests.
US Manufacturing Activity Drops In April, Initial Jobless Claims Climb 10,000 Last Week
'They have come down from really high levels, but these are still very good, positive readings.' - Michael Trebing, Philadelphia Federal Reserve
US manufacturing activity in the Mid-Atlantic region slowed markedly in April, official figures revealed on Thursday. The Philadelphia Federal Reserve reported its Manufacturing Index dropped to 22.0 in the reported month, following March's reading of 32.8 and falling behind analysts' expectations for a decrease to 25.6 points. Analysts stated that business optimism prompted by Donald Trump's win in the presidential election started to fade, putting downward pressure on business activity. Thursday's data also showed the New Orders Index fell to 27.4 from 38.6 points posted in March, the highest since December 1987. Meanwhile, the six-month business outlook declined to 45.4 from 59.5 points registered in March, the strongest since August 2014. The Price Index dropped to 33.7 from 40.7 points posted in March, the highest since May 2011. On the positive side, the Employment Index rose to 19.9, the strongest since May 2011. Manufacturers also said that they would increase capital spending this year due to expected higher sales. Furthermore, 36.7 of the respondents said that capital spending would take place in the first half of the year. Other data release on Thursday showed initial jobless claims climbed 10,000 to 244,000 last week.
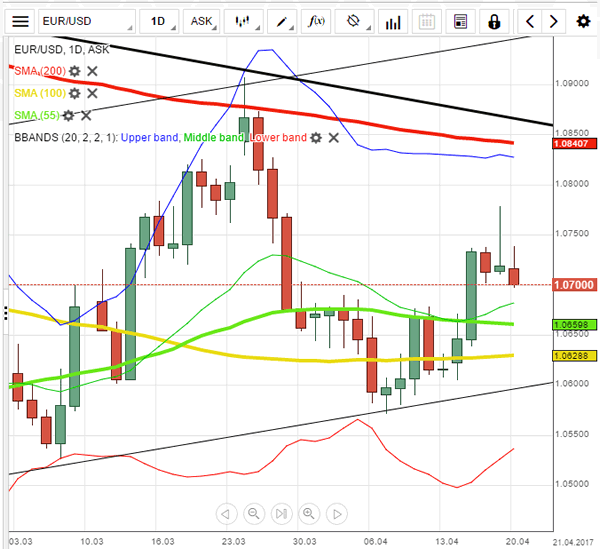
EUR/USD Analysis: Back Below Weekly R2
'Both Le Pen and Melenchon represent a risk for markets, but Melenchon would be more disruptive for the French economy than Le Pen.' – Frederic Leroux, Carmignac Gestion (based on Bloomberg)
Pair's Outlook
On Friday morning the common European currency against the US Dollar traded once more below the weekly R2, which is located at the 1.0729 level. The reason for that is the fact that the resistance put up by the weekly R3 at 1.0780 held its ground on Thursday. It is most likely that large fluctuations in the currency pair would not occur during today's trading session, as the French presidential elections will be held on Sunday. These elections are the main focus now for Euro traders, and the results are sure to cause a fundamental shift in the currency pricing.
Traders' Sentiment
SWFX traders remain bearish, as 54% of open positions are short. In addition, 52% of trader set up orders are to sell the Euro.
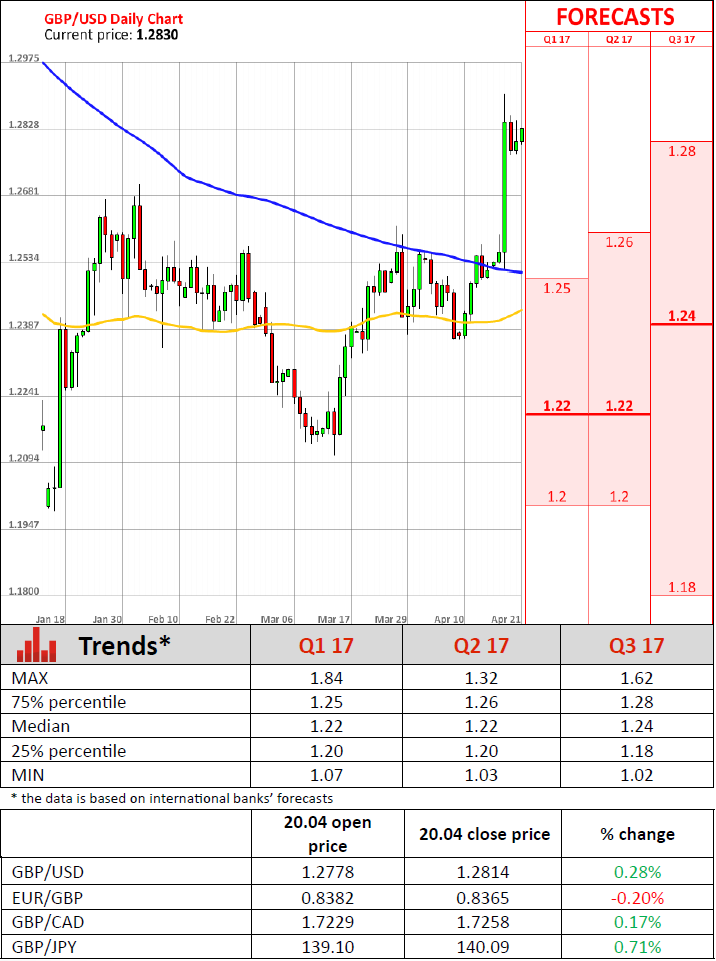
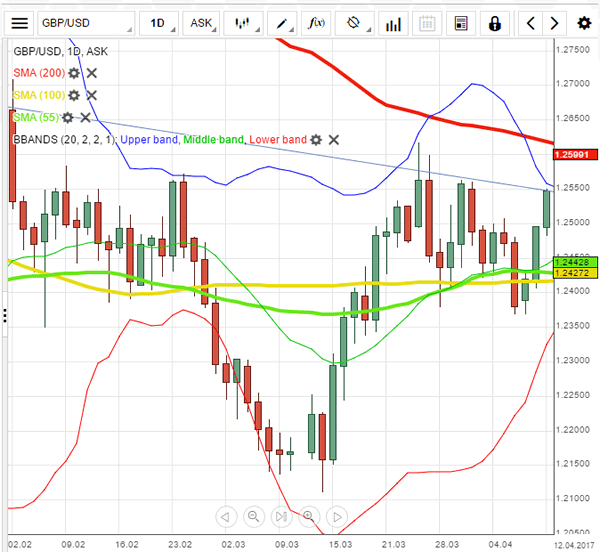
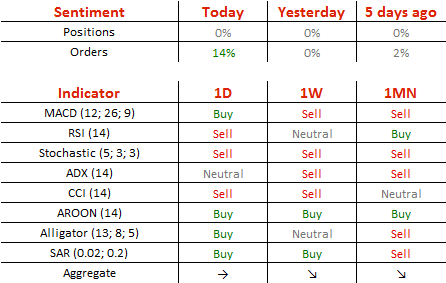
GBP/USD Analysis: In Orbit Around 1.28
'Rising global inflation should have little impact on GBP, we think, since the BoE is not expected to change policy anytime soon.' – Morgan Stanley (based on PoundSterlingLive)
Pair's Outlook
A failure to edge lower on Thursday suggested that the Cable has entered a period of consolidation and is likely to remain within its current trading range today, namely between 1.2750 and 1.29. From a broad technical perspective, another rally is unlikely, due to the weekly R3 and the upper Bollinger band forming resistance just above today's opening price, while the nearest support rests only at 1.2743, represented by the monthly R1. Furthermore, the GBP/USD pair appears to be gravitating towards the 1.28 mark, which also implies another leg down today is more probable. Meanwhile, technical indicators are giving mixed signals in the daily timeframe.
Traders' Sentiment
For the fourth day in a row the bull and the bear ratio remains equal to one. At the same time, the share of buy orders surged from 50 to 57%.
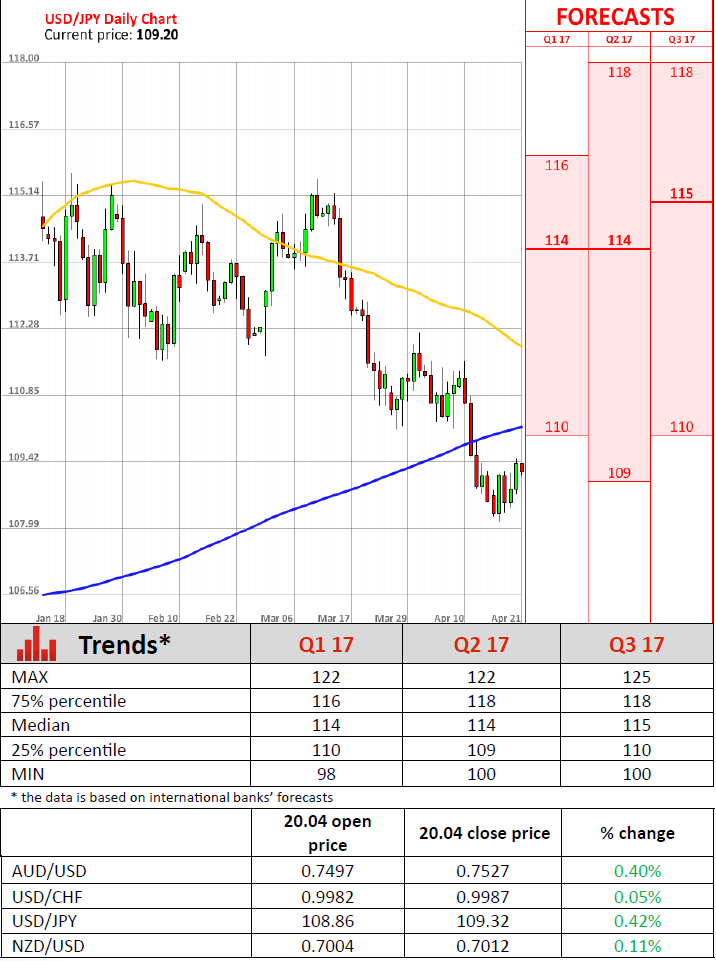
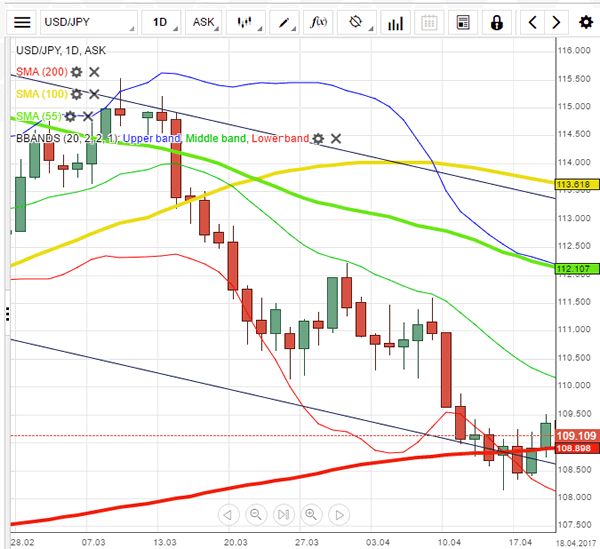
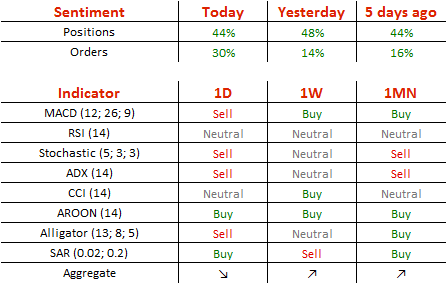
USD/JPY Analysis: Eye On 110.00
'It is too early to expect a sustained rebound and USD is more likely to trade sideways between 108.20 and 109.80 for now even though the immediate bias is for a probe higher towards the top of the expected consolidation range at 109.80.' – UOB Group (based on FXStreet)
Pair's Outlook
The Buck strengthened on Thursday, adding just under 50 pips against the Yen, thus, prolonging the descending channel pattern. The immediate resistance was also pierced, which now turned into supports, bolstering the channel's lower border. According to daily technical indicators, the USD/JPY pair risks experiencing another leg down and could retest the channel's support line. On the other hand, sufficient demand around the 109.00 mark could help the Greenback recover further, but with the 110.00 expected to be the intraday ceiling.
Traders' Sentiment
Bullish traders' sentiment returned to its Wednesday's level of 72%, compared to 74% on Thursday. The portion of orders to acquire the Buck added 8%points. The orders now take up 65% of the market.
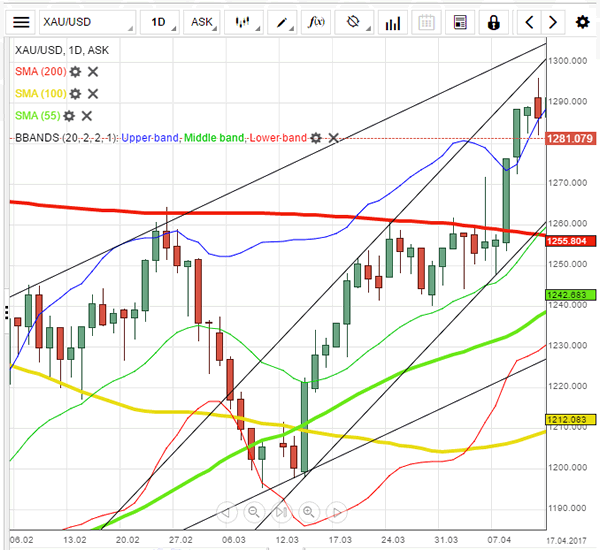
Gold Analysis: Remains Above Retracement Level
'I would expect investors to stay on the fence... they would likely be market-watching rather than market-trading ahead of the French elections on Sunday, especially when there is no clarity.' – Barnabas Gan, OCBC (based on Reuters)
Pair's Outlook
During the early hours of Friday's trading session the yellow metal continued to trade above the 61.80% Fibonacci retracement level, which is located at the 1,278.73 level. The bullion has lost its momentum due to the fact that the markets are expecting the results of the French presidential election on Sunday. Meanwhile, from a technical perspective, a medium term ascending channel's lower trend line had closed in on the commodity price from the downside. The trend line was located at the 1,276.95 level on Friday.
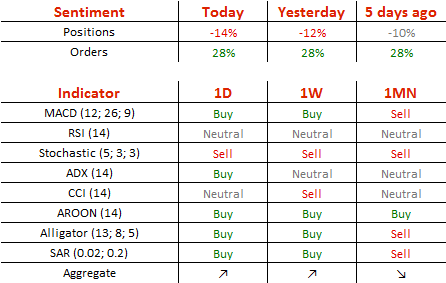
Traders' Sentiment
Traders are shorting the metal, as 57% of open positions are short. However, 64% of trader set up orders are to buy the metal.
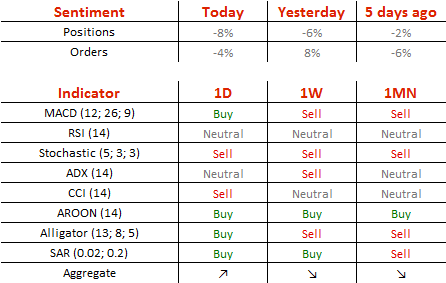
Technical Outlook: GBPUSD – Risk Of Deeper Pullback Exists
Cable is trading in narrowing consolidation under fresh high at 1.2904, with pullback being so far contained 1.2770 (lows of past two days).
Strong bullish sentiment after Tuesday’s surge remains firmly in play and favors further upside, however, extended easing cannot be ruled out as slow stochastic is reversing from overbought territory on daily chart.
Next significant support at 1.2755 (Fibo 38.2% of Tuesday’s rally) should ideally contain, but scenario for deeper dips towards 1.2709 and 1.2663 (50% and 61.8% retracement levels respectively) remains in play.
Weaker than expected UK Retail sales (-1.8% m/m in March vs -0.3% forecast at +1.7% in Feb) may drag the pair lower.
Res: 1.2833, 1.2859, 1.2904, 1.2950
Sup: 1.2770, 1.2755, 1.2709, 1.2663