
Sample Category Title
French PMI Hits 71 Month High
- Sterling remains strong ahead of UK retail data
- NZD unchanged by slip in consumer confidence
- French PMI hits 71 month high
Yet another murderous fanatic has paid the price for his attack on French police but not before he killed one officer and injured others. I guess we must all be grateful we don't understand what would possess someone to take such meaningless violence onto the streets. That's what marks the rest of us out as sane.
New Zealand consumer confidence slipped a little in April but remains at average levels. Most analysts seem to expect the RBNZ to start raising interest rates in the early part of 2018 and not before. The NZ Dollar remains surprisingly strong in spite of that but slowing housing prices in Auckland and elsewhere have taken the shine off consumer optimism.
The French Purchasing Managers' Indices came out much better than expected this morning; in fact the manufacturing sector index is at a 71 month high. We await the German and EU data this morning and the forecasts are good. Perhaps the Euro will pick up some strength from that but nervousness ahead of the 1st round of the French Presidential election will temper any positive-Euro vibe, even though Marine Le Pen has committed to a referendum before taking France out of the Euro.
We'll get the UK retail sales data this morning as well. The markets are looking for a small dip after last month's very positive 1.4% rise. However, improved weather could have tipped the high street sales into a positive figure. Sterling is riding high but struggling to get above solid resistance at €1.20 and $1.30. If those levels were to break though, there is loads of upward momentum due to be unleashed. Any hint of BOE rate hikes would do it and positive consumer activity is a good catalyst for that.
This afternoon brings Canadian inflation data and a little dip from the previous 2.0% level is forecast. The Canadian Dollar has slipped a little of late, in line with US Dollar weakness and in the absence of major commodity rises. Perhaps lower inflation would cause the Canadian Dollar to slip through to C$1.75 against the Pound.
And Happy Birthday Ma'am. It is her Majesty the Queen's 91st Birthday today (the real one, not the procession one) and, may I say you are looking very well on it Your Highness. This is also the day that it is believed Rome was founded, Henry VIII came to the throne, Manfred von Richthofen, 'The Red Baron' was killed and it is the day that Mark Twain (real name Samuel Langhorne Clemens, passed away. One of my favourite Mark Twain quotes is "I am an old man and have known many troubles but most of them never happened," oh and he wrote, 'I didn't attend the funeral but I sent a nice letter saying I approved of it.')
Short Jokes
My new thesaurus is terrible. Not only that but it's also surprisingly circumnavigation.
What is E.T. short for? Because he only has little legs.
What do you call a fake noodle? Impasta.
www.conjunctivitis.com....a site for sore eyes.
A French cheese factory exploded. Des Brie everywhere.
I have a new camera. A nice Chinese couple gave it to me down by Tower Bridge. I couldn't understand what they were saying but they stood together and smiled as I walked away.
EUR Direction Depends On Paris Winner
The dollar has been on the back foot for most of this week on fading hopes that the new Trump administration will not be able to push through fiscal stimulus any time soon.
After the Republicans' failure to repeal the Affordable Care Act last month, investors have been paring their dollar 'reflation' positions, believing that Trump will not be able to deliver on his election promises of tax cuts and infrastructure spend any time soon.
Not helping the dollar bulls is U.S data, it's been perceived as being soft of late – in March, CPI posted its first monthly decline in seven-years, while non-farm payrolls (NFP) also fell short of expectations.
Market focus is firmly on this Sunday's first round of the French election. It's expected to be a two-horse race with Macron handily beating Le Pen in the run-off in a fortnight's time.
1. Stocks get support from Mnuchin comments
In Japan, indices rallied to a two-week high overnight as investors bet that U.S tax reforms are finally gaining traction. U.S Treasury Secretary Mnuchin said the Trump administration will 'very soon' unveil a tax reform plan and expects Congress to approve it this year. The Nikkei 225 gained +1.0% – for the week, it gained +1.6%, posting its first weekly gain in six-weeks, while the broader gained +1.1%.
In Hong Kong, stocks edged lower in thin trading, as investors took to the sidelines ahead of the French presidential election on Sunday. Both the benchmark Hang Seng index and the China Enterprises Index lost -0.1%.
In China, stocks posted their worst week this year as tighter regulatory scrutiny and concerns over the broader economic outlook dampened investors' risk appetite. The blue-chip CSI300 index rose +0.2%, while the Shanghai Composite Index was flat. For the week, the CSI300 was down -0.5%, while the SSEC lost -2.2%.
In Europe, equity indices are trading mixed, but generally lower, as market participants remain cautious after the recent terror attack in Paris. Banking stocks generally higher in the Eurostoxx, while commodity and mining stocks are supporting the FTSE 100.
In the U.S, equities are expected to open in the black (+0.1%).
Indices: Stoxx50 -0.5% at 3,425, FTSE +0.1% at 7,124, DAX flat at 12,025, CAC-40 -0.8% at 5,040, IBEX-35 -0.4% at 10,336, FTSE MIB -0.4% at 19,763, SMI -0.2% at 8,541, S&P 500 Futures +0.1%.
2. Oil dips, on course for biggest weekly drop in a month
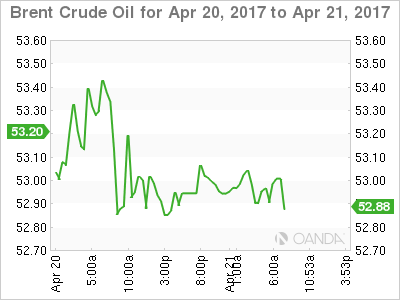
Oil prices are lower ahead of the U.S open and are on course for their biggest weekly drop in a month over doubts that an OPEC-led production cut will restore balance to an oversupplied market.
Brent futures are trading at +$52.87 a barrel, down -12c from yesterday's close and are set for a -5.5%+ weekly drop. U.S light crude (WTI) is at +$50.61 a barrel, down -10c and on course for a -5%+ percent weekly decline.
Despite the Saudi's and Kuwait favouring extending their production limiting deal with non-OPEC member producers into H2, the Russian's have declined to say whether they would adhere to an extension before a joint meeting on May 25.
Not helping with the supply issues is U.S data this week showing that their production numbers have jumped by almost +10% in the past 11-months.
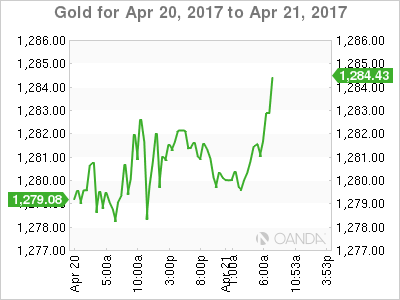
Gold prices are steady (down -0.1% at +$1,280.01 per ounce) with safe-haven demand remaining intact as investors kept an eye on the French presidential vote that is seen as too close to call.
3. ECB to show a steady hand
The ECB meet next week (April 27) and the market expects President Draghi to be playing it safe after the first round of French presidential elections.
The ECB chief is expected to reiterate that the bank is serious about its forward guidance and that policy rates will only go up after the end of its QE program.
Note: Lower French yields imply a more steady-as-she-goes approach to the future.
Heading into Sunday's vote, the yield on 10-year French government debt has hit its weakest level in three-months and the gap between it and its German equivalent has fallen to its tightest in three-weeks.
The yield on U.S 10's has slid -1 bps to +2.23% after a +3 bps advance Thursday. Most other eurozone bond yields are little changed on the day.
4. EUR direction depends on Paris winner
Investors appear to be unwilling to carry too much risk heading into Sunday's Presidential election.
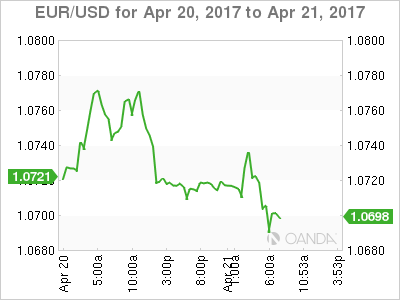
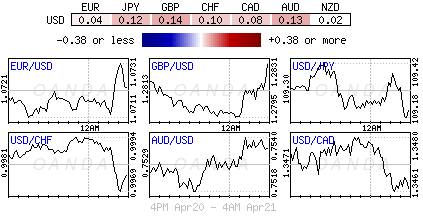
Currently, consensus expects a market-friendly outcome, which should support the EUR (€1.0706) and provide further opportunity to purchase USD/JPY (¥109.14).
Note: The options market continues to see a hefty demand for protection against a sharp EUR move after the vote.
A worst-case scenario for markets would be far-right candidate Le Pen and far-left candidate Melenchon making it to the May 7 vote, but a strong victory for Le Pen would also unsettle markets. Either scenario could see the EUR quickly drop to its 15-year lows atop of €1.0340's. Alternatively, a solid victory for centrist candidate Emmanuel Macron could see it rise to €1.10-1.1200.
The pound (£1.2800) is under pressure from this morning's weak retail sales print (see below).
5. U.K. Retail Sales Drop in March as Inflation Hits Consumers
Data this morning showed that U.K retail sales fell sharply last month, as price increases fuelled by the pound's (£1.2801) sharp post-Brexit vote caused consumers to curb spending.
Sales in March fell by -1.8% m/m, significantly more than the -0.1% fall expected. Compared with March last year, sales rose by +1.7%, again well below expectations.
The U.K's all-important consumer made a negative contribution to the quarterly economic growth for the first time since late 2010 – Sales fell by -1.4% in Q1.
Note: This comes at an awkward time for PM Theresa May, who began divorce proceedings from the E.U in March.
Daily Technical Analysis: EUR/USD Turns Bearish After Hitting 61.8% Fibonacci Target At 1.0775
Currency pair EUR/USD
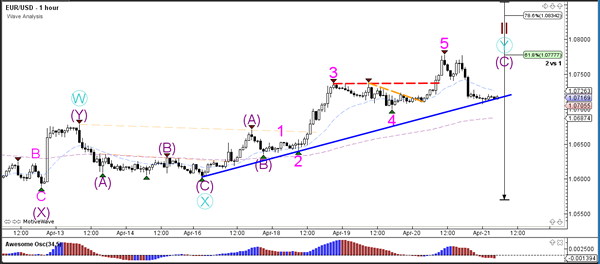
In yesterday's trading the EUR/USD broke above the 50% Fibonacci retracement level of wave 2 (brown) and continued with a bullish push towards the 61.8% Fib at 1.0775. Price stopped at this Fib level and made a bearish retracement, which is now testing the support trend line (blue) – see 1 hour chart.
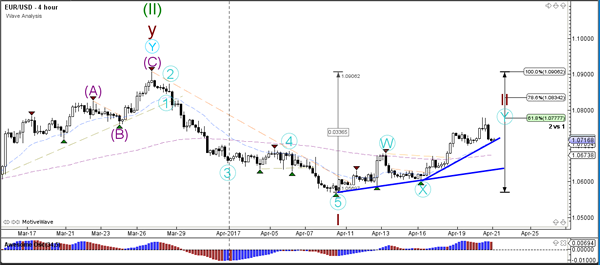
The EUR/USD completed a wave 5 (pink) as expected in yesterday's wave analysis. Price is now at the trend line (blue) which is a bounce or break spot. A bearish break could indicate a first signal that a bearish reversal is occurring.
Currency pair EUR/USD
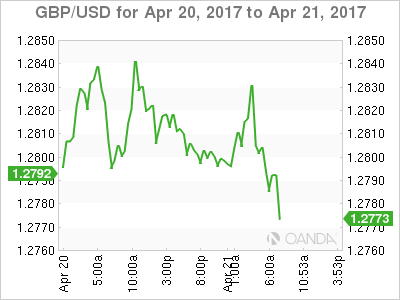
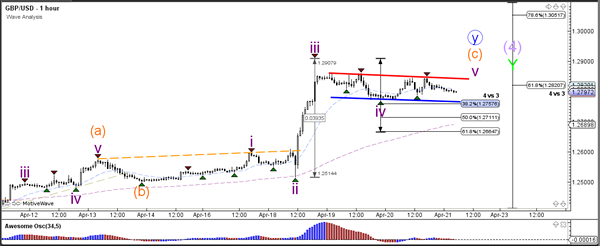
The GBP/USD remains at the 61.8% Fibonacci level of wave 4 (purple). The consolidation zone could indicate a potential reversal or a sideways zone for a new bullish breakout towards the 78.6% Fibonacci level.
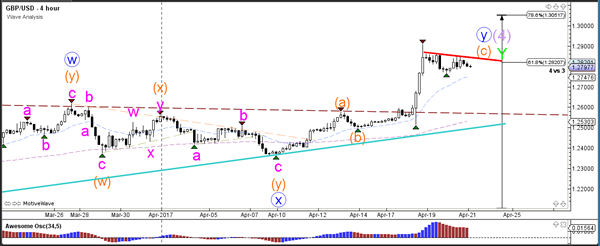
The GBP/USD retracement is a bull flag chart pattern which has reached the 38.2% Fibonacci retracement level at 1.2750. A break below the 61.8% Fibonacci level invalidates wave 4 (purple) where a break above the bull flag (red) could see a wave 5 (purple) develop.
Currency pair USD/JPY
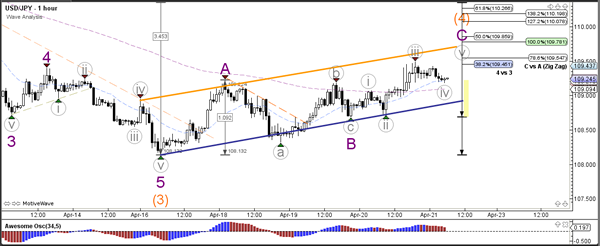
The USD/JPY is building a bear flag chart pattern within a wave 4 correction (orange), which would become invalid if price retraced above the bottom of wave 1 (red line). A break below the bottom of the bull flag (blue) could indicate a bearish breakout and completion of wave 4 (orange).
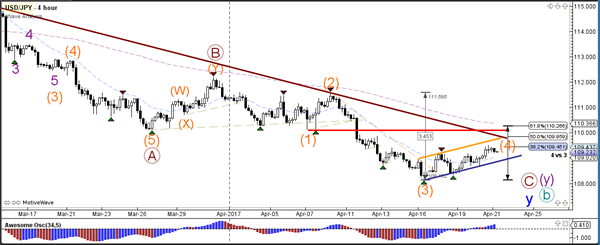
The USD/JPY is building an ABC (purple) zigzag correction towards the Fibonacci levels of wave 4 (orange).
Trade Idea: GBP/USD – Buy at 1.2710
GBP/USD – 1.2779
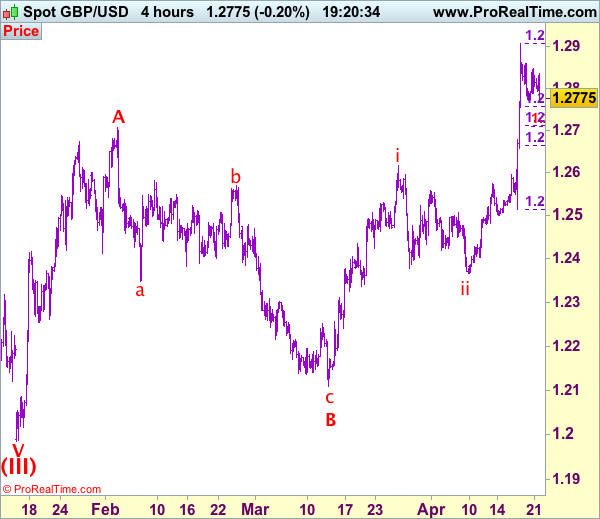
Recent wave: Wave V of larger degree wave (III) has ended at 1.1986 and major correction has commenced from there for gain to 1.3000 and 1.3140-50
Trend: Near term up
Original strategy :
Buy at 1.2750, Target: 1.2950, Stop: 1.2690
Position: -
Target: -
Stop: -
New strategy :
Buy at 1.2710, Target: 1.2910, Stop: 1.2650
Position: -
Target: -
Stop:-
As cable has retreated after faltering below resistance at 1.2847, suggesting another leg of corrective fall from 1.2907 top is underway and weakness to 1.2757 (38.2% Fibonacci retracement of 1.2515-1.2906) is likely, however, reckon 1.2710 (50% Fibonacci retracement as well as 100% projection of a leg from1.2906) would limit downside and bring another rise later, above said resistance at 1.2847 would suggest the pullback from 1.2906 has ended instead, bring further gain to 1.2870, then retest of 1.2906. We are keeping our view that the wave c as well as larger degree wave B has ended at 1.2109, hence impulsive wave C has commenced from there with wave i of C ended at 1.2616, follow by a correction to 1.2365 (end of wave ii) and wave iii rally is unfolding, hence further gain to 1.2940-50 and possibly psychological resistance at 1.3000 would be seen, however, near term overbought condition should limit upside to 1.3050-60.
Our preferred count on the daily chart is that cable's rebound from 1.3500 (wave (A) trough) is unfolding as a wave (B) with A ended at 1.7043, followed by triangle wave B and wave C as well as wave (B) has ended at 1.7192, the subsequent selloff is the larger degree wave (C) which is still unfolding with minor wave (III) of larger degree wave 3 ended at 1.1986, hence wave (IV) correction is in progress which could either be a triangle wave (IV) of a complex formation but upside should be limited to 1.3500 and price should falter well below 1.4000, bring another decline in wave (V) of 3 for weakness to 1.1500, then 1.1200.
On the downside, whilst initial pullback to 1.2750-55 is likely, reckon downside would be limited and 1.2700-10 (50% Fibonacci retracement of 1.2515-1.2906) should contain weakness and bring another rally later. Below 1.2690-00 would defer and risk correction to 1.2660-65 but another previous resistance at 1.2616 (wave i top) should remain intact.
DAX Steady As Investors On Sidelines Ahead Of French Vote
The DAX is showing little movement in the Friday session, trading at 12,039.75. On the release front, there are no major events in the eurozone. German PPI dipped to 0.0%, short of the estimate of 0.2%. German and Eurozone Manufacturing PMIs both beat their estimates, and the Eurozone current account surplus easily beat expectations. On Saturday, US Treasury Secretary Robert Mnuchin will speak at the International Monetary Fund meeting in Washington. On Sunday, France goes to the polls for the first round of the presidential election.
French voters will have their say on Sunday, as France holds the first round of the presidential election. The election campaign has been divisive and turbulent, so perhaps it’s fitting that the four front-runners (in a crowded field of 11) are all within a few percentage points of one another. Given the tightness of the race, final opinion polls have become market-movers. An opinion poll on Thursday showed centrist Emmanuel Macron with 25% of the vote, just ahead of far-right candidate Marie Le Pen with 22%. Le Pen’s platform includes sharp curbs on immigration and a referendum on France’s membership in the European Union. If Le Pen does better than predicted, investor sentiment could sour and send the euro sharply lower. A shooting in Paris on Thursday which killed a policeman and a tourist have stretched taut nerves even further, as security and the terrorism threat remain one of the key issues in the campaign. The markets are expecting more volatility ahead of and following the election, and French banks will be staffed throughout Sunday night in order to respond quickly to developments in the currency markets after the election results.
The eurozone has been improving and this was underscored by strong PMIs out of Europe. Eurozone, French and German PMIs all pointed to expansion in the services and manufacturing sectors. Manufacturing data was particularly encouraging, as Eurozone and German Manufacturing PMIs came in at 56.8 and 56.2 respectively, as both readings beat their estimates. The solid PMIs failed to move the DAX, as cautious investors have headed to the sidelines ahead of the French election on Sunday. There was more positive news as the eurozone’s current account surplus jumped to EUR 37.9 billion, well above the estimate of EUR 26.3 billion.
What’s next for the Federal Reserve? The Fed has broadly hinted that it will gradually raise rates in 2017, but it’s unclear how many times Janet Yellen will press the rate trigger. Most analysts are expecting two more moves this year, but there have been calls from some Fed policymakers for three more hikes. However, soft retail sales and CPI numbers in March are likely to make the Fed more dovish, and on Tuesday, the Atlanta and New York Federal Reserve lowered their outlook for US economic growth for the first quarter. The Fed can point to a labor market that is close to capacity as well as strong consumer confidence, but surprisingly, this has not translated into stronger consumer spending, a key driver of economic growth. Will the Fed raise rates in June? The odds of a June move are showing a surprising amount of volatility, and the latest CME Group reading shows the likelihood a 1/4 point hike have jumped to 58%, up from 45% earlier this week.
Trade Idea: GBP/JPY – Exit long entered at 139.10
GBP/JPY - 139.55
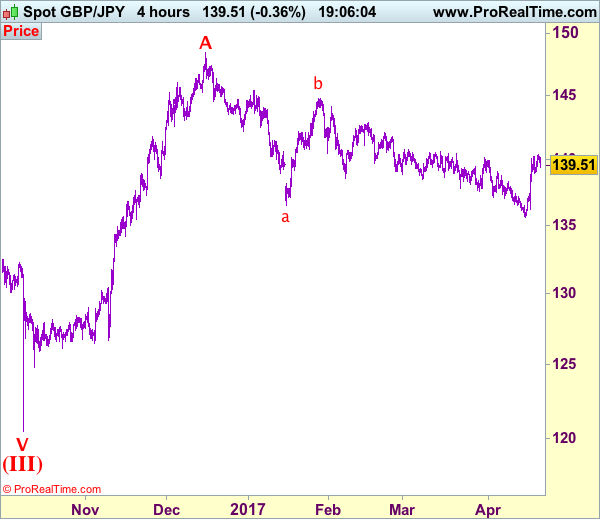
Recent wave: Medium term low formed at 120.50 and (A)-(B)-(C) major correction has commenced with (A) leg ended at 148.45, hence wave (B) is unfolding for retreat to 131.00-10.
Trend: Near term up
Original strategy:
Bought at 139.10, Target: 141.10, Stop: 138.50
Position: - Long at 139.10
Target: - 141.10
Stop: - 138.50
New strategy :
Exit long entered at 139.10,
Position: - Long at 139.10
Target: -
Stop:-
As sterling has retreated after rising to 140.35 yesterday, suggesting consolidation below this level (a minor wave iii) would be seen, hence downside risk is for pullback to 138.75 (38.2% Fibonacci retracement of 136.15-140.35), however, reckon downside would be limited to 138.25 and price should stay well above 137.75-80 (61.8% Fibonacci retracement) and bring another rise later.
In view of this, would be prudent to exit long entered at 139.10 and stand aside for now. Above 140.10-15 would bring retest of 140.35 but break there is needed to extend the rise from 135.60 to 140.75, however, near term overbought condition should limit upside to 141.10-15 and price should falter well below resistance at 141.75.
Our preferred count is that larger degree wave V with circle is unfolding from 251.12 with wave (I) 219.34, (II): 241.38 and wave (III) is subdivided into 1: 192.60, 2: 215.89 (23 Jul 2008) and wave 3 ended at 118.87 earlier in 2009. The correction from there to 162.60 is wave 4 which itself is a double three and is labeled as first a-b-c ended at 151.53, followed by wave x at 139.03, 2nd a ended at 162.60, 2nd b at 146.75 and 2nd c leg of wave 4 ended at 163.00. Therefore, the decline from 163.00 to 116.85 is now treated as wave 5 which also marked the end of larger degree wave (III), hence wave (IV) major correction has commenced for retracement of the wave (III) from 241.38 and upside target at 183.95-00 (50% Fibonacci retracement of the wave (II) from 241.38) had been met, a drop below 160.00 would suggest wave (IV) has ended at 195.85, bring decline in wave (V) for initial weakness to 130 (already met) and 120.
CAC-40, EURJPY The Best Tools For Investors To Track French Elections
How big of a risk is the French election for the markets?
The French election is a major event that has the ability to create serious shock waves across the financial markets. With recent polls showing a fierce four-way battle between four candidates, and millions of French voters still undecided, uncertainty remains a key theme. The growing threat of Eurosceptic parties gaining ground could deal a symbolic blow to the stability of the European Union, which may ultimately spark waves of risk aversion across the board.
Which is the best tool to track French-election market risk? French bonds? CAC-40? Polls?
Investors may turn to the CAC-40 and the EURJPY currency pair to track the French election market risk. Although polls remain a popular choice, they have been have been incorrect in the past and could be proven wrong again; the Brexit shocker and Trump’s presidential victory are prime examples.
Polls are forecasting a very tight race among the main four candidates in Sunday’s first round: how low could EURUSD go in case of a Le Pen vs Mélenchon showdown in the second round?
A Le Pen vs Mélenchon showdown may be a nightmare scenario for the Euro that triggers a sharp Brexit style depreciation. The EURUSD could stumble to near parity as investor jitters mount over a potential Frexit situation and uncertainty over the future of the French economy builds.
And how high could the EURUSD rally if Fillon vs Macron was the outcome of the first round?
The EURUSD could receive a welcome boost in the event of a Fillon vs Macron outcome, since the threat of Eurosceptic parties destabilizing the unity of the Eurozone will be out of the picture. A sharp rally towards 1.09 (and potentially higher) is a possibility, with the trajectory of the EURUSD turning bullish.
Could the French election have a GBP-Brexit-type effect on the EUR?
In the event of a Le Pen vs Mélenchon showdown, the EUR may find itself exposed to extreme downside shocks similar to the GBP-Brexit effect. A Le Pen victory could potentially send larger tremors across the financial markets than Brexit!
Should traders prepare for important gaps in the Euro on the post-election Monday openings?
With uncertainty still a major theme in the French elections, traders should expect the unexpected - and that includes potential gaps in the Euro post-election. Volatility may reach explosive levels, especially if markets are served up a shock election. Investors should keep diligent as gaps could be expected on both the EURUSD and EURJPY.
Where would capital fly in case of a EUR meltdown if there was a Frexit? German bonds? USD? Other currencies?
In the event of a Euro meltdown, the flight to safety may boost attraction for safe-haven investments such as Gold, Dollar and the Japanese Yen. Gold is already supported by the ongoing geopolitical tensions, and a EUR meltdown could inspire bulls to send Gold prices towards $1300 and potentially higher.
Disappointing Retail Sales Pressures Sterling, French Presidential Election Countdown Begins
Sterling attracted a school of sellers during early trading on Friday, following the disappointing 1.8% decline in U.K retail sales in March that rekindled fears of Brexit impacting the U.K economy. U.K retail sales posted their largest quarterly fall in seven years in the first quarter of 2017, as accelerating prices and a Brexit-fueled Sterling selloff pressured consumers. With wage growth lagging behind inflation, concerns may continue to heighten over the longevity of the U.K's prized consumer-driven economic growth. The Pound remains gripped by the Brexit developments as they continue moving forward and heightened political uncertainty created from the snap general election shocker should limit extreme upside gains.
From a technical standpoint, although the sustainability of the Sterling rebound can be questioned, the GBPUSD remains undeniably bullish on the daily timeframe. The decisive breakout above 1.2775 could encourage a further incline higher towards 1.3000.
On the other hand, if the bearish Brexit fundamentals inspire sellers, then repeated weakness below 1.2775 could open a path lower back towards 1.2600.
French presidential election countdown begins
The French presidential elections remain a major event risk that has the ability to send serious shockwaves across the financial markets. With recent polls indicating a fierce battle between the four candidates in the first round and millions of voters still undecided, uncertainty remains the name of the game. Although Emmanuel Macron has been labelled as favorite to become the next French President, an unexpected Marine Le Pen victory could deal a symbolic blow to the unity of the European Union and ultimately create a tidal wave of risk aversion. Investors should remain diligent as we enter the weekend, and be prepared to expect the unexpected when dealing with the elections' repercussions on the Euro.
From a technical standpoint, the EURUSD has struggled to close above the 1.0750 level, with pre-election jitters exposing the Euro to downside risks. If anxiety continues to heighten, then Euro bears may be inspired to send prices lower towards 1.06850 or lower.
Commodity spotlight – Gold
Jitters surrounding the forthcoming French presidential elections and the ongoing tensions engulfing North Korea have supported Gold this week, with prices balancing around $1280 as of writing. Risk aversion remains rife amid the political risk, with uncertainty accelerating the flight to safe haven investments. Bulls remain in control on the daily charts and the decreased probability of a U.S interest rate increase in June could provide a foundation for buyers to attack. If the mounting concerns over Trump's ability to push through with fiscal spending continue to pressure the Dollar further, then Gold may target $1300 and potentially higher. Much attention will also be directed towards the French elections this weekend and could spark a wave of risk aversion if the results of the first round rekindle Frexit concerns. From a technical standpoint, Gold bulls remain in control above $1260, with $1300 acting as the next key level of interest
Technical Outlook: Oil Price Remains Under Pressure But May Extend Consolidation While Above Psychological $50.00 Support
US oil is on track for strong bearish weekly close (the first one after three weeks in green) signaling extension of pullback from $53.74 high, posted on 12 Apr.
The price found temporary footstep at $50.06, low of Wednesday’s strong fall, with downside being reinforced by daily Kijun-sen line, currently at $50.40.
Yesterday’s close below thin daily cloud maintains bearish pressure, however, oil price may hold in extended consolidation while above $50.06 low.
Limited upside attempts are expected, with daily cloud (spanned between $50.74 and $51.15) offering initial resistance and extended upticks expected to hold below daily Tenkan-sen line at $51.90.
Eventual break below psychological $50.00 support would open immediate target at $49.62 (Fibo 61.8% of $47.07/$53.74) and may accelerate to $48.70 (weekly Kijun-sen) in extension.
Oil price remains under pressure on fears that increased US shale oil production may offset OPEC attempts to support prices by reducing oil production.
Res: 50.74, 51.15, 51.36, 51.90
Sup: 50.40, 50.06, 49.62, 48.70
Market Update – European Session: UK Retail Sales Miss Expectations
EU Mid-Market Update: Major European Manufacturing PMIs remain at multi-year highs; UK retail sales miss expectations
Notes/Observations
Major European Apr PMI Manufacturing data beats expectations to multi-year highs
ISIS claims responsibility for Paris shooting on eve of 1st round of Presidential election (6th terrorist attack in last three years)
The market likely unwilling to take on much risk ahead of French elections
US Congress returns from its spring break on Monday; has only a few days to resolve the debt ceiling issue before the current continuing resolution expires
Overnight:
Asia:
BOJ's Kuroda reiterated view to continue to pursue powerful easing until 2% inflation target achieved. Believe Japan had gained the global community's understanding when we say we do not target currency when guiding monetary policy. No comment on President Trump's remark that the USD was too strong; cautioned against unwinding free trade
Japan Fin Min Aso: No issue with US President Trump's comments that USD was too strong; Discussed Japan efforts to raise potential growth rate and global economy at recent G20
Europe:
Police responded to shots fired near Champs Elysee in Paris, France; one policeman killed with several others wounded. Gunman subsequently shot dead by French police; Islamic State claimed responsibility for attack
German Bundesbank's Dombret (ECB SSM member): Germany surplus was not Germany's fault. Situation could not be controlled as country did not have its own currency
Americas:
Treasury Sec Mnuchin: Tax reform will be passed before end of 2017; will put forward a sweeping plan very soon; Infrastructure remains a big priority
Economic Data
(NO) Norway Mar Trade Balance (NOK): 22.7B v 23.5B prior
(NO) Norway Q1 Industrial Confidence: +1.1 v -0.2 prior
(NL) Netherlands Mar House Price Index M/M: 1.1% v 0.3% prior; Y/Y: 7.3 v 6.7% prior
(FR) France Apr Preliminary Manufacturing PMI (beat): 55.1 v 53.1e (7th month of expansion and and highest since Apr 2011), Services PMI: 57.7 v 57.0e, Composite PMI: 57.4 v 56.2e
(ES) Spain Feb Trade Balance: No est v -€3.1B prior
(DE) Germany Apr Preliminary Manufacturing PMI (beat): 58.2 v 58.0e (just off 6-year highs), Services PMI: 54.7 v 55.5e, Composite PMI: 56.3 v 56.8e
04:00 (EU) Euro Zone Apr Preliminary Manufacturing PMI: 56.8 v 56.0e (46th month of expansion and highest since Apr 2011), Services PMI: 56.2 v 55.9e, Composite PMI: 56.7 v 56.4e
(EU) Euro Zone Feb Current Account (Seasonally Adj): €37.9B v €26.1B prior; Current Account NSA (unadj): €27.9B v €3.1B prior
(UK) Mar Retail Sales (Ex Auto Fuel) M/M: -1.5% v -0.5%e; Y/Y: 2.6% v 3.8%e
(UK) Mar Retail Sales(Including Auto/Fuel) M/M: -1.8% v -0.5%e; Y/Y: 1.7% v 3.3%e
(HK) Hong Kong Mar CPI Composite Y/Y: 0.5% v 0.5%e
(HK) Hong Kong Mar Unemployment Rate: 3.2% v 3.3%e
Fixed Income Issuance:
(IN) India sold total INR150B vs. INR150B indicated in 2024, 2029, 2033 and 2051 bonds
SPEAKERS/FIXED INCOME/FX/COMMODITIES/ERRATUM
Index snapshot (as of 10:00 GMT)
Indices [Stoxx50 -0.5% at 3,425, FTSE +0.1% at 7,124, DAX flat at 12,025, CAC-40 -0.8% at 5,040, IBEX-35 -0.4% at 10,336, FTSE MIB -0.4% at 19,763, SMI -0.2% at 8,541, S&P 500 Futures +0.1%]
Market Focal Points/Key Themes: European equity indices are trading mixed but generally lower as market participants remain cautious after the recent terror attack in Paris, and ahead of the highly anticipated first round of the presidential elections in France on Sunday; Banking stocks generally higher in the Eurostoxx with shares of SocGen and BNP Paribas leading the sector gains; shares of Koninklijke Philips also trading notably higher in the index as shares of its spin-off company Philips Lighting reported higher y/y results; shares of Danone the notable laggard in the index despite releasing higher y/y sales results and raising their FY outlook; Commodity and mining stocks trading notably higher in the FTSE 100 as copper prices trade higher intraday; energy stocks in the index trading negative as oil prices consolidate near weekly lows; shares of Reckitt Benckiser the notable laggard in the index after reporting lower than expected LFL sales results.
Upcoming scheduled US earnings (pre-market) include General Electric, Gentex, Honeywell International, Interpublic Group, Kansas City Southern, Manpowergroup, NextEra Energy, Rockwell Collins, Steven Madden, Schlumberger, SunTrust Banks, Stanley Black & Decker, WABCO Holdings, and Webster Financial.
Equities (as of 09:50 GMT)
Consumer Discretionary: [WS Atkins ATK.UK +5.1% (Reached agreement on the terms and conditions on acquisition by SNC-Lavalin for £20.80/shr in cash)]
Consumer Staples: [Danone BN.FR -2.2% (Q1 sales, raises outlook)]
Financials: [Deutsche Bank DBK.DE +0.1% (to pay a penalty of $157M to Federal Reserve for violating forex trading and Volcker)]
Healthcare: [Reckitt Benckiser RB.UK -1.2% (Q1 sales)]
Industrials: [Philips Lighting LIGHT.NL +2.2% (Q1 results), SSAB SSABA.SE +8.8% (Q1 results)]
Technology: [Software SOW.DE +7.0% (prelim Q1 results)]
Speaker
France Presidential candidate Le Pen (Far right): France must immediately reinstate border checks; Expel foreigners who are on the watch lists of intelligence services.
China Foreign Ministry Lu Kang: China and US have improved mutual understanding on North Korea issue. China upholds using dialogue to resolve North Korea issue
Currencies
FX markets were relatively quiet in the session. Market appeared to be unwilling to take on much risk ahead of the French 1st round of the Presidential election. Consensus expect a market-friendly outcome and likely strengthen EUR currency pairs and provide opportunity to buy USD/JPY.
EUR/USD little changed in the session despite better PMI data for the major countries. Pair staying above the 1.07 level and off its multi-week highs registered earlier in the week
GBP/USD was slightly softer after Mar Retail Sales came in below expectations. UK Mar Retail Sales fell steeply fueled by the pound's sharp post-Brexit vote depreciation caused Britons to rein in spending. Pair hovering around 1.28 just ahead of the NY morning.
Fixed Income
Bund futures trade at 162.81 up 7 ticks consolidating below 163 on generally upbeat PMI data out of Germany and France. Futures target support at 162.52 yesterday low initially followed by 162.25. Resistance moves to 163.44 followed by 163.99.
Gilt futures trade at 128.61 up 23 ticks trading towards day highs after weaker than expected March retail sales figures out of the UK. Continuation higher targets yesterday high at 128.66 then 128.76 followed by 129.14. Short Sterling curve is flattening with the fronts flat to up 2bp, with Jun17Jun18 flattening to 9bp choice.
Friday's liquidity report showed Thursday's excess liquidity rose to €1.568T a rise of €2B from €1.566T prior. Use of the marginal lending facility rose to €223M from €206M prior.
Corporate issuance saw no activity yesterday, with issuance for the week just below $24B.
For the week ending April 19th Lipper fund flows reported IG funds net inflows of $1.45B bringing YTD inflows to $43.34B. High yield funds reported out flows of $362.2M bringing YTD outflows of $4.27B.
Looking Ahead
(UR) Ukraine Mar Industrial Production M/M: -2.5%e v -2.2% prior; Y/Y: -1.3%e v -4.6% prior
06:00 (UK) DMO to sell combined £2.0B in 1-month, 3-month and 6-month bills (£0.5B, £0.5B and £1.0B respectively)
06:00 (IE) Ireland Mar PPI M/M: No est v 0.0% prior; Y/Y: No est v 2.4% prior
06:45 (US) Daily Libor Fixing
07:30 (IN) India Weekly Forex Reserves
08:00 (PL) Poland Central Bank (NBP) Apr Minutes
08:15 (UK) Baltic Dry Bulk Index
08:30 (CA) Canada Mar CPI M/M: 0.4%e v 0.2% prior; Y/Y: 1.8%e v 2.0% prior; Consumer Price Index: No est v 129.7 prior
08:30 (CA) Canada Mar CPI Common Core Y/Y: 1.3%e v 1.3% prior; CPI Medium Core Y/Y: No est v 1.9% prior; CPI Trim Core Y/Y: No est v 1.6% prior
09:00 (MX) Mexico Mar Unemployment Rate (Seasonally Adj): 3.5%e v 3.5% prior; Unemployment Rate (unadj): 3.2%e v 3.4% prior
09:45 (US) Apr Preliminary Manufacturing PMI: 53.7e v 53.3 prior, Services PMI: 53.2e v 52.8 prior, Composite PMI: No est v 53.0 prior
10:00 (US) Mar Existing Home Sales: 5.60Me v 5.48M prior
11:00 (EU) Potential sovereign ratings expected after European close:
(NO) Norway Sovereign Debt to be rated by S&P
(PL) Poland Sovereign Debt to be rated by S&P
(EG) Egypt Sovereign Debt to be rated by Moody's
(RO) Romania Sovereign Debt to be rated by Moody's
(CY) Cyprus Sovereign Debt to be rated by Fitch
(IT) Italy Sovereign Debt to be rated by Fitch
(AT) Austria Sovereign Debt to be rated by Canadian rating agency DBRS
(PT) Portugal Sovereign Debt to be rated by Canadian rating agency DBRS
13:00 (US) Weekly Baker Hughes Rig Count data
15:00 (CO) Colombia Feb Economic Activity Index (Monthly GDP) Y/Y: 1.5%e v 1.2% prior