Sample Category Title
Trade Idea Wrap-up: GBP/USD – Buy at 1.2710
GBP/USD - 1.2827
Most recent candlesticks pattern : N/A
Trend : Near term up
Tenkan-Sen level : 1.2817
Kijun-Sen level : 1.2809
Ichimoku cloud top : 1.2775
Ichimoku cloud bottom : 1.2711
Original strategy :
Buy at 1.2710, Target: 1.2850, Stop: 1.2675
Position : -
Target : -
Stop : -
New strategy :
Buy at 1.2710, Target: 1.2850, Stop: 1.2675
Position : -
Target : -
Stop : -
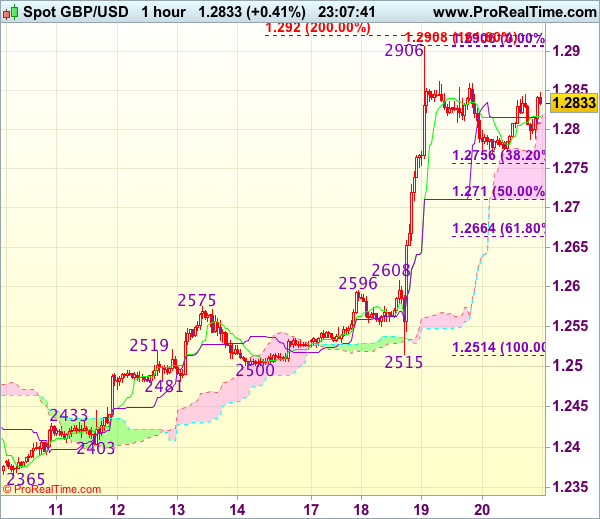
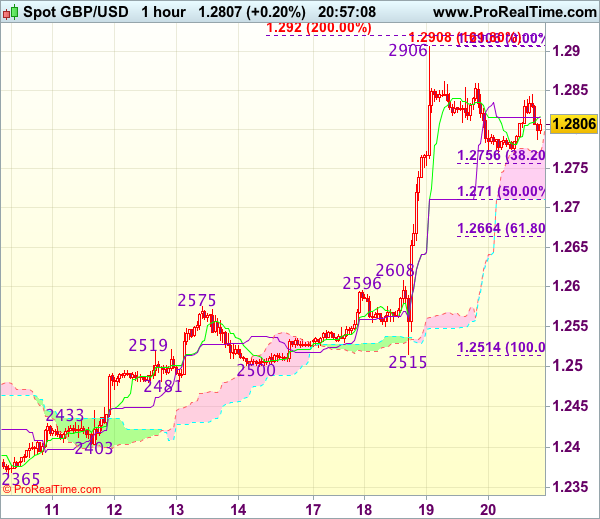
Although cable rebounded after finding support at 1.2770 and gain to 1.2855-60 cannot be ruled out, break there is needed to signal the pullback from 1.2906 has ended, bring retest of this level, break there would extend recent upmove to 1.2920-30 (2 times extension of 1.2365-1.2575 measuring from 1.2500), then 1.2950 but loss of near term upward momentum should prevent sharp move beyond 1.2990-00 (1.236 times projection of 1.2109-1.2616 measuring from 1.2365 and psychological resistance). If said resistance continues to hold, then further consolidation would take place and another retreat to 1.2755-60 (38.2% Fibonacci retracement of 1.2515-1.2906) cannot be ruled out but 1.2700-10 should hold, bring another rally.
In view of this, would not chase this rise here and would be prudent to buy cable on subsequent pullback as downside should be limited to 1.2710 (50% Fibonacci retracement of 1.2515-1.2906), bring another rise. Below 1.2700 would defer and signal top has been formed, risk correction to 1.2660-65 (61.8% Fibonacci retracement of 1.2515-1.2906) and price should stay well above 1.2608-16 (previous resistance now support).
Trade Idea Wrap-up: EUR/USD – Buy at 1.0690
EUR/USD - 1.0768
Most recent candlesticks pattern : N/A
Trend : Near term down
Tenkan-Sen level : 1.0767
Kijun-Sen level : 1.0739
Ichimoku cloud top : 1.0714
Ichimoku cloud bottom : 1.0681
Original strategy :
Buy at 1.0690, Target: 1.0790, Stop: 1.0655
Position : -
Target : -
Stop : -
New strategy :
Buy at 1.0690, Target: 1.0790, Stop: 1.0655
Position : -
Target : -
Stop : -
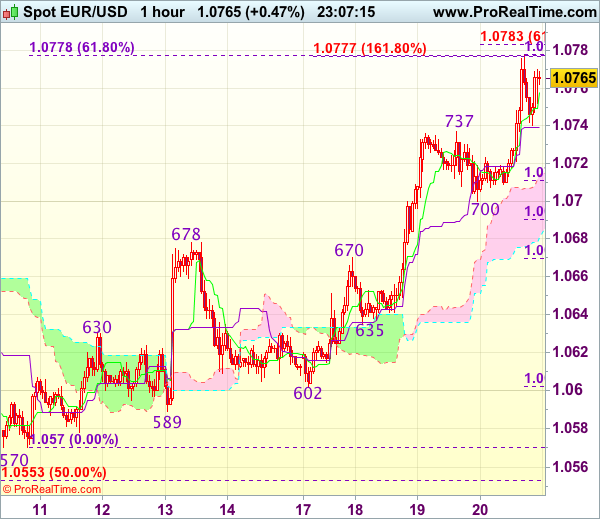
As the single currency has risen again after brief pullback, suggesting recent upmove from 1.0570 is still in progress and upside bias remains for further gain to 1.0783-85 (61.8% projection of 1.0602-1.0737 measuring from 1.0700), then 1.0800-10, however, loss of near term upward momentum should prevent sharp move beyond 1.0825-30, risk from there is seen for a retreat to take place later.
In view of this, would not chase this rise here and would be prudent to buy euro on pullback as 1.0690-00 should limit downside. Only below previous resistance at 1.0670 (now support) would abort and signal top is formed instead, bring correction towards previous support at 1.0635 which is likely to hold from here.
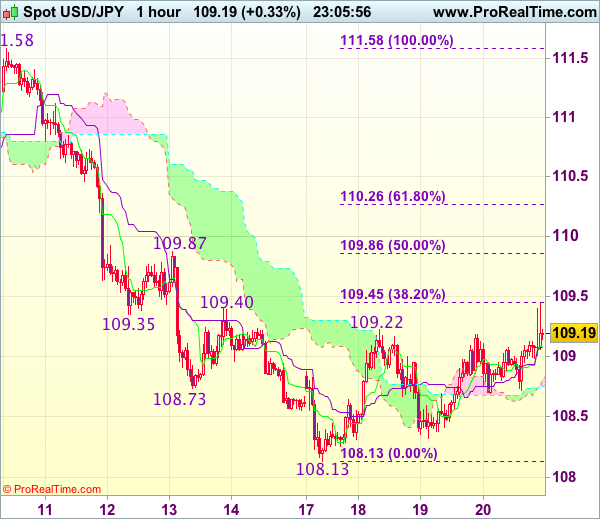
Trade Idea Wrap-up: USD/JPY – Target met and stand aside
USD/JPY - 109.20
Most recent candlesticks pattern : N/A
Trend : Near term down
Tenkan-Sen level : 109.09
Kijun-Sen level : 109.07
Ichimoku cloud top : 108.76
Ichimoku cloud bottom : 108.74
Original strategy :
Bought at 108.45, met target at 109.45
Position : - Long at 108.45
Target : - 109.45
Stop : -
New strategy :
Stand aside
Position : -
Target : -
Stop : -
As the greenback has jumped in US morning, our long position entered at 108.45 met indicated upside target at 109.45 (with 100 points profit), adding credence to our view that temporary low has been formed at 108.13, although consolidation with mild upside bias remains and above 109.45 (38.2% Fibonacci retracement of 111.58-108.13) would bring retracement of recent decline towards 109.86-87 (50% Fibonacci retracement and previous resistance), price should falter below 110.25-30 (61.8% Fibonacci retracement) and bring retreat later.
As we have taken profit on our long position entered at 108.45, would not chase this rise here and would be prudent to stand aside for now. Below 108.65-70 would suggest an intra-day top is formed, bring weakness to 108.30-32, break there would signal the rebound from 108.13 has ended, bring retest of this level first.
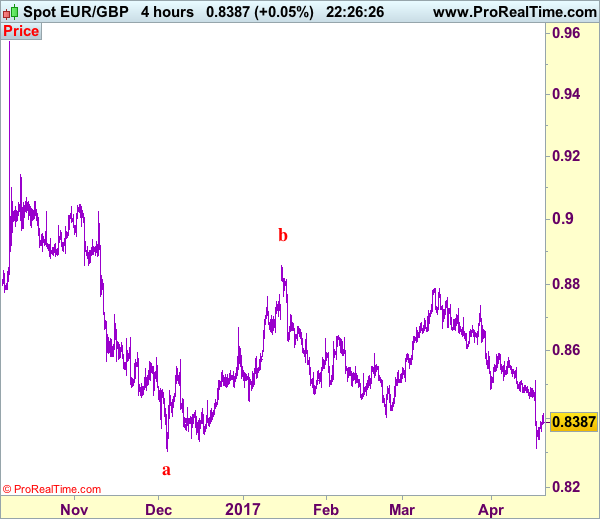
Trade Idea: EUR/GBP – Sell at 0.8475
EUR/GBP - 0.8391
Recent wave: Major double three (A)-(B)-(C)-(X)-(A)-(B)-(C) is unfolding and 2nd (A) has possibly ended at 0.6936.
Trend: Near term down
Original strategy :
Sell at 0.8425, Target: 0.8315, Stop: 0.8465
Position : -
Target : -
Stop : -
New strategy :
Sell at 0.8475, Target: 0.8325, Stop: 0.8515
Position : -
Target : -
Stop : -
As the single currency has rebounded after dropping to 0.8312 earlier this week, suggesting consolidation above this level would be seen and retracement to 0.8440-50 cannot be ruled out, however, reckon 0.8475-80 would limit upside and bring another decline, below 0.8335-40 would bring retest of said support at 0.8312 but break there is needed to signal recent decline from 0.8788 is still in progress and may extend further weakness to 0.8300, then towards 0.8275-80.
In view of this, would not chase this fall here and would be prudent to sell euro on subsequent recovery as 0.8475-80 should limit upside. Only above previous resistance at 0.8512 would abort and signal a temporary low is formed instead, risk a stronger rebound to 0.8545-50 but resistance at 0.8580 should remain intact.
Our preferred count is that, after forming a major top at 0.9805 (wave V), (A)-(B)-(C) correction is unfolding with (A) leg ended at 0.8400 (A: 0.8637, B: 0.9491 and 5-waver C ended at 0.8400. Wave (B) has ended at 0.9413 and impulsive wave (C) has either ended at 0.8067 or may extend one more fall to 0.8000 before prospect of another rally. Current breach of indicated resistance at 0.9043 confirms our view that the (C) leg has ended and bring stronger rebound towards 0.9150/54, then towards 0.9240/50.
Currencies: Sterling Awaiting New Guidance after Recent Rise
Headlines
European equities traded stable near opening levels throughout dealings with France outperforming as investors scaled back worst case scenario bets ahead of this weekend's first presidential election round. US equities opened unchanged.
US eco data slightly disappointed. Weekly jobless claims rose from 234k to 244k (vs 240k expected), but remain near historically low levels. The Philly Fed business outlook declined from 32.8 to 22 in April while a more modest setback to 22 was forecast.
Dallas Fed President Kaplan said he still thinks 3 rate hikes are appropriate this year and advocates starting to wind down the balance sheet at the end of 2017/early 2018. Despite his generally hawkish profile, he said that the neutral rate may be closer to 2% than 3%.
North Korean state media warned the US of a "super-mighty pre-emptive strike" after US Secretary of State Tillerson said the United States was looking at ways to bring pressure to bear on North Korea over its nuclear programme.
Consensus is building towards agreement to extend an OPEC deal to limit output by three to six months as the producer group seeks to achieve its goal of bring down inventory stocks, Saudi Arabia's oil minister al-Falih said.
In the first poll since PM May called the June 8 election the Conservative Party are enjoying a 24% lead. The poll from YouGov, taken between April 18-19, shows voting intentions for the Conservative Party at 48% with Labour second at 24%.
Rates
German 10-yr yield regains 0.2%
Global core bonds worked away overbought conditions today. German Bunds underperformed US Treasuries as investors scaled back safe haven bets ahead of the 1st French presidential election round. French assets were the star performers with both bonds (OAT's) and stocks (CAC40) outperforming. The increase in German yields was disproportional given general risk sentiment (other bourses nearly unchanged; oil prices flat). Yesterday's ECB survey about the malfunctioning of several money markets (as QE creates scarcity of high quality collateral) might still have been in play as well. US eco data (weekly jobless claims, Philly Fed business outlook) were marginally weaker than expected but ignored.
At the time of writing, the German yield curve bear steepens with yields 2.1 bps (2-yr) to 5.2 bps (30-yr) higher. Technically, the German 10-yr yield firmly regained 0.2% support. Changes on the US yield curve ranged between +1.6 bps (2-yr) and +2.5 bps (5-yr), the belly underperforming the wings. On intra-EMU bond markets, 10-yr yield spread changes versus Germany narrowed up to 4 bps for France. Core spreads widened 1 bp.
The French treasury tapped the on the run 3-yr BTAN (€3.43B 0% Feb2020) and 5-yr BTAN (€2.07B 0% May2022). The combined amount sold was the maximum of the targeted €4.5-5.5B range. Demand was lower than usual, but shouldn't surprise ahead of this weekend's presidential elections. The auction bid cover amounted 1.78. Additionally, the French Treasury sold three inflation-linked bonds for a combined €1.25B. The Spanish debt agency tapped the on the run 5-yr Bono (€1.63B 0.4% Apr2022), 10-yr Obligacion (€1.42B 1.5% Apr2027), 30-yr Obligacion (€0.94B 2.9% Oct2046) and off the run Obligacion (€0.99B 6% Jan2029) for a combined €4.97B, in the middle of the eyed €4.5-5.5B range. Demand was plain vanilla with an auction bid cover of 1.61.
Currencies
Euro rebounds going into French elections
The rebound of the euro that started early this week continued. European yields recovered from the recent lows and interest rate differentials narrowed slightly in favour of the single currency. The euro rally petered out later in the session, but EUR/USD (currently 1.0760) still trades in positive territory on a daily basis. We see the move as a positive repositioning of the euro ahead of the first round of the French presidential election. At the same time, the dollar isn't in really good shape. USD/JPY profited only slightly from the rise in core yields. The pair still hovers in the 109 area.
In a daily perspective, EUR/USD hovered in the low 1.07 area in Asia. The euro received a better bid at the start of European trading. The move coincided with a rise in European yields. There were no important data in EMU, but European equities performed quite well given the mediocre performance of US equities yesterday evening. The CAC 40 outperformed. This suggests that European investors are adapting positions for a potential favourable outcome of the first round of the French presidential elections. European core yields rose (albeit slightly) more than their US counterparts. EUR/USD touched an intraday top in the 1.0775 area after which the pair moved sideways.USD eco data (jobless claims and Philly Fed) were slightly softer than expected. The reports had no impact on the dollar.
The swings in USD/JPY were less pronounced than in EUR/USD. The pair dropped briefly to the 108.75 area late in Asia, but soon rebounded supported by a rise in core yields and a decent European equity sentiment. The pair returned to the 109 area and gained slightly further ground (109.30/35 currently) as yields resumed their uptrend during the US session. USD/JPY is trading off the recent lows (108.13) but the performance of the dollar isn't still convincing, given the rise in US/European yields. The picture of EUR/JPY is more constructive. The pair trades in the 117.50 area compared to a correction low below 116 on Monday.
Sterling awaiting new guidance after recent rise
Sterling trading was mostly driven by global moves and technical considerations. There were no UK eco data or other important news. Dollar softness continued to support cable, but the momentum eased as the session continued. The pair currently struggles not to fall back below the 1.28 handle. At the same time, EUR/GBP was supported by the overall euro rebound . EUR/GBP returned to the 0.84 area. For now, there is no big story behind the rise of the euro/European yields. A repositioning/reduction of euro shorts ahead of the French elections is likely. Even so, today's rebound suggests that a break below the key EUR/GBP 0.83 support is difficult. This might a fortiori be the case if this weekend's first round of the French election would turn out market friendly.
Trade Idea: USD/CAD – Buy at 1.3400
USD/CAD - 1.3480
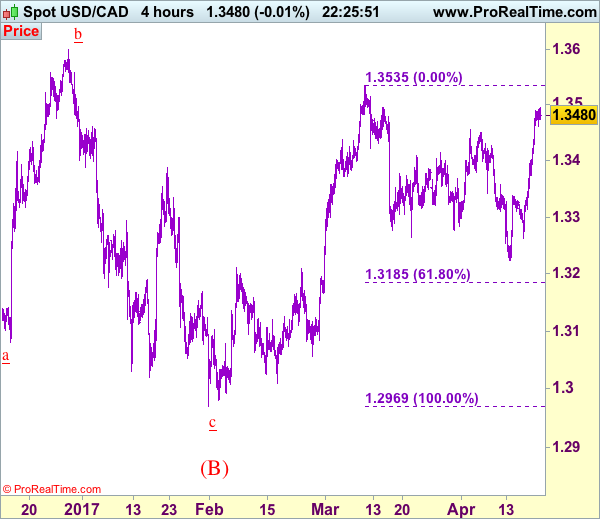
Recent wave: Only wave v of c has ended at 0.9407 and wave C of major A-B-C correction is underway for headway to 1.4700
Trend: Near term up
Original strategy :
Buy at 1.3380, Target: 1.3530, Stop: 1.3320
Position: -
Target: -
Stop: -
New strategy :
Buy at 1.3400, Target: 1.3580, Stop: 1.3340
Position: -
Target: -
Stop:-
The greenback finally penetrated indicated previous resistance at 1.3455, adding credence to our view that the correction from 1.3535 has ended and upside bias remains for the rise from 1.3223 to extend gain to previous resistance at 1.3535, once this level is penetrated, this would confirm early upmove has resumed and extend headway towards previous chart resistance at 1.3599 later which is likely to hold from here.
In view of this, would not chase this rise here and would be prudent to buy on subsequent pullback as 1.3400 should limit downside. Only below previous resistance at 1.3337 would abort and suggest top is possibly formed, risk weakness to 1.3300-10 but indicated support at 1.3262 should remain intact.
To recap, wave B from 1.3066 is unfolding as an a-b-c and is sub-divided as a: 1.2192, b: 1.2716 and wave c is a 5-waver with i: 1.1983, ii: 1.2506, extended wave iii with minor iii at 1.0206, wave iv ended at 1.0781 and wave v as well as wave iii has ended at 0.9931, hence the subsequent choppy trading is the wave iv which is unfolding as (a)-(b)-(c) with (a) leg of iv ended at 1.0854, followed by (b) leg at 1.0108 and (c) leg as well as the wave iv ended at 1.0674. The wave v is sub-divided by minor wave (i): 0.9980, (ii): 1.0374, (iii): 0.9446, (iv): 0.9913 and (v) as well as v has possibly ended at 0.9407, therefore, consolidation with upside bias is seen for major correction, indicated target at 1.3700 and 1.4000 had been met and further gain to 1.4700 would be seen later.
EURJPY a Good Barometer of Fear Heading onto French Election
How big of a risk is the French election for the markets?
The market risk is big and I cannot quantify it. It can be similar to 2011 with the risk of disintegration of Eurozone and the European Union will increase. Additionally, France - UK - US: a new alliance? It could happen.
Which is the best tool to track French election market risk? French bonds? CAC-40? Polls?
In order to track the French election market risk I look at the spread differential between French and German bonds (wider spread = more risk). Also, one could use the barometer of fear - the EUR/JPY (rate goes down = more risk) currency pair.
Polls are forecasting a very tight race among the main four candidates in Sunday's first round: how low could EURUSD go in case of a Le Pen vs Mélenchon showdown in the second round?
It all depends upon how large the advantage of Le Pen would be. If she wins in the first around by an advantage of 5%, the move can be large and the EUR/USD could be targeting 1.03 and even levels below that. If the numbers will be tight, then the movement should not be large as most if it has already been discounted. In case of Melenchon's advantage after the first round, the Euro could shoot towards 1.09.
And how high could the EURUSD rally if Fillon vs Macron was the outcome of the first round?
The main risk factor (Le Pen) will be out of the game so the EUR/USD goes up. Target? 1.09 at first, possible 1.12.
Could the French election have a GBP-Brexit-type effect on the EUR?
It sure can. If Le Pen wins the election, it will put the UK in a good position - another big player and another trading partner. They could join forces against Germany.
Should traders prepare for important gaps in the Euro on the post-election Monday openings?
Oh, yes. How important this upcoming weekend is? Option traders fear the French election outcome more than Brexit. Of course, everybody fears Le Pen. If this happens, the gaps will be large, both on the EUR/USD and the EUR/JPY (even larger)
Where would capital fly in case of a EUR meltdown if there was a Frexit? German bonds? USD? Other currencies?
There are a couple of possibilities that I take into account and those are: JPY and CHF (currencies), US and JPY bonds, gold and silver (commodities). Obviously, volatility will be high but those markets that I have mentioned should experience the largest gains.
Is the European Union "two-speeds" idea good for the EUR in the long-term?
To be honest, it is a logical idea. The European Union will find it difficult to grow having such a large economic discrepancies among countries. The "two-speeds" idea could be a solution. Of course, a very bad solution for smaller countries. Its introduction (of the two-speeds concept) would cause larger delamination, declining solidarity and integrity. All that would cause anger of people and it would not be good for the EUR.
Trade Idea Update: USD/JPY – Hold long entered at 108.45
USD/JPY - 109.10
Original strategy :
Bought at 108.45, Target: 109.45, Stop: 108.30
Position : - Long at 108.45
Target : - 109.45
Stop : - 108.30
New strategy :
Hold long entered at 108.45, Target: 109.45, Stop: 108.65
Position : - Long at 108.45
Target : - 109.45
Stop : - 108.65
As dollar has eased after faltering below indicated resistance at 109.22, suggesting further consolidation would take place, however, reckon downside would be limited to 108.45-50 and bring another bounce to said resistance, break there would add credence to our view that a temporary low has been formed at 108.13, bring retracement of recent decline to 109.40-45 (previous resistance and 38.2% Fibonacci retracement of 111.58-108.13) but reckon upside would be limited to 109.86-87 (50% Fibonacci retracement and previous resistance) and price should falter below 110.25-30 (61.8% Fibonacci retracement), bring retreat later.
In view of this, we are holding on to our long position entered at 108.45. Below 108.30-32 would risk retest of 108.13 support (this week’s low) but break there is needed to signal recent decline has resumed and extend weakness to 107.75-80 later.
Trade Idea Update: USD/CHF – Exit short entered at 1.0000
USD/CHF - 0.9950
Original strategy :
Sold at 1.0000, Target: 0.9900, Stop: 1.0010
Position : - Short at 1.0000
Target : - 0.9900
Stop : - 1.0010
New strategy :
Exit short entered at 1.0000,
Position : - Short at 1.0000
Target : -
Stop : -
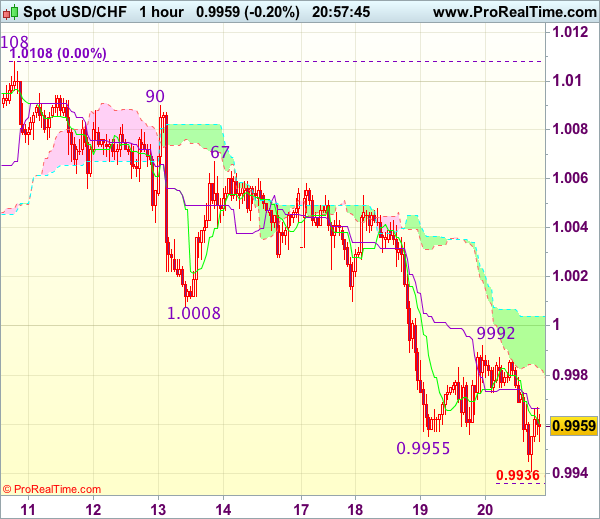
Although the greenback has remained under pressure and mild downside bias remains for recent decline from 1.0108 top to extend weakness to 0.9935-38 (50% projection of 1.0067-0.9955 measuring from 0.9992) and then 0.9926 (61.8% Fibonacci retracement of 0.9813-1.0108) but reckon 0.9900-05 (1.618 times projection of 1.0108-1.0008 measuring from 1.0067) would hold, bring rebound later.
In view of this, would be prudent to exit our short position entered at 1.0000. Above resistance at 0.9992 would suggest low is possibly formed but break of previous support at 1.0008 is needed to add credence to this view, bring a stronger rebound to 1.0020-30.
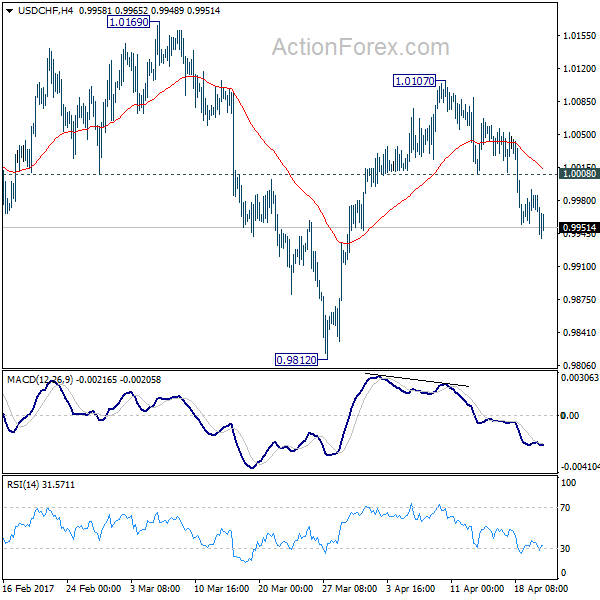
USD/CHF Mid-Day Outlook
Daily Pivots: (S1) 0.9961; (P) 0.9976; (R1) 0.9997; More.....
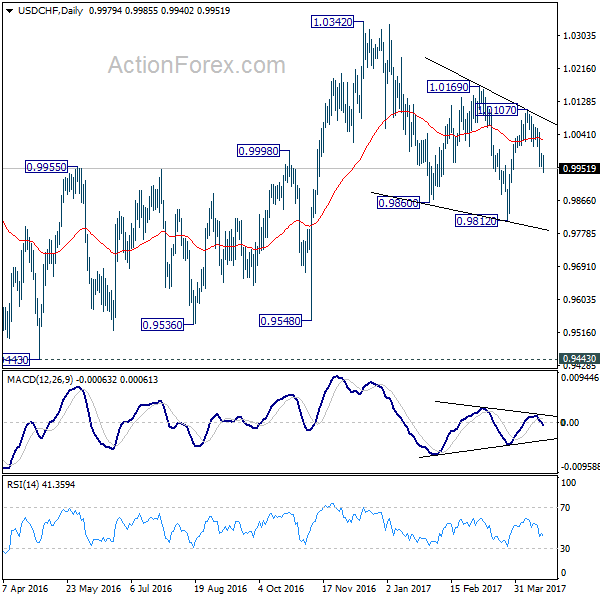
USD/CHF's fall from 1.0107 is still in progress and intraday bias stays on the downside for 0.9812 support. As noted before, correction from 1.0342 is still in progress with another leg started at 1.0107. Break of 0.9812 might be seen. But we'll look for bottoming signal below there. On the upside, above 1.0008 minor resistance will turn bias back to the upside for 1.0107 resistance instead.
In the bigger picture, we're still maintaining that firm break of 1.0342 key resistance is needed to confirm underlying bullish momentum in the cross. However, the corrective nature of the fall from 1.0342 is starting to give the medium term outlook a bullish favor. Hence, in stead of looking for topping signal around 1.0342, we'd now pay closer attention to upside acceleration as USD/CHF approaches this level again.