Sample Category Title
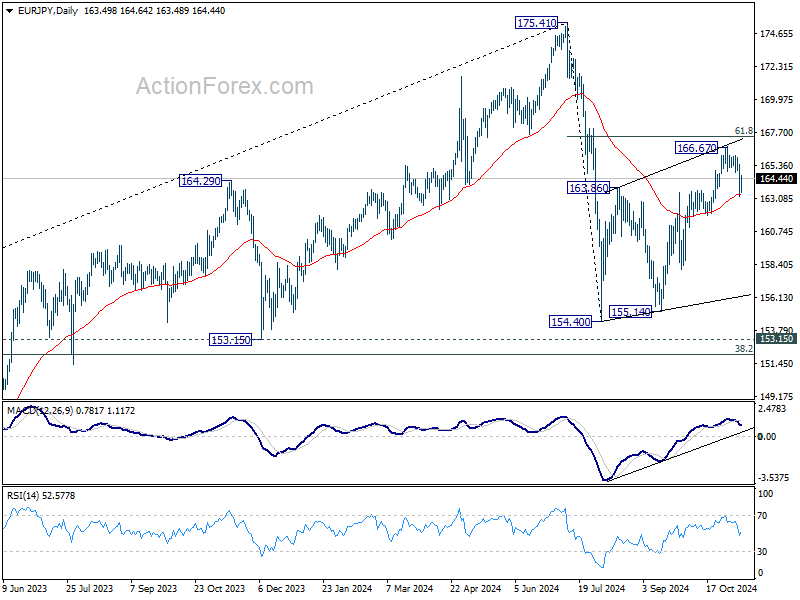
EUR/JPY Daily Outlook
Daily Pivots: (S1) 162.73; (P) 164.07; (R1) 164.94; More....
Intraday bias in EUR/JPY stays on the downside at this point. Fall from 166.67 short term topic could extend lower. Sustained trading below 55 D EMA (now at 163.31) will argue that whole corrective rise from 154.40 has completed with three waves up to 166.67. Deeper decline should then be seen back to 154.40/155.14 support zone. On the upside, break of 166.67 will target 61.8% retracement of 175.41 to 154.40 at 167.38 instead.
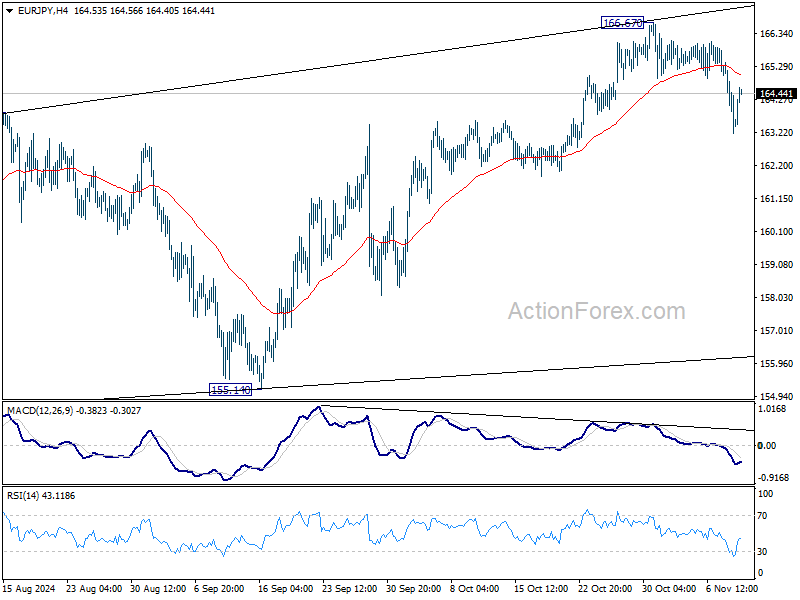
In the bigger picture, price actions from 175.41 are seen as correction to rally from 114.42 (2020 low). The range of consolidation should have been set between 38.2% retracement of 114.42 to 175.41 at 152.11 and 175.41 high. However, decisive break of 152.11 would argue that deeper correction is underway.
EUR/GBP Daily Outlook
Daily Pivots: (S1) 0.8283; (P) 0.8305; (R1) 0.8317; More...
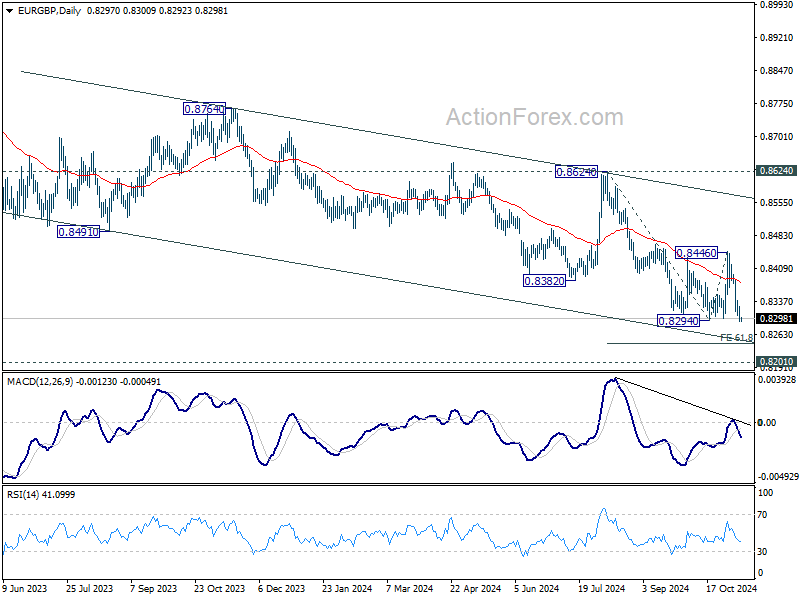
Intraday bias in EUR/GBP remains on the downside as larger down trend is resuming. Next near term target is 61.8% projection of 0.8624 to 0.8294 from 0.8446 at 0.8242. Break there will target 0.8201 key support. On the upside, above 0.8339 minor resistance will turn intraday bias neutral first. But outlook will stay bearish as long as 0.8446 resistance holds, in case of rebound.
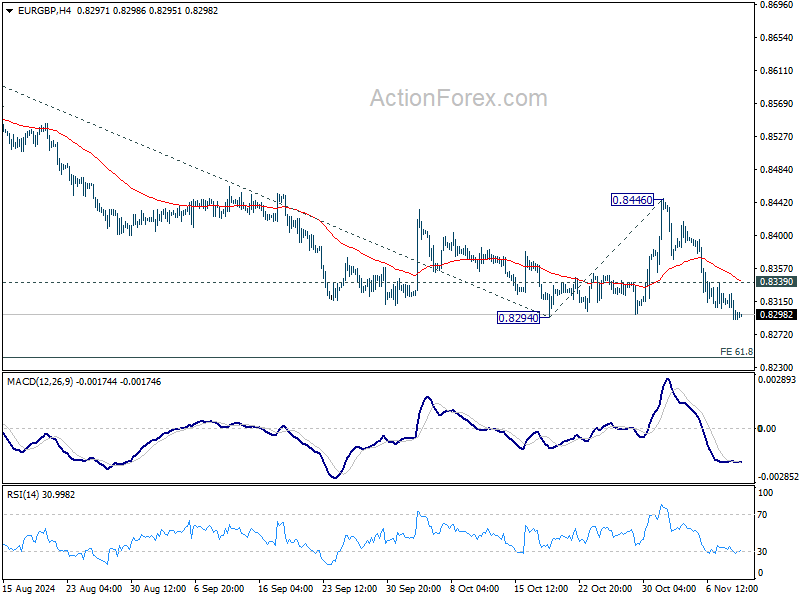
In the bigger picture, down trend from 0.9267 (2022 high) is in progress. Next target is 0.8201 (2022 low), but strong support should be seen there to bring rebound. However, outlook will remain bearish as long as 0.8624 resistance holds even in case of strong rebound. Decisive break of 0.8201 will indicate long term bearish reversal.
EUR/AUD Daily Outlook
Daily Pivots: (S1) 1.6198; (P) 1.6252; (R1) 1.6336; More...
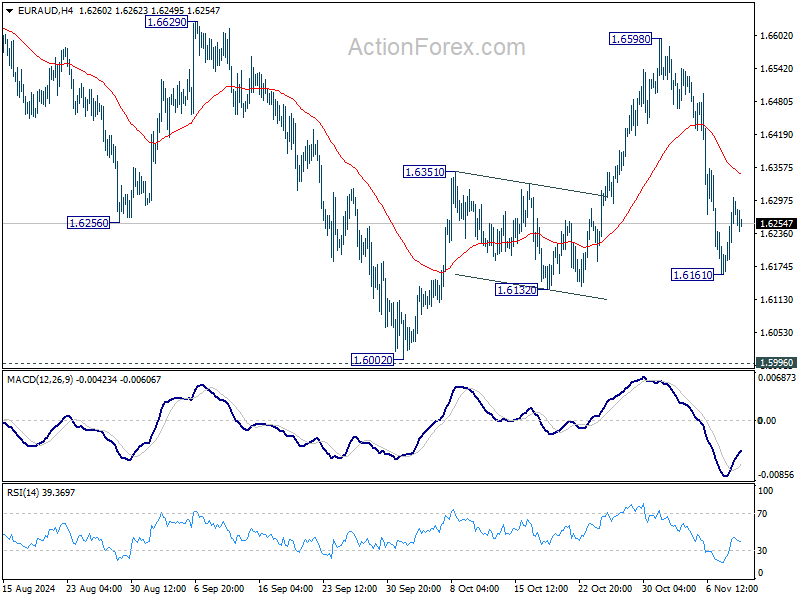
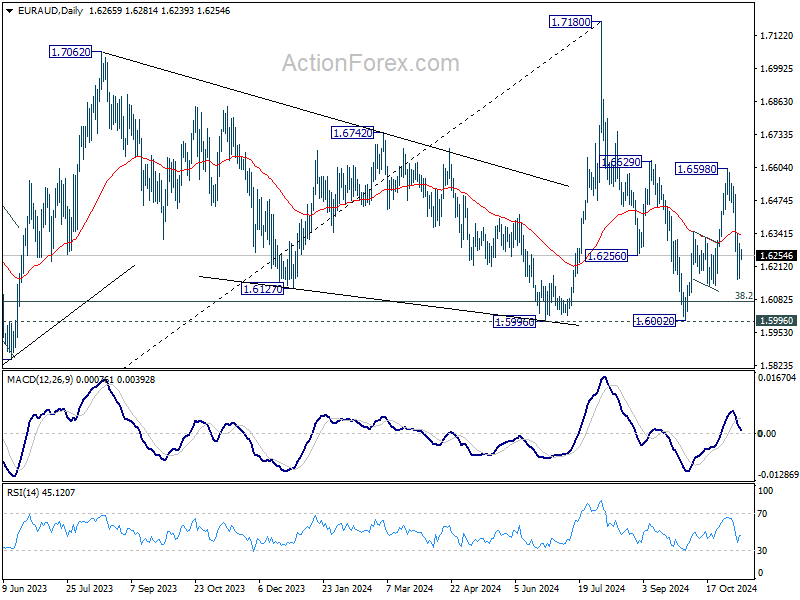
Intraday bias in EUR/AUD Remains neutral for the moment. For now, risk will stay mildly on the downside as long as 1.6598 holds, in case of stronger rebound. On the downside, break of 1.6161 will resume the decline from 1.6590 to target a test on 1.5996/6002 key support zone.
In the bigger picture, as long as 1.5996 cluster support , up trend from 1.4281 (2022 low) is still expected to resume through 1.7180 at a later stage. However decisive break of 1.5996 will argue that the medium term trend might have reversed. Deeper fall would be seen to 61.8% retracement of 1.4281 (2022 low) to 1.7180 at 1.5388, even as a correction.
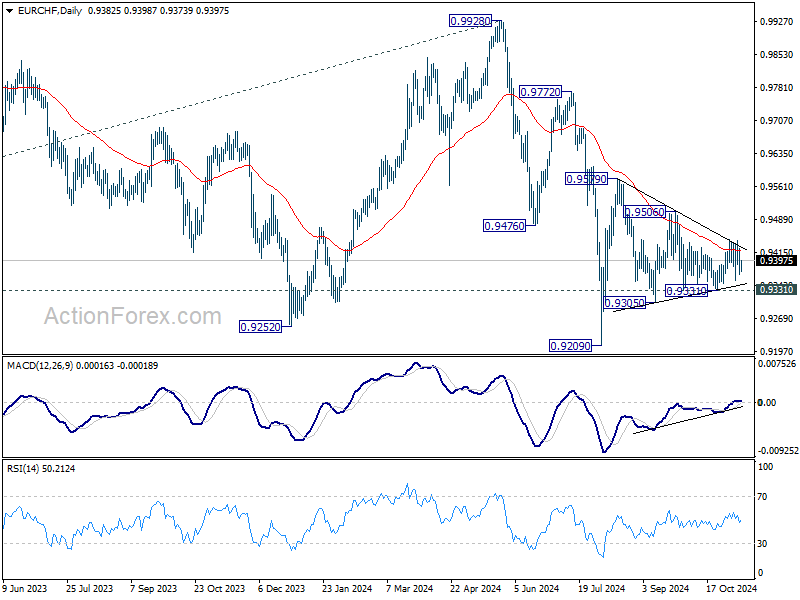
EUR/CHF Daily Outlook
Daily Pivots: (S1) 0.9360; (P) 0.9393; (R1) 0.9420; More....
Intraday bias in EUR/CHF remains neutral as it's staying inside converging triangle. On the downside, break of 0.9331 will target 0.9305 support first. Firm break there will bring retest of 0.9209 low. On the upside, break of 0.9444 will bring stronger rally to 0.9506 resistance next.
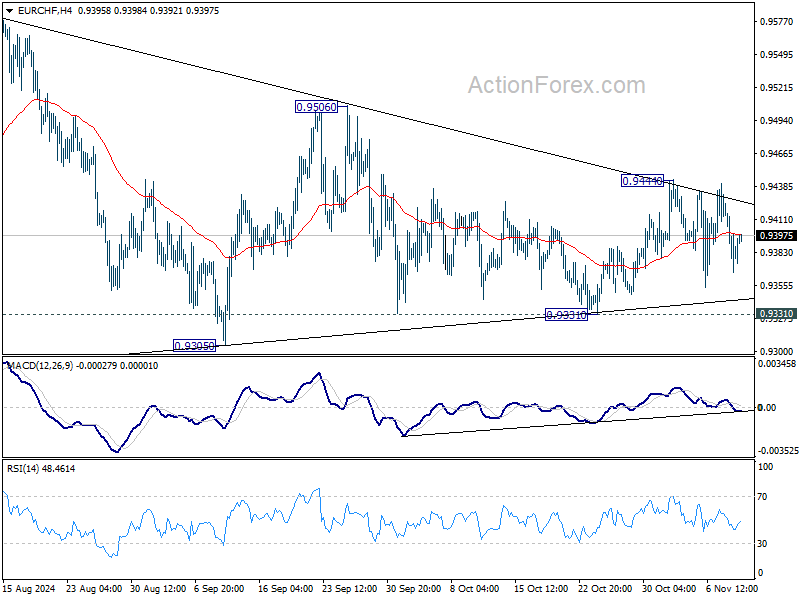
In the bigger picture, fall from 0.9928 is seen as part of the long term down trend. Repeated rejection by 55 D EMA (now at 0.9419) keeps outlook bearish for breaking through 0.9209 low at a later stage. Nevertheless, sustained trading above 55 D EMA will confirm medium term bottoming at 0.9209 and bring stronger rebound back towards 0.9928 key resistance.
SNB’s Martin: Swiss Franc appreciation expected due to inflation differentials
SNB Vice President Antoine Martin conveyed a cautious stance on future monetary policy in an interview with Le Temps.
While SNB indicated at its September meeting the readiness to cut interest rates further, Martin stressed that "it's not useful for central banks to lock themselves into forward-looking communications."
He highlighted that "between now and the next decision, there may be changes in conditions that render current communications invalid," This approach means SNB has made "absolutely no commitment" to a specific policy path.
Addressing the performance of Swiss Franc, Martin noted that its development this year has been "neither particularly surprising nor exceptionally problematic."
He explained that due to the inflation differential between Switzerland and other countries, SNB expects Swiss Franc to "appreciate structurally over time in nominal terms."
However, he pointed out that "in real terms, excluding the inflation effect, the appreciation has been limited."
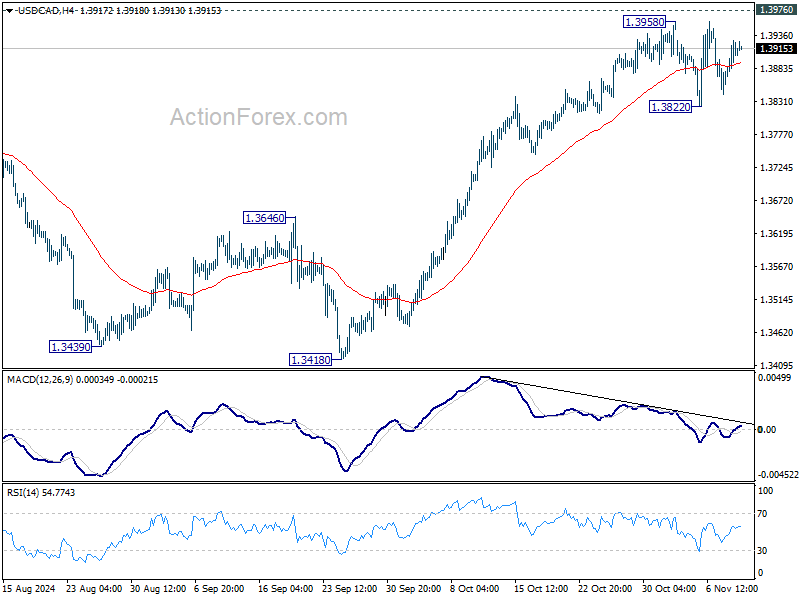
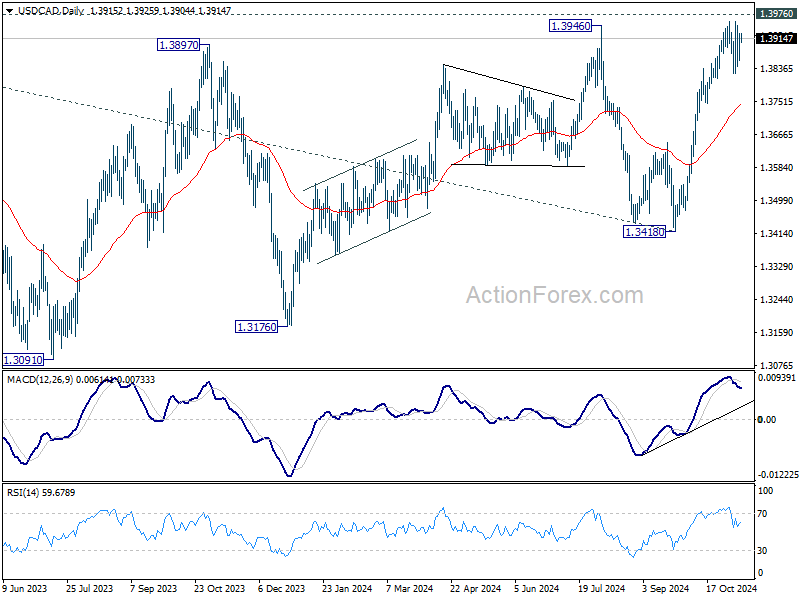
USD/CAD Daily Outlook
Daily Pivots: (S1) 1.3868; (P) 1.3898; (R1) 1.3939; More...
Range trading continues in USD/CAD below 1.3958 and intraday bias remains neutral. Further rally is expected as long as 1.3822 support holds. On the upside, decisive break of 1.3976 key resistance will confirm larger up trend resumption. On the downside break of 1.3822 support will bring deeper pullback towards 55 D EMA (now at 1.3748).
In the bigger picture, sideway consolidation pattern from 1.3976 (2022 high) might still extend further. While another decline cannot be ruled out, strong support should emerge above 1.2947 resistance turned support to bring rebound. Rise from 1.2005 (2021 low) is still in favor to resume at a later stage. Decisive break of 1.3976 will target 61.8% projection of 1.2401 to 1.3976 from 1.3418 at 1.4391.
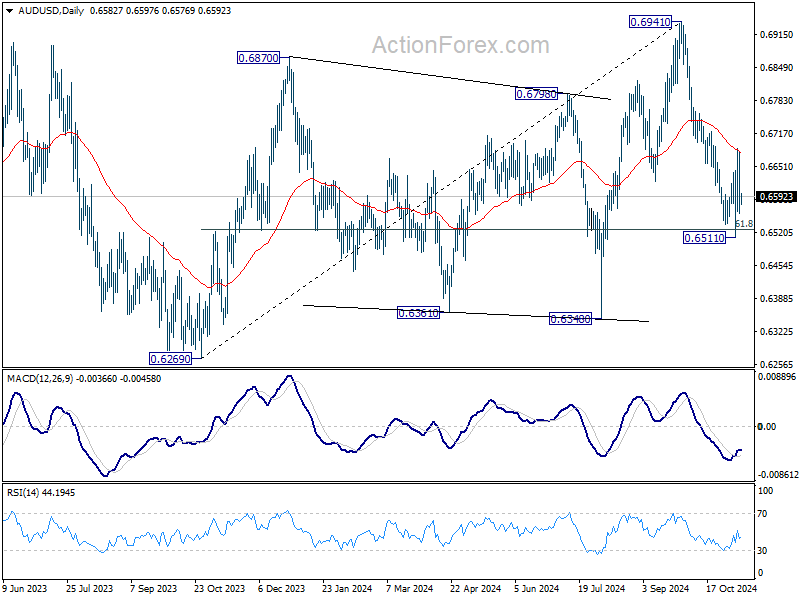
AUD/USD Daily Report
Daily Pivots: (S1) 0.6533; (P) 0.6608; (R1) 0.6657; More...
Intraday bias in AUD/USD remains neutral for the moment. For now, further rise is mildly in favor as long as 0.6551 short term bottom holds. Above 0.6687 will target 61.8% retracement of 0.6941 to 0.6511 at 0.6777. On the downside, break of 0.6511 will resume the fall from 0.6941 instead.
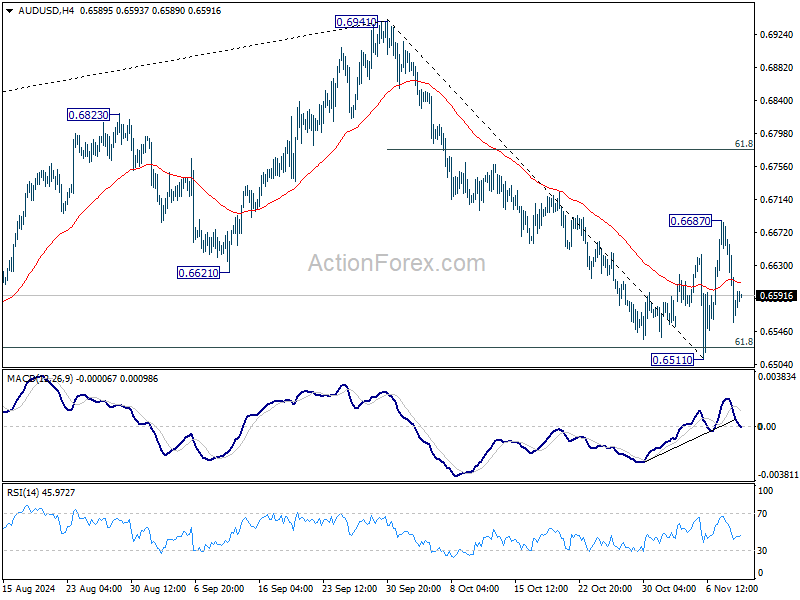
In the bigger picture, rise from 0.6269 (2023 low) should have completed with three waves up to 0.6941. Corrective pattern from 0.6169 (2022 low) is now extending with another falling leg. Deeper decline would be seen back to 0.6269 as sideway trading extends.
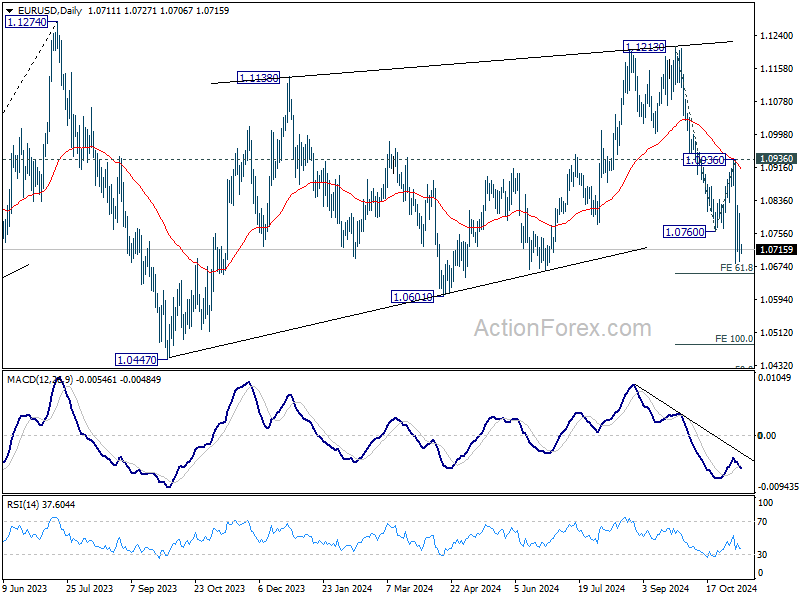
EUR/USD Daily Outlook
Daily Pivots: (S1) 1.0667; (P) 1.0738; (R1) 1.0788; More...
Intraday bias in EUR/USD remains neutral and more consolidations could be seen above 1.0681 temporary low. Outlook will stay bearish as long as 1.0936 resistance holds. Below 1.0681 will resume the fall from 1.1213 and target 61.8% projection of 1.1213 to 1.0760 from 1.0936 at 1.0656, and then 100% projection at 1.0483.
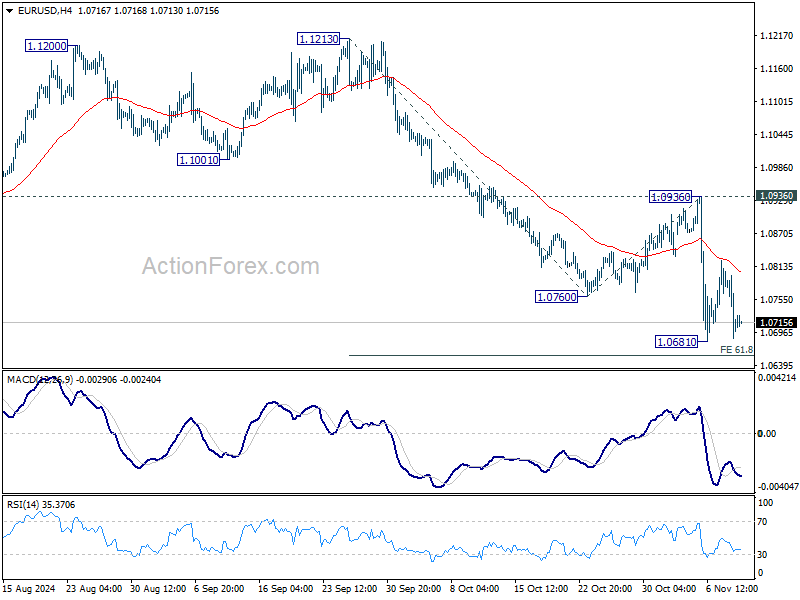
In the bigger picture, price actions from 1.1274 (2023 high) are seen as a consolidation pattern to up trend from 0.9534 (2022 low), with fall from 1.1213 as the third leg. Downside should be contained by 50% retracement of 0.9534 (2022 low) to 1.1274 at 1.0404, to bring up trend resumption at a later stage.
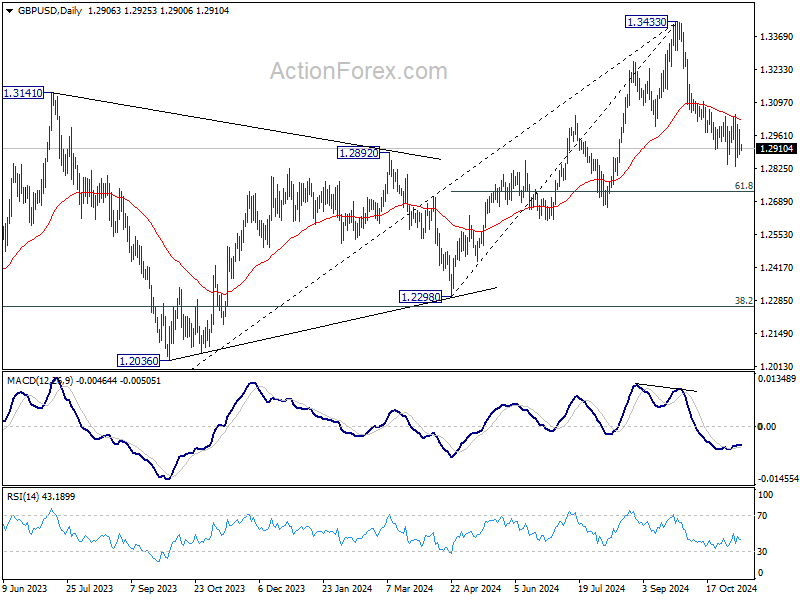
GBP/USD Daily Outlook
Daily Pivots: (S1) 1.2870; (P) 1.2933; (R1) 1.2981; More...
Intraday bias in GBP/USD remains neutral and more consolidations could be seen above 1.2833 temporary low Further decline is expected 1.3047 resistance holds. Break of 1.382 will resume the fall from 1.3433 to 61.8% retracement of 1.2298 to 1.3433 at 1.2732. However, considering bullish convergence condition in 4H MACD, firm break of 1.3047 will indicate short term bottoming, and turn bias back to the upside.
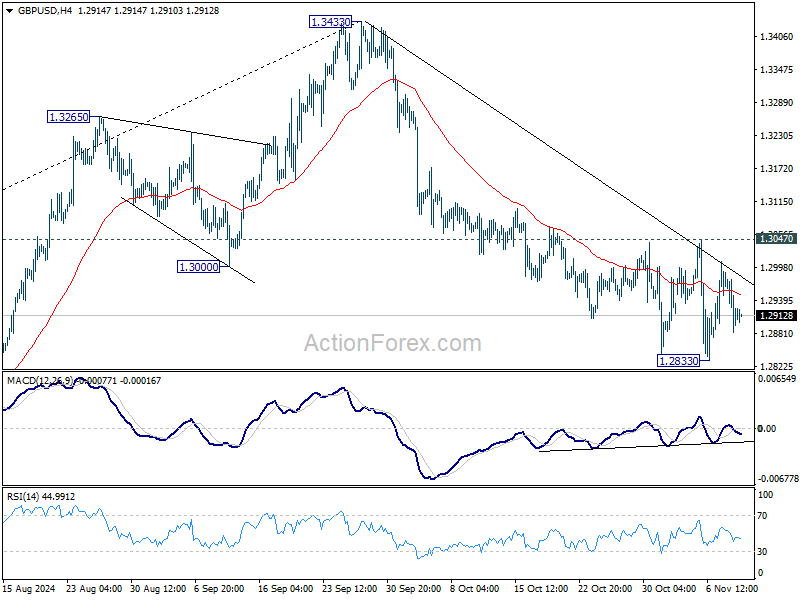
In the bigger picture, considering mildly bearish divergence condition in D MACD, a medium term top is likely in place at 1.3433 already. Price actions from there are seen as correction to whole up trend from 1.0351 (2022 low). Deeper decline would be seen to 38.2% retracement of 1.0351 to 1.3433 at 1.2256, which is close to 1.2298 structural support. Strong support should be seen there to bring rebound.
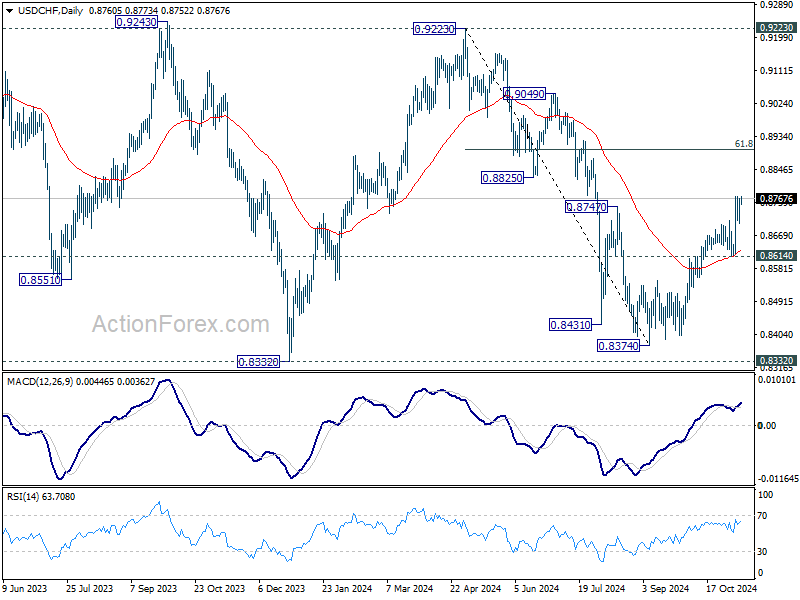
USD/CHF Daily Outlook
Daily Pivots: (S1) 0.8716; (P) 0.8742; (R1) 0.8784; More…
USD/CHF is still bounded in range below 0.8773 and intraday bias stays neutral. Some more consolidations could be seen. But further rally is expected as long as 0.8614 support holds. On the upside, break of 0.8733 will resume the rally from 0.8374 to 61.8% retracement of 0.9223 to 0.8374 at 0.8899 next.
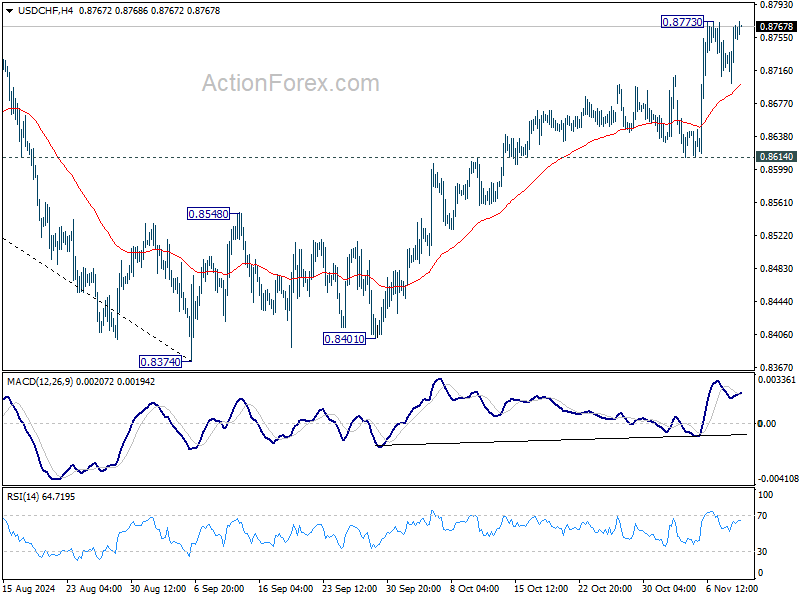
In the bigger picture, price actions from 0.8332 (2023 low) are currently seen as a medium term corrective pattern. Rise from 0.8374 is seen as the third leg. Overall outlook will continue to stay bearish as long as 0.9223 resistance holds. Break of 0.8332 low is in favor at a later stage when the consolidation completes.