Sample Category Title
USD/JPY Daily Outlook
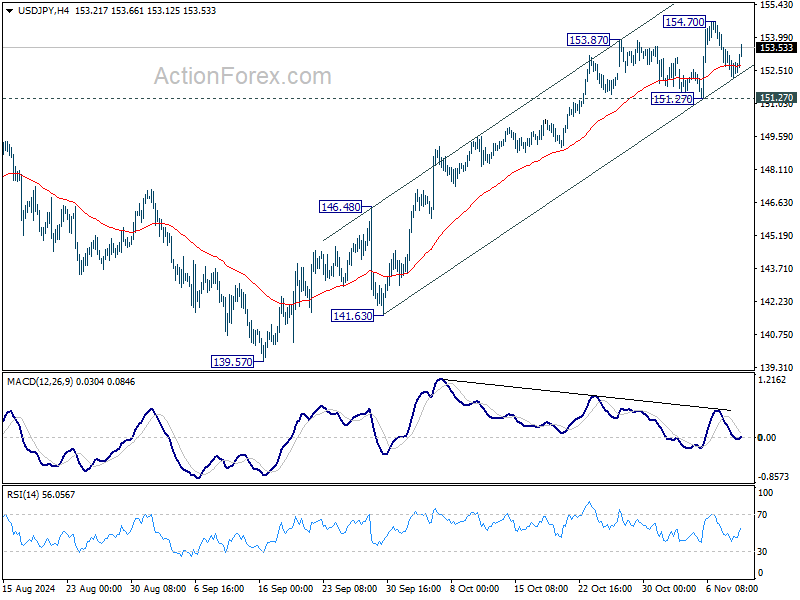
Daily Pivots: (S1) 152.07; (P) 152.72; (R1) 153.30; More...
USD/JPY recovers notably today but stays below 154.70 temporary top. Intraday bias remains neutral at this point. Further rise is expected as long as 151.27 support holds. Above 154.70 will resume the rally from 139.57 towards 161.94 high. However, considering bearish divergence condition in 4H MACD, break of 151.27 will indicate short term topping, and turn bias back to the downside for 55 D EMA (now at 149.74).
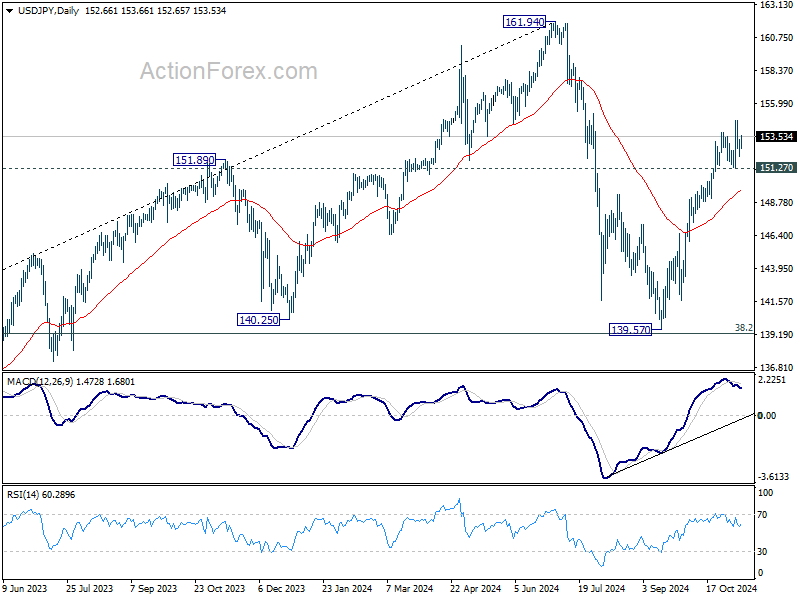
In the bigger picture, price actions from 161.94 are seen as a corrective pattern to rise from 102.58 (2021 low). The range of medium term consolidation should be set between 38.2% retracement of 102.58 to 161.94 at 139.26 and 161.94. Nevertheless, sustained break of 139.26 would open up deeper medium term decline to 61.8% retracement at 125.25.
Yen Pressured by Political Uncertainty and BoJ Rate Hesitation
Yen started the week under notable pressure, facing challenges from both political uncertainty in Japan and a cautious BoJ. A highly anticipated parliamentary vote will decide whether Prime Minister Shigeru Ishiba remains in office. Ishiba's leadership is on the line after his party, the Liberal Democratic Party, lost its majority in a recent snap election. The call for an early election, intended to secure a public mandate, appears to have backfired. If Ishiba fails to secure support, a potential leadership shift could deepen political uncertainty, weighing further on Yen.
The political upheaval also casts a shadow over BoJ’s monetary path. The central bank’s latest summary of opinions indicates a clear preference for tightening policy over time, yet the timeline remains ambiguous. Various board members expressed differing views on the timing for rate hikes, balancing the need for monetary restraint against current domestic and global uncertainties. With Japan’s economy already facing risks tied to the upcoming US administration’s trade policies, BoJ may lean toward caution, delaying rate hikes until the outlook clarifies.
In the currency markets, Aussie and Kiwi are currently leading gains. Dollar is also making headway, albeit at a slower pace. Conversely, Yen sits at the bottom of the pack, alongside Swiss Franc and Loonie. Euro and Pound are holding steady in mid-range positions. Today’s European trading session might remain subdued with little on the economic calendar, and US. markets are partially closed for Veterans Day. However, activity is expected to pick up tomorrow with UK employment data and the much-anticipated US CPI report on Wednesday.
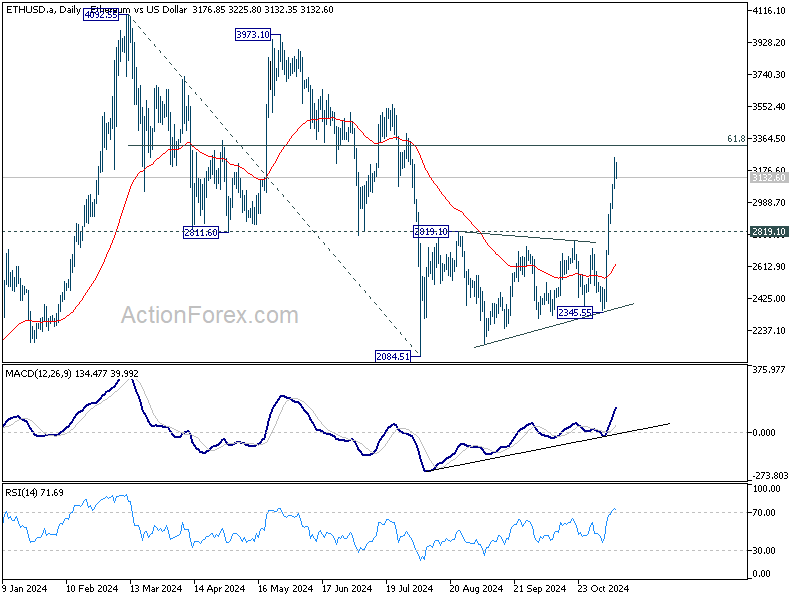
Technically, Ethereum followed Bitcoin higher last week in response to US elections results. The strong break of 2800 cluster resistance zone suggests that corrective down trend from 4092.55 has already completed with three waves down to 2084.51. Immediate focus is now on 61.8% retracement of 4092.55 to 2084.51 at 3325.47. Decisive break there will argue that larger up trend is ready to resume through 4092.55 high.
In Asia, at the time of writing, Nikkei is up 0.06%. Hong Kong HSI is down -1.66%. China Shanghai SSE is up 0.08%. Singapore Strait Times is up 0.01%. Japan 10-year JGB yield is down -0.0025 at 1.003.
BoJ affirms core stance: Rate hikes to proceed gradually if economic outlook holds
BoJ's Summary of Opinions from its October 30-31 reiterated its "basic thinking" that it will adjust the degree of monetary accommodation if the outlook for economic activity and prices unfolds as expected. Emphasizing the importance of "communicating effectively" this core message, BoJ aims to manage market expectations carefully.
One member indicated that if economic conditions progress as anticipated, BoJ could "raise the policy interest rate gradually," reaching 1.0% in the second half of fiscal 2025 at the earliest.
Conversely, another member expressed caution, noting the difficulty in confidently conveying a medium-term policy rate path due to "high uncertainties" surrounding the neutral interest rate and the transmission mechanism of monetary policy.
RBNZ 1-yr inflation expectation down, 2-yr's up
RBNZ's latest Survey reveals that expectations for one-year-ahead annual inflation dropped significantly by -35 basis points from 2.40% to 2.05%, extending a steady downward trend in inflation expectations since Q2 2023. On the other hand, two-year inflation expectations inched up to from 2.03% 2.12% .
For wage inflation, one-year-ahead expectations decreased modestly by -7 basis points to 2.81%, while two-year projections rose from 2.86% to 3.16%.
Growth expectations improved. The mean one-year-ahead GDP growth expectation jumped by 61 basis points to 1.60%, with a smaller increase of 7 basis points for two-year growth expectations to 2.17%.
On the interest rate front, the survey points to further monetary easing ahead. OCR is expected to be 4.20% by the end of Q4 2024, with a sharper decline to 3.33% anticipated by Q3 2025. OCR is currently at 4.75% following a recent 50bps cut in October.
China’s CPI falls back to 0.3% yoy, PPI down -2.9% yoy
In October, China’s CPI grew only 0.3% yoy, below the expected 0.4% yoy, and marking a slight drop from September’s 0.4% yoy. Core CPI, which excludes food and energy prices, rose marginally from 0.1% yoy to 0.2% yoy, suggesting minimal underlying inflationary momentum. Month-over-month, CPI fell by -0.3%, further indicating subdued domestic demand.
Since March last year, China's CPI growth has been hovering around zero, contributing to concerns over prolonged deflationary trends and lackluster domestic consumption. Cumulatively, CPI has grown by only 0.3% from January to October, far below the government's annual target of 3%. These figures underscore subdued consumer activity and insufficient demand to drive price increases.
Meanwhile, China’s PPI saw steeper-than-expected decline, slipping from -2.8% yoy to -2.9% yoy, marking the 25th consecutive month of negative growth. This drop was deeper than market forecasts of -2.5% yoy and signals ongoing pricing pressures within the production sector.
Fed's Kashkari warns of trade war inflation risks, eyes data for Dec cut
Minneapolis Fed President Neel Kashkari conveyed cautious optimism about the US. inflation outlook during his appearance on CBS's "Face the Nation" on Sunday. Acknowledging that "a lot of progress " was made in reducing inflation, he emphasized that the job is not yet complete, but noted that the economy is "on a good path" toward 2% inflation.
Kashkari anticipates another rate cut in December, contingent upon forthcoming economic data. He stressed the importance of monitoring "what the data looks like" before making a definitive decision.
Addressing concerns about renewed trade war under the new administration, Kashkari remarked that one-time tariffs "shouldn't have an effect long run on inflation."
However, he cautioned that escalating "tit-for-tat" tariff measures between countries could lead to greater uncertainty and have more significant economic implications.
ECB's Holzmann signals December rate cut, but awaits new forecasts for final decision
Austrian ECB Governing Council member Robert Holzmann indicated that a rate cut in December is "possible". "There is nothing at the moment that would argue against that", he added.
But he alos emphasized that "does not mean it will automatically happen". He emphasized the importance of ECB's upcoming forecasts and data, which will inform the final decision in December.
US CPI in focus as inflation challenges Persist
In a relatively light data week, US CPI is set to take center stage, with October’s headline and core inflation expected to remain at 2.4% and 2.6%, respectively. The “last mile” in achieving further disinflation appears increasingly challenging without significant economic slowdown.
This struggle of Fed could be complicated further by inflationary policies expected from the new administration next year, potentially slowing the Fed’s rate-cut path. Fed fund futures currently project three additional rate cuts in 2025, bringing the federal funds rate to a 3.75-4.00% range, but more persistent inflation could temper this easing. Additional key US releases include PPI and retail sales.
In the UK, employment and GDP data will provide crucial indicators for BoE, which has signaled a “gradual” approach in policy easing. Only a marked deceleration in wage growth or a pronounced dip in GDP might prompt them to reevaluate.
Australia’s labor data will also be crucial, especially after the RBA’s surprising tone last week, where they underscored inflation vigilance and left all policy options open. Markets are now speculating that the RBA’s first rate cut might be delayed from February to May. However, softening in wage growth or employment could prompt the RBA to reconsider its approach.
Other events to monitor include BoJ’s summary of opinions, Japan’s GDP release, and economic data out of China.
Here are some highlights for the week:
- Monday: BoJ summary of opinions, Japan eco watchers sentiments; New Zealand inflation expectations.
- Tuesday: Australia Westpac consumer sentiment, NAB business confidence; Germany CPI final, ZEW economic sentiment; UK employment; Canada building permits.
- Wedneday: Japan PPI; Australia wage price index; US CPI.
- Thursday: Australia employment; Eurozone GDP revision, industrial production; US PPI, jobless claims.
- Friday: Japan GDP tertiary industry index; New Zealand BNZ manufacturing;China industrial production, retail sales, fixed asset investment; UK GDP, trade balance, production; Swiss PPI; Canada manufacturing sales, wholesale sales; US retail sales, Empire state manufacturing, import prices, industrial production, business inventories.
USD/JPY Daily Outlook
Daily Pivots: (S1) 152.07; (P) 152.72; (R1) 153.30; More...
USD/JPY recovers notably today but stays below 154.70 temporary top. Intraday bias remains neutral at this point. Further rise is expected as long as 151.27 support holds. Above 154.70 will resume the rally from 139.57 towards 161.94 high. However, considering bearish divergence condition in 4H MACD, break of 151.27 will indicate short term topping, and turn bias back to the downside for 55 D EMA (now at 149.74).
In the bigger picture, price actions from 161.94 are seen as a corrective pattern to rise from 102.58 (2021 low). The range of medium term consolidation should be set between 38.2% retracement of 102.58 to 161.94 at 139.26 and 161.94. Nevertheless, sustained break of 139.26 would open up deeper medium term decline to 61.8% retracement at 125.25.
NZ First Impressions: RBNZ Survey of Expectations, Q4 2024
Near term inflation expectations have dropped back, but longer-term expectations are up.
Inflation expectations
- One year ahead: 2.05% (Prev: 2.40%, down 35 points)
- Two years ahead: 2.12% (Prev: 2.03%, up 9 points)
- Five years ahead: 2.24% (Prev: 2.07%, up 17 points)
- Ten years ahead: 2.19% (Prev: 2.03%%, up 16 points)
The latest survey of inflation expectations was a mixed bag, but is unlikely to cause much alarm at the RBNZ about either the up or downside risks for inflation. On balance, inflation expectations look consistent with the RBNZ’s medium-term inflation target.
In the detail, expectations for inflation over the coming year have dropped sharply, falling to 2.05% (down from 2.4% previously). That’s consistent with the sharp falls in actual inflation over the past year and our forecast that inflation will remain close to 2% over the coming year.
However, inflation at longer horizons has picked up. Notably, the closely watched measure of expected inflation in two-years’ time has increased to 2.1% (up from 2% last quarter). We also saw expectations for inflation 5 and 10 years ahead rising to 2.2% (both up about 20 ppts compared to the previous survey).
The lift in longer-term inflation expectations follows sharp falls last quarter and leaves them at levels that are still close to the RBNZ’s target.
Overall, we think that today’s survey and other recent data will leave the RBNZ feeling comfortable that pricing behaviour is now well aligned with their medium-term target. Consistent with that, we expect that the RBNZ will deliver another 50bp rate cut next week.
But even with inflation expectations looking well contained, today’s survey highlights that the risks for inflation are not all in one direction. While inflation has fallen sharply over the past year (especially in relation to import prices), we are still seeing strong increases in some domestic costs (like local council rates and insurance chares). Those continued cost increases are limiting the decline in overall inflation. And with related risks for inflation expectations, such costs warrant continued close attention as we head into the new year. We expect that the RBNZ will adopt a more gradual and data dependent approach to policy changes next year.
EUR/USD Makes U-Turn, Risk of More Downsides
Key Highlights
- EUR/USD started a fresh decline from the 1.0945 resistance.
- It traded below a rising channel with support at 1.0880 on the 4-hour chart.
- Gold started a downside correction below the $2,700 level.
- Bitcoin rallied to a new record high above $80,000 and might continue to rise.
EUR/USD Technical Analysis
The Euro started a fresh decline after it failed to surpass 1.0950 against the US Dollar. EUR/USD traded below the 1.0850 support to enter a bearish zone.
Looking at the 4-hour chart, the pair traded below a rising channel with support at 1.0880. It settled below the 1.0800 level, the 100 simple moving average (red, 4-hour), and the 200 simple moving average (green, 4-hour).
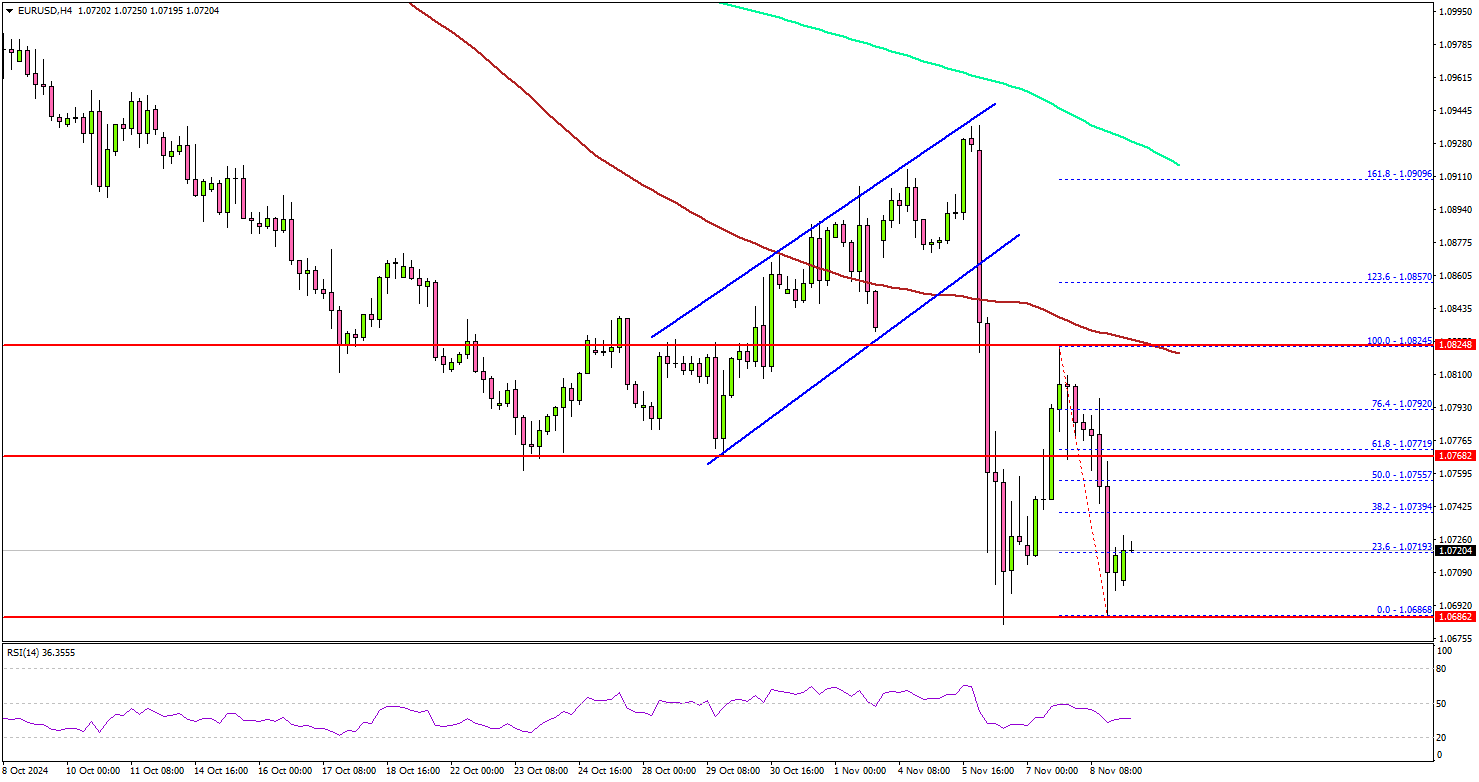
A low was formed at 1.0686 and the pair is now consolidating losses. It is trading near the 23.6% Fib retracement level of the recent decline from the 1.0825 swing high to the 1.0686 low.
On the downside, immediate support sits near the 1.0685 level. The next key support sits near the 1.0650 level. Any more losses could send the pair toward the 1.0620 level.
On the upside, the pair could face resistance near the 1.0755 level. The first key resistance is near the 1.0775 level or the 61.8% Fib retracement level of the recent decline from the 1.0825 swing high to the 1.0686 low.
A close above the 1.0775 level could set the tone for another increase. The next major resistance could be 1.0800, above which the price could accelerate higher toward the 1.0820 resistance.
Looking at Bitcoin, the bulls remain in action and they might even aim for a move toward the $85,000 level in the near term.
Upcoming Economic Events:
- China’s M2 Money Supply (YoY) (Oct) - Forecast +1.2%, versus +6.8% previous.
BoJ affirms core stance: Rate hikes to proceed gradually if economic outlook holds
BoJ's Summary of Opinions from its October 30-31 reiterated its "basic thinking" that it will adjust the degree of monetary accommodation if the outlook for economic activity and prices unfolds as expected. Emphasizing the importance of "communicating effectively" this core message, BoJ aims to manage market expectations carefully.
One member indicated that if economic conditions progress as anticipated, BoJ could "raise the policy interest rate gradually," reaching 1.0% in the second half of fiscal 2025 at the earliest.
Conversely, another member expressed caution, noting the difficulty in confidently conveying a medium-term policy rate path due to "high uncertainties" surrounding the neutral interest rate and the transmission mechanism of monetary policy.
RBNZ 1-yr inflation expectation down, 2-yr’s up
RBNZ's latest Survey reveals that expectations for one-year-ahead annual inflation dropped significantly by -35 basis points from 2.40% to 2.05%, extending a steady downward trend in inflation expectations since Q2 2023. On the other hand, two-year inflation expectations inched up to from 2.03% 2.12% .
For wage inflation, one-year-ahead expectations decreased modestly by -7 basis points to 2.81%, while two-year projections rose from 2.86% to 3.16%.
Growth expectations improved. The mean one-year-ahead GDP growth expectation jumped by 61 basis points to 1.60%, with a smaller increase of 7 basis points for two-year growth expectations to 2.17%.
On the interest rate front, the survey points to further monetary easing ahead. OCR is expected to be 4.20% by the end of Q4 2024, with a sharper decline to 3.33% anticipated by Q3 2025. OCR is currently at 4.75% following a recent 50bps cut in October.
China’s CPI falls back to 0.3% yoy, PPI down -2.9% yoy
In October, China’s CPI grew only 0.3% yoy, below the expected 0.4% yoy, and marking a slight drop from September’s 0.4% yoy. Core CPI, which excludes food and energy prices, rose marginally from 0.1% yoy to 0.2% yoy, suggesting minimal underlying inflationary momentum. Month-over-month, CPI fell by -0.3%, further indicating subdued domestic demand.
Since March last year, China's CPI growth has been hovering around zero, contributing to concerns over prolonged deflationary trends and lackluster domestic consumption. Cumulatively, CPI has grown by only 0.3% from January to October, far below the government's annual target of 3%. These figures underscore subdued consumer activity and insufficient demand to drive price increases.
Meanwhile, China’s PPI saw steeper-than-expected decline, slipping from -2.8% yoy to -2.9% yoy, marking the 25th consecutive month of negative growth. This drop was deeper than market forecasts of -2.5% yoy and signals ongoing pricing pressures within the production sector.
Fed’s Kashkari warns of trade war inflation risks, eyes data for Dec cut
Minneapolis Fed President Neel Kashkari conveyed cautious optimism about the US. inflation outlook during his appearance on CBS's "Face the Nation" on Sunday. Acknowledging that "a lot of progress " was made in reducing inflation, he emphasized that the job is not yet complete, but noted that the economy is "on a good path" toward 2% inflation.
Kashkari anticipates another rate cut in December, contingent upon forthcoming economic data. He stressed the importance of monitoring "what the data looks like" before making a definitive decision.
Addressing concerns about renewed trade war under the new administration, Kashkari remarked that one-time tariffs "shouldn't have an effect long run on inflation."
However, he cautioned that escalating "tit-for-tat" tariff measures between countries could lead to greater uncertainty and have more significant economic implications.
ECB’s Holzmann signals December rate cut, but awaits new forecasts for final decision
Austrian ECB Governing Council member Robert Holzmann indicated that a rate cut in December is "possible". "There is nothing at the moment that would argue against that", he added.
But he alos emphasized that "does not mean it will automatically happen". He emphasized the importance of ECB's upcoming forecasts and data, which will inform the final decision in December.
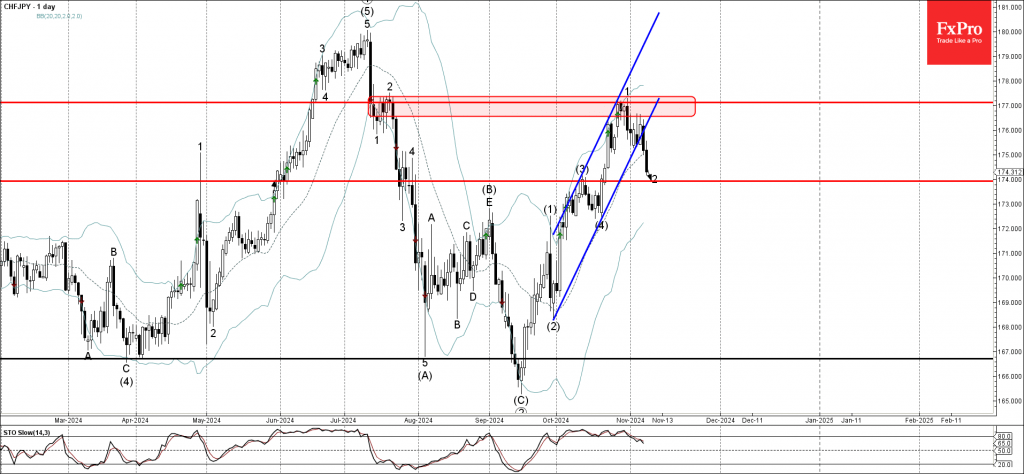
CHFJPY Wave Analysis
- CHFJPY broke daily up channel
- Likely to fall to support level 174.00
CHFJPY currency pair under bearish pressure after the earlier breakout of the support trendline of the sharp daily up channel from the end of September.
The breakout of this up channel accelerated the active minor corrective wave 2, which started earlier from the key resistance 177.00, which has been reversing the pair from July.
Given the strongly bullish Yen sentiment seen across the currency markets today, CHFJPY currency pair can be expected to fall to the next support level 174.00 (target price for the completion of the active wave 2).