
Sample Category Title
Prospects for Gold Correction
Market Picture
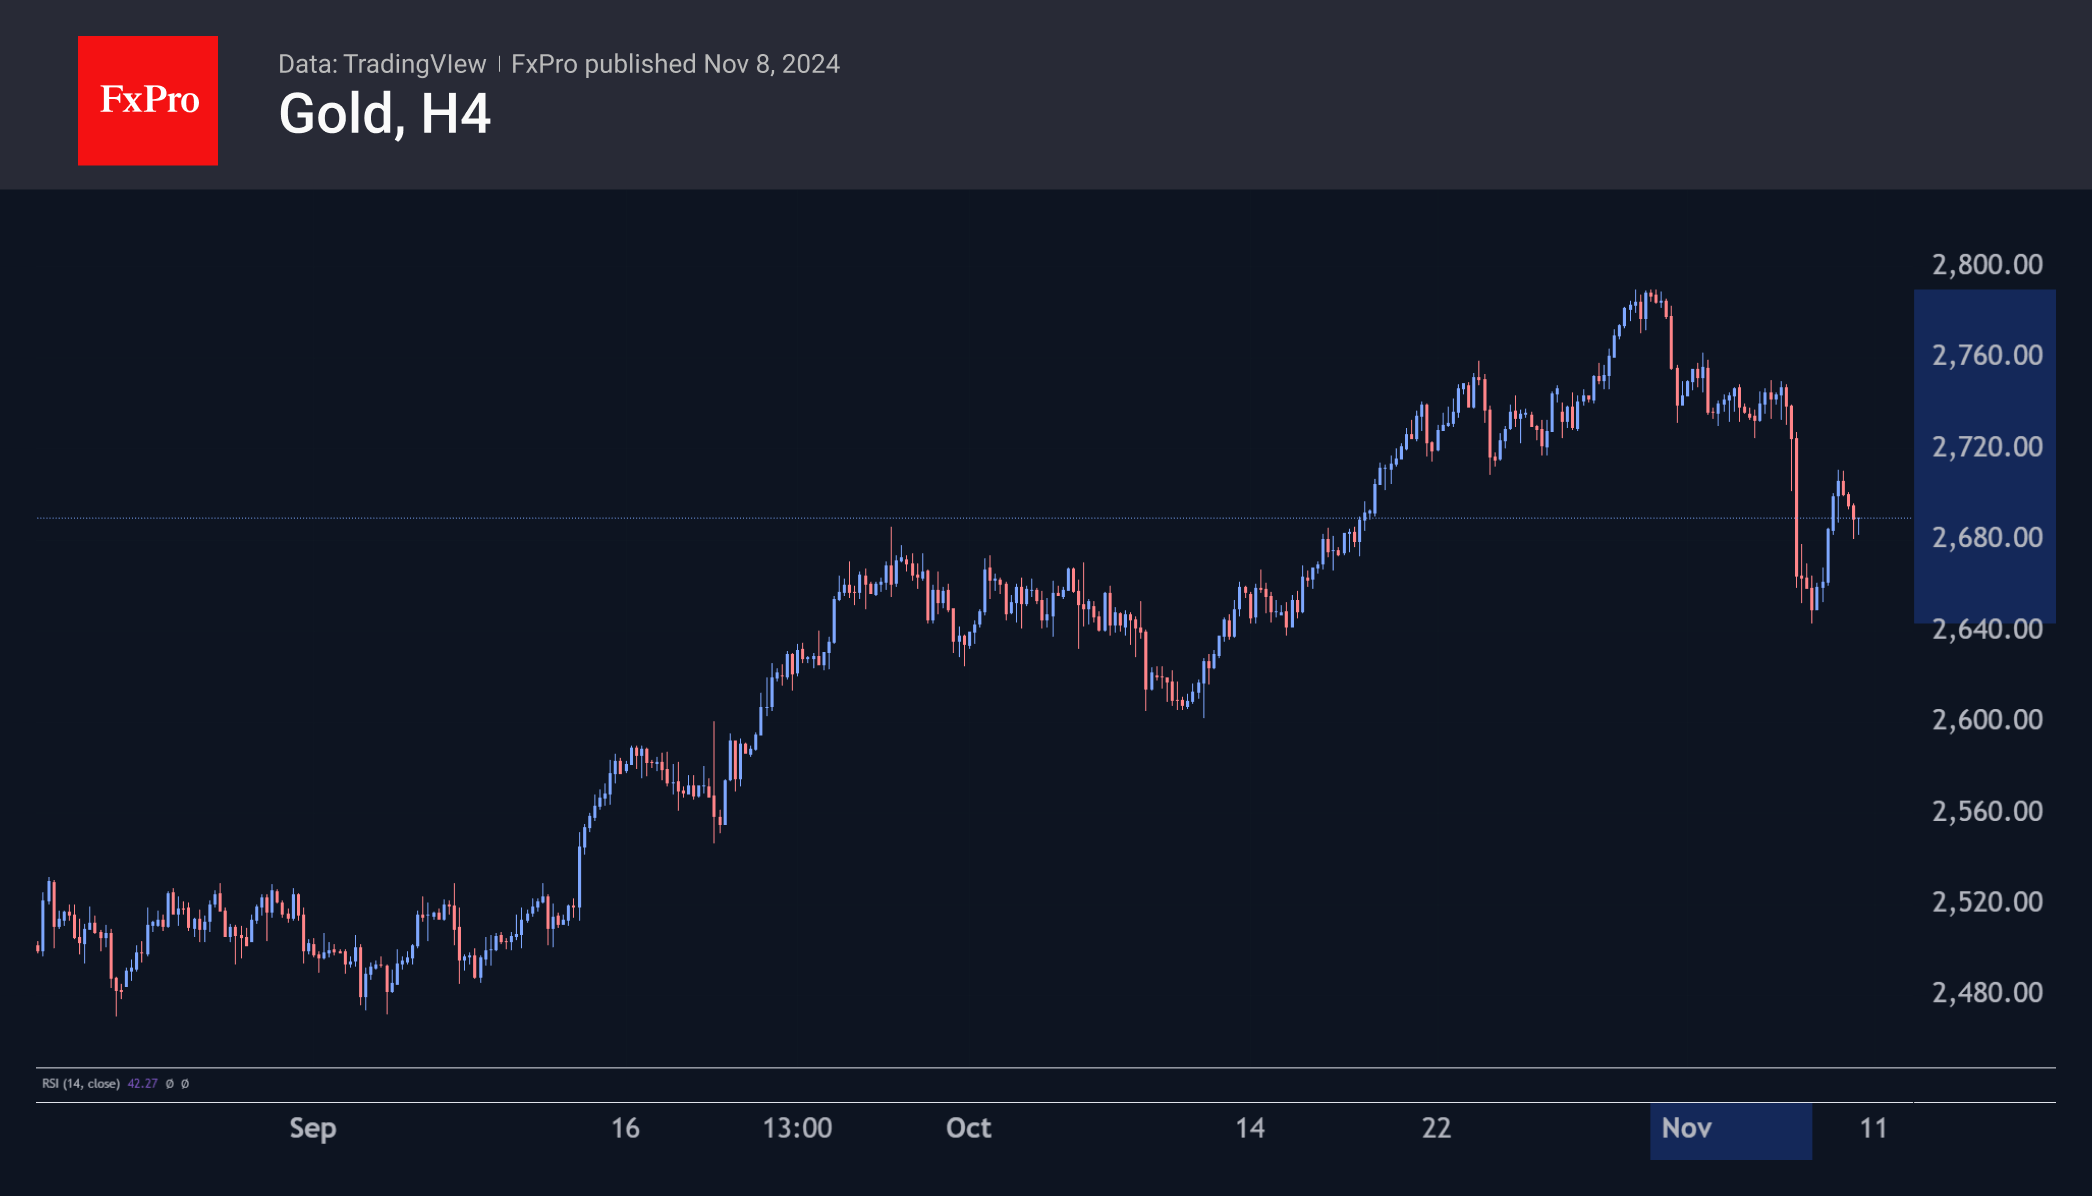
Gold lost over 3% in value on the day the presidential election results were tallied. Cumulatively, from the peak in late October to the recent low, the losses exceed 5%. So far, it does not look like a tragedy. On Thursday, the price added 2.5% from the lows to the high intraday, recovering most of the decline from the day before.
Technical Analysis
Gold has found support in the form of the 50-day moving average just below $2650. This correction removes the overbought accumulated conditions from nearly three months of previous gains.
Although gold rebounded encouragingly on Thursday, we doubt further gains in the coming weeks. We attribute Thursday’s recovery to gold bugs attempting to join the general pullback into risk assets, reinforced by the temporary pullback in the dollar that day.
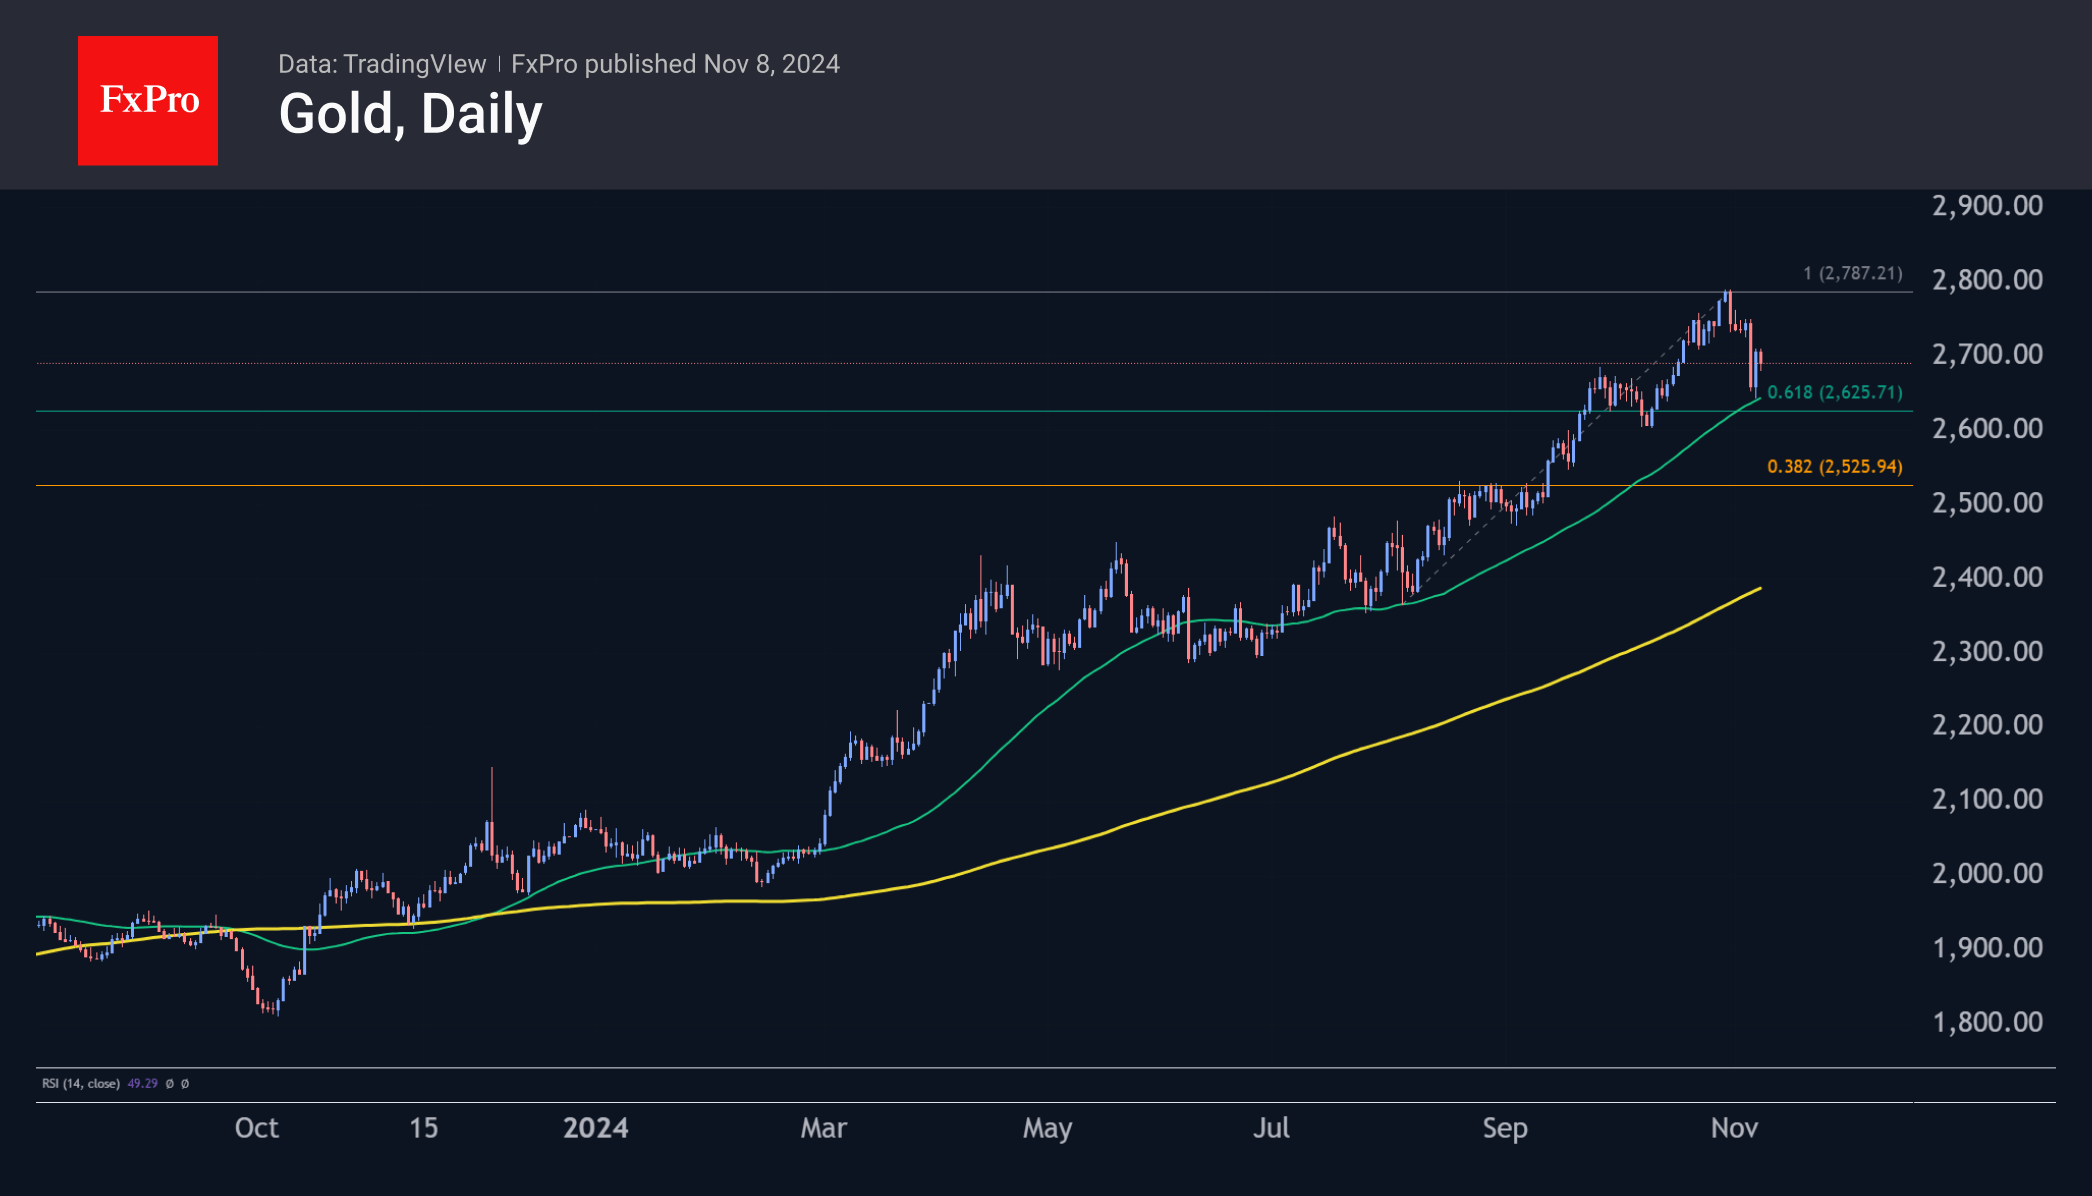
We do not rule out a deeper decline in price, correcting more than 50% of the rise from the lows of last October. Some capital parked in gold in recent months while the dollar strengthened, as it was a drag from risk. Now, gold may be in for a reversal.
The start of the corrective movement is confirmed by the return of the RSI on weekly timeframes from extreme overbought with values above 80.
The growth of the dollar may accelerate the global correction, but even without it, precious metals may face challenges.
Stages of Decline
In the short term, we highlight several stages of decline. A consolidation under $2640 will mark the break of support in the form of the 50-day moving average and the deepening of the correction under the traditional 61.8% retracement from the August lows.
The next leg of the decline is seen as a correction to the $2400 area, where the 200-day moving average and the starting point of the last growth phase are centred.
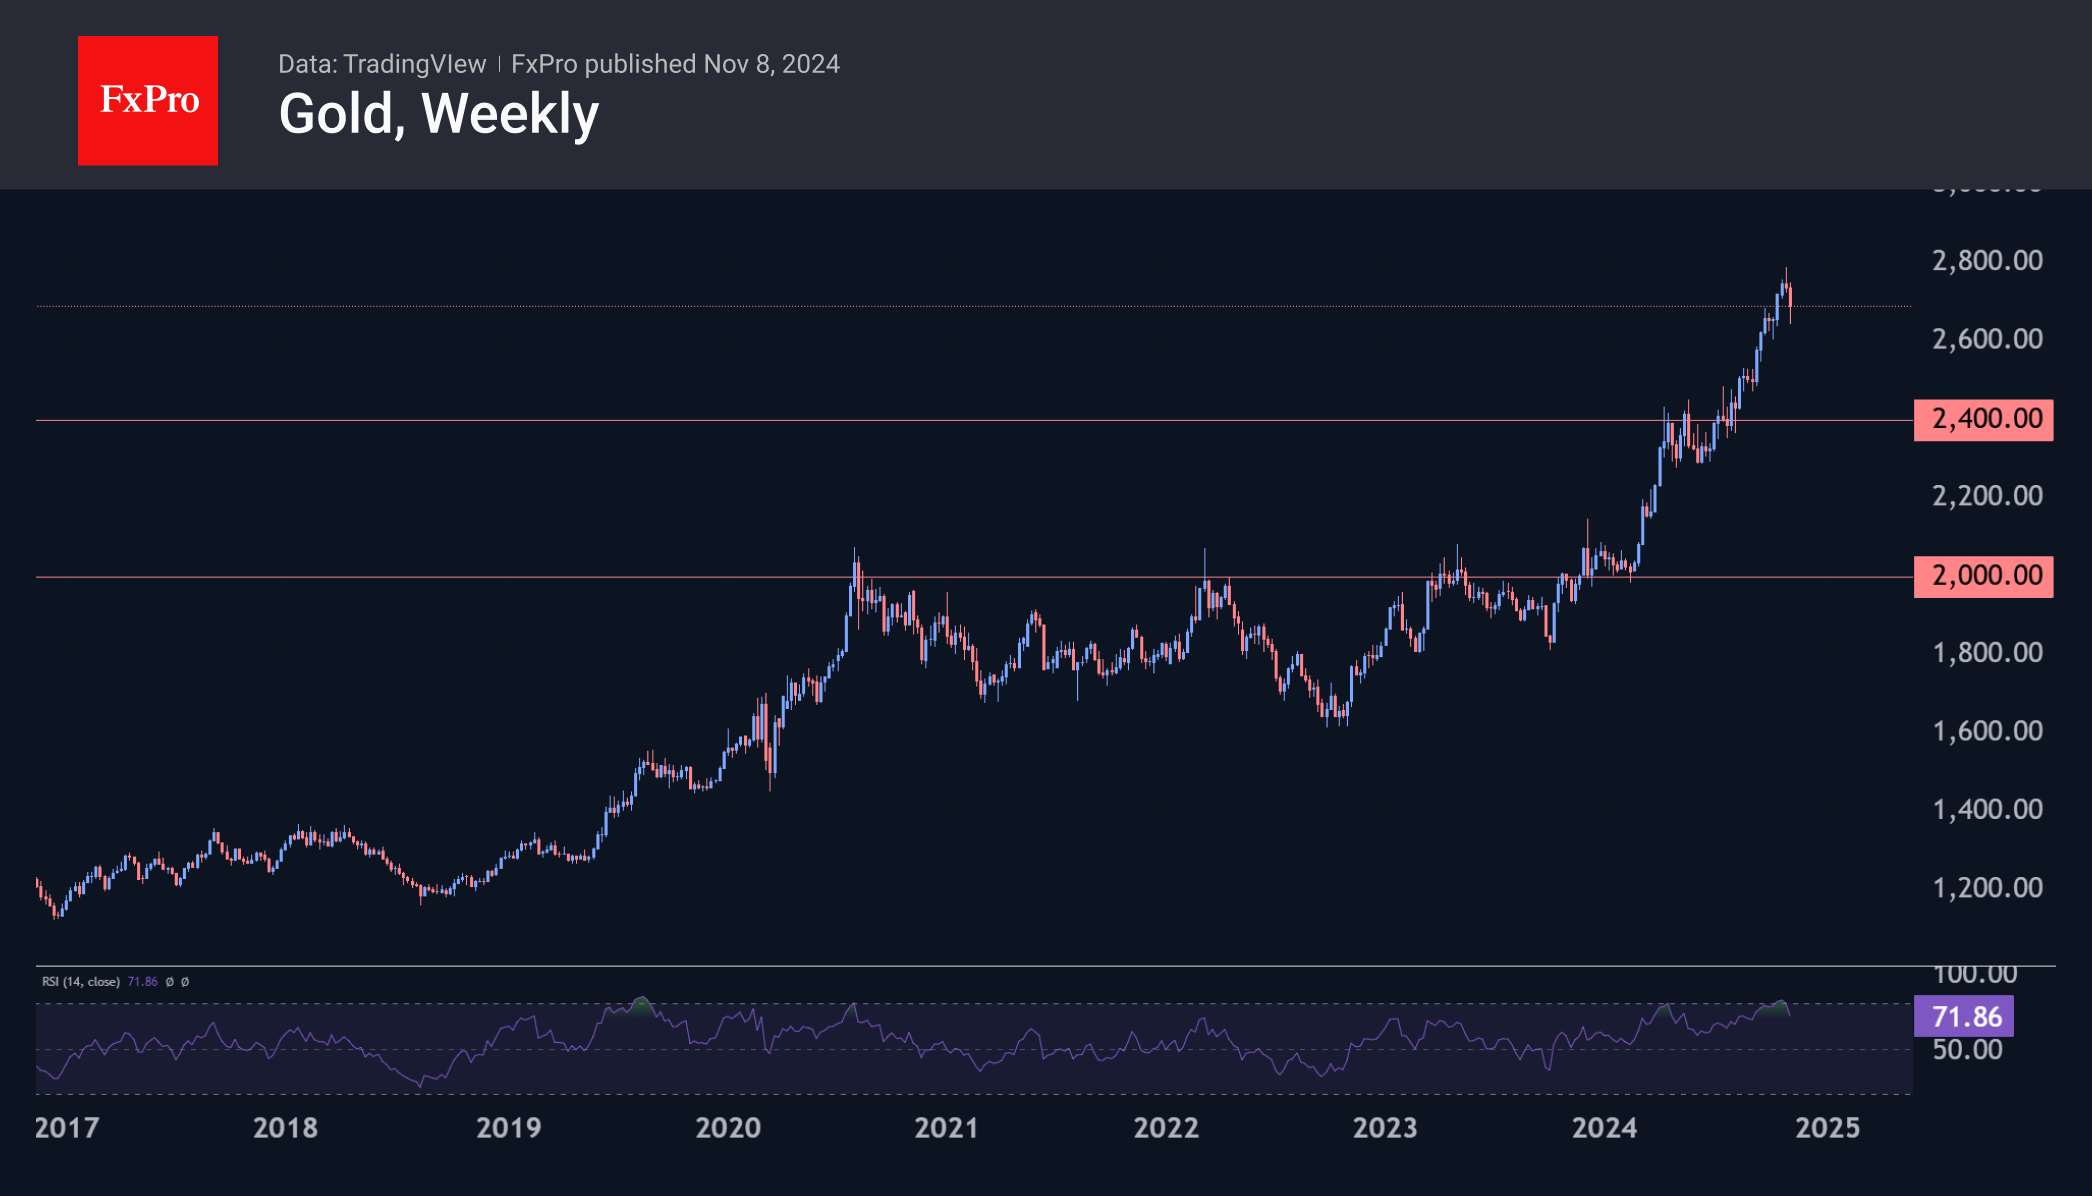
From a more distant perspective, we see impressive chances of price pullback in the $2000 area. In this case, the previous area of highs may act as a global support.
A sharp return to growth will allow us to discuss the imminent renewal of historical highs. That is a real but alternative scenario. It seems to us that there is now more chance that gold will leave the top role for a while.
Weekly Focus – Stronger Dollar and Higher Yields After Trump Victory
Donald Trump won the US election to become the next president, and it seems that the Republicans likely won a majority in both chambers of Congress. Trump was slim favourite ahead of the election, so the result was partially priced in already, but there was still a clear market reaction in that bond yields are up by some 10bp, the USD has strengthened around 1% and US stock prices are up by 4-5%. As has been the case for months, the market expects a Trump administration to mean an even more expansionary fiscal policy, higher tariffs (which imply a stronger USD) and deregulation, which could improve corporate earnings.
At its meeting just after the election, the US central bank delivered a 25bp rate cut as expected and did not send any new signals regarding the rate outlook. Part of the increase in bond yields since and just before the election is driven by higher inflation expectations, as the Trump policy agenda is seen as more inflationary. If this continues, it could eventually lead to the Fed becoming more hawkish and signalling that rate cuts could end earlier, but so far, inflation expectations have not become excessively high. Actual inflation was to the high side in September, but that might well look better in the October number that we get on Wednesday, likely the most important data release of the week.
In Europe, bond yields did not follow US yields up. Instead, there was a modest decline in short-term rates, as the result was seen as increasing risks of lower growth in the European economy and hence increasing the probability of ECB rate cuts. As we see it, this risk should not be overstated, at least in the short term. Although European exports to the US could well face higher tariffs from next year, it seems highly unlikely that the tariffs will result in a tightening of US fiscal policy and hence a dampening of global demand and US imports. However, there is in any case increasing concerns over European growth and the risk that inflation could become too low, and we maintain our expectation that the ECB will cut rates by 25bp at every meeting until September, with the possibility that they might chose a 50bp rate cut at the next meeting. One reason is the outlook for fiscal tightening in Europe in 2025. In the coming week, we will get updated forecasts on this and the economy in general from the European Commission.
Further complicating the situation, the German government has collapsed, partly over disagreement about fiscal policy. Markets see an increasing chance that fiscal policy might be eased in the longer term.
The Bank of England delivered a 25bp rate cut this week as expected, but also turned a bit more hawkish as it revised its inflation and growth outlooks substantially higher. Central banks in Norway and Sweden went in opposite directions with a hold in Norway and a 50bp cut in Sweden, see the Scandi Update section.
We did not get the hoped-for concrete numbers for fiscal stimulus in China, other than a statement that it will be "forceful". However, there was an announcement of a CNY 6tn local government debt swap program which should ease the situation for local governments and make them able to support the economy more. All in all, it remains unclear to what extent policies will be able to turn the situation around for Chinese growth.
Sunset Market Commentary
Markets
This week was amassed with high profile political and monetary event risk potentially providing one (or more) gamechangers for global trading. A congestion of central bank decisions including the Fed, the Bank of England and a long list of smaller central banks, were supposed to give some guidance on where they position themselves on the path of policy easing. The Banco of Brazil (a trendsetter) already switched sides raising the interest rate further. However the monetary policy setup, this time evidently was overshadowed by the outcome of the US Presidential and Congress elections. Especially if one had known the outcome in advance, one probably would have predicted a landslide on global markets. On top of that an (un?)expected break-up of the German government coalition also foreshadowed a regime change. Let’s overlook the market outcome of this historic week (compared last Friday’s close). Admittedly, the starting point of such an of exercise has some arbitrary character. Nevertheless this the result.
The biggest reaction occurred on (US) equity markets. US major indices added about 4.0% to 5.5% to touch record levels on an expected growth-friendly policy of the Trump administration. European equities (Eurostoxx50) over the same period lost about 1.25%. Moves in yields were far less spectacular and maybe in the end a bit contra-intuitive compared to the high profile (political) story. US yields declined between 4 bps (2-y) and 10 bps (10-y). Admittedly, this outcome masks a sharp rise annex correction in two session after the US elections. Even so, it remains striking that what is seen as a potential aggressive shift to a reflationary US policy (both in terms of growth and inflation) only yields this modest result. Maybe markets took a bit of a similar attitude as did the Fed yesterday. Powell and Co when cutted interest rates (25 bps ), indicated that they saw little impact from the election outcome short-term. No concrete measures are yet available and they will be executed in a very complex and unpredictable context. In this respect, political event risk probably still is more ahead of us than behind us. German yields moved between 4.0 bps (2-y) and +0.4 bps (30-y). For now, markets don’t draw firm conclusions from budget orthodox German Fin Min Lindner being fired by Chancellor Scholz, potentially opening the way for a more stimulative fiscal policy, too. EMU interest rate markets in a first reaction to the US election outcome even positioned from more ECB easing to counterbalance the impact of US trade tariffs on EMU growth. Maybe, fiscal policy also has a bigger role to play than markets currently contemplate. Again, (positive) budgetary event risk might still be ahead of us. In the UK, the BOE acknowledged the reflationary impact of the Labour budget, but it didn’t derail the process of cautious removal of policy restriction yet. Finally, FX markets also didn’t draw any unequivocal conclusion. The dollar initially followed the spike higher in US yields, but in a weekly perspective gains are modest (DXY +0.5%, EUR/USD -0.75%). If EMU fiscal policy also turns more growth-friendly, the euro over time might also be (a bit) less vulnerable in the Trump era than markets feared up until now.
News & Views
Czech National Bank governor Michl said that monetary policy must stay restrictive: “the policy mix for the future should be, firstly, keeping interest rates higher than before Covid for the next 10 years and secondly, which is also important, governments must balance their budgets. Because if they don’t do it, there could be the risk of a second wave of inflation.” Core inflation should remain “slightly below” the central bank’s 2% target, Michl said. After yesterday’s 25 bps rate cut, the CNB is discussing when to bring rate cuts to halt, since that (core CPI) goal hasn’t been met, the central bank chief added. He declined to provide a timeframe for a potential policy shift. The Czech koruna extends gains after yesterday’s hawkish cut with EUR/CZK currently changing hands at 25.20 after testing the 25.40 resistance area earlier this week.
Canadian payrolls showed 14.5 net job growth in October, coming in below 27.2k consensus. Details however showed that net lay-offs in part-time jobs (-11.2k) pulled the full time employment change number (+25.6k) down. The unemployment rate stabilized at 6.5%, but the participation rate ticked down from 64.9% to 64.8%. That’s the fourth consecutive decline and the lowest since December 1997 (excluding the Covid-years 2020 & 2021). Total hours worked rose 0.3% M/M and 1.6% Y/Y. Average hourly wages among employees increased 4.9% Y/Y in October, following growth of 4.6% in September. The Canadian dollar didn’t respond to the labour market data. USD/CAD is trading at 1.3912, staying close to YTD resistance levels around 1.3950.
Canada’s labour market remains solid in October
The Canadian labour market gained 14.5k positions in October, with full-time employment up 25.6k and part-time employment down 11.2k.
The unemployment rate was unchanged at 6.5% and the participation rate declined 0.1 percentage point to 64.8%.
Employment by sector showed gains in business, building and other support services (+29k), while losses were seen in finance, insurance, real estate, rental and leasing (-13k) and public administration (-8.7k).
Lastly, total hours worked jumped 0.3% month-on-month, while wages were up 4.9% year-on-year (from 4.6% in September).
Key Implications
Another solid jobs report in October. Job gains were concentrated in full-time positions, with the cyclically sensitive private sector pulling the weight. Employees were working more hours and saw wage growth increase. Not to mention, we are seeing employment for youth starting to bounce back. All told, this report speaks of a labour market that continues to exude decent strength.
To cut by 50 bps or 25 bps? That's the question for the Bank of Canada. It recently accelerated the pace of rate cuts, with inflation stabilizing around the 2% target. Yet the labour market hasn't been forcing the BoC's hand. Today's report should encourage the bank to revert back to a 25 bp cut in December (our call), even if it means eating some crow on its one off 50 bp move previously. That said, if it is dead-set on getting its policy rate back into its neutral range (2.25% to 3.25%) by year-end, a 50 bp move would be the choice. Investors are uncertain which way the BoC will go, and given recent rhetoric from the central bank, it too doesn't seems to know which way it will go either.
USD/CHF Mid-Day Outlook
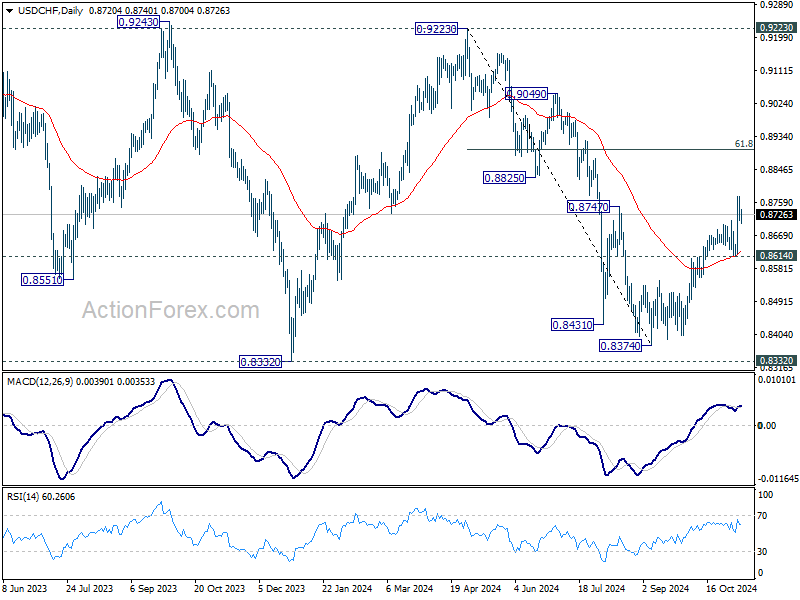
Daily Pivots: (S1) 0.8698; (P) 0.8736; (R1) 0.8762; More…
Intraday bias in USD/CHF remains neutral fro consolidations below 0.9773 temporary top. Further rally is still expected as long as 0.8614 support holds. Above 0.8773 will resume the rise from 0.8374 for 61.8% retracement of 0.9223 to 0.8374 at 0.8899 next.
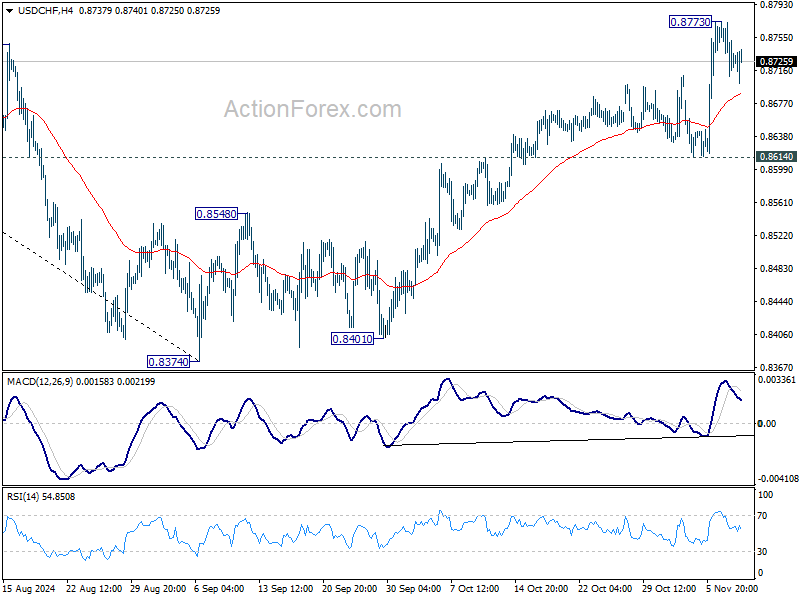
In the bigger picture, price actions from 0.8332 (2023 low) are currently seen as a medium term corrective pattern. Rise from 0.8374 is seen as the third leg. Overall outlook will continue to stay bearish as long as 0.9223 resistance holds. Break of 0.8332 low is in favor at a later stage when the consolidation completes.
USD/JPY Mid-Day Outlook
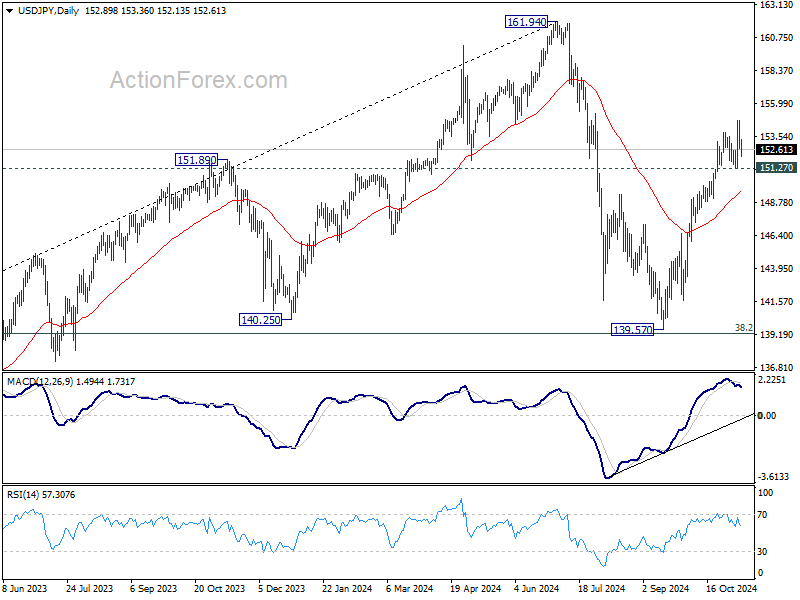
Daily Pivots: (S1) 152.16; (P) 153.44; (R1) 154.17; More...
Intraday bias in USD/JPY remains neutral and more consolidations could be seen below 154.70. But further rally is expected as long as 151.27 support holds. On the upside, break of 154.70 will resume the rally from 139.57 towards 161.94 high.
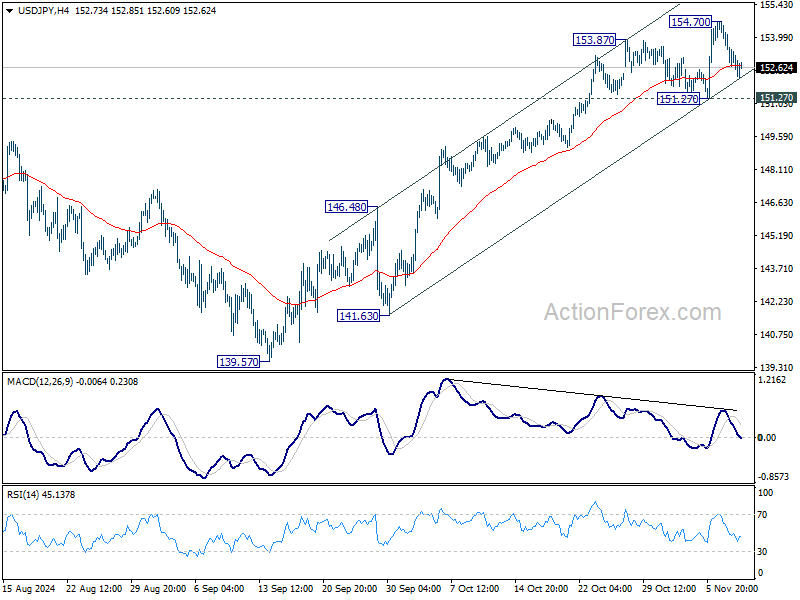
In the bigger picture, price actions from 161.94 are seen as a corrective pattern to rise from 102.58 (2021 low). The range of medium term consolidation should be set between 38.2% retracement of 102.58 to 161.94 at 139.26 and 161.94. Nevertheless, sustained break of 139.26 would open up deeper medium term decline to 61.8% retracement at 125.25.
GBP/USD Mid-Day Outlook
Daily Pivots: (S1) 1.2903; (P) 1.2956; (R1) 1.3040; More...
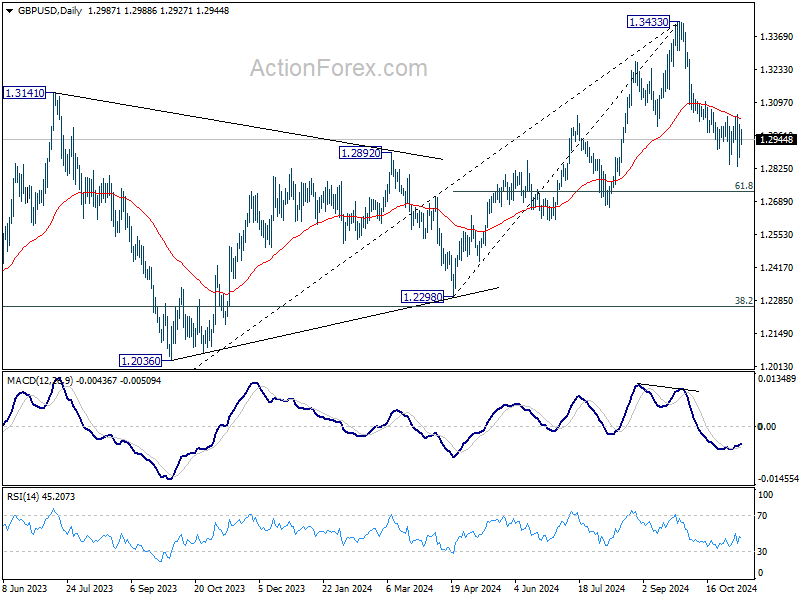
Range trading continues in GBP/USD and intraday bias stays neutral. With 1.3047 resistance intact, further decline is still expected. Firm break of 1.2842 will resume the fall from 1.3433 to 61.8% retracement of 1.2298 to 1.3433 at 1.2732. However, considering bullish convergence condition in 4H MACD, firm break of 1.3047 will indicate short term bottoming, and turn bias back to the upside.
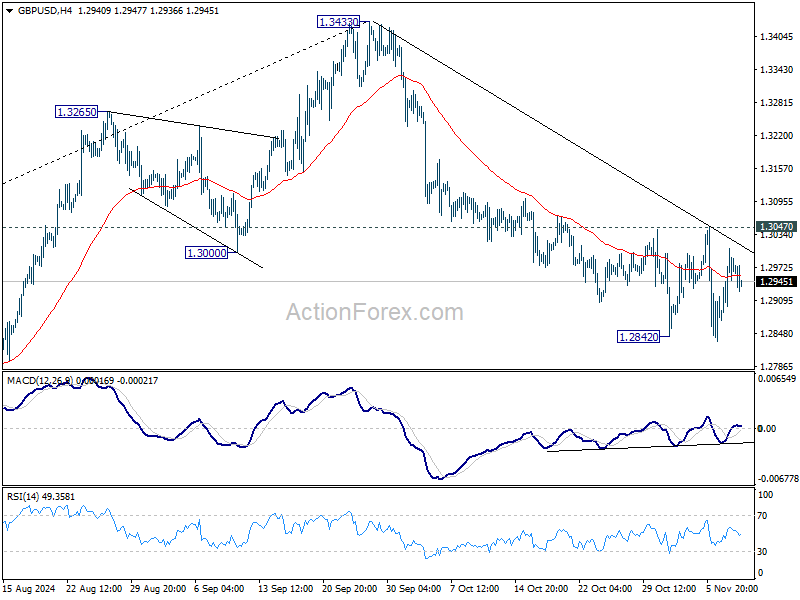
In the bigger picture, considering mildly bearish divergence condition in D MACD, a medium term top is likely in place at 1.3433 already. Price actions from there are seen as correction to whole up trend from 1.0351 (2022 low). Deeper decline would be seen to 38.2% retracement of 1.0351 to 1.3433 at 1.2256, which is close to 1.2298 structural support. Strong support should be seen there to bring rebound.
EUR/USD Mid-Day Outlook
Daily Pivots: (S1) 1.0736; (P) 1.0780; (R1) 1.0848; More...
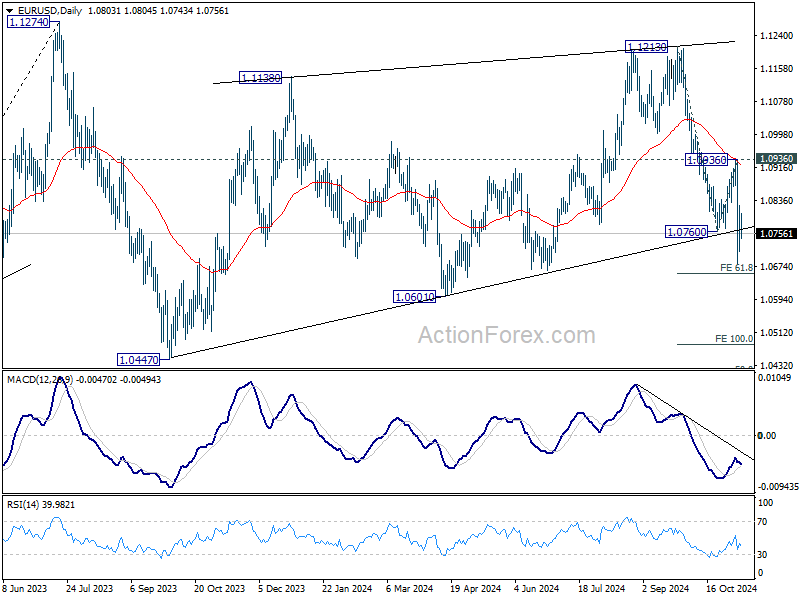
EUR/USD retreats after initial rejection by 55 4H EMA. Intraday bias remains neutral and more consolidations could still be seen above 1..0681 temporary low. But further decline is expected as long as 1.0936 resistance holds. On the downside, sustained break of 61.8% projection of 1.1213 to 1.0760 from 1.0936 at 1.0656 will pave the way to 100% projection at 1.0483.
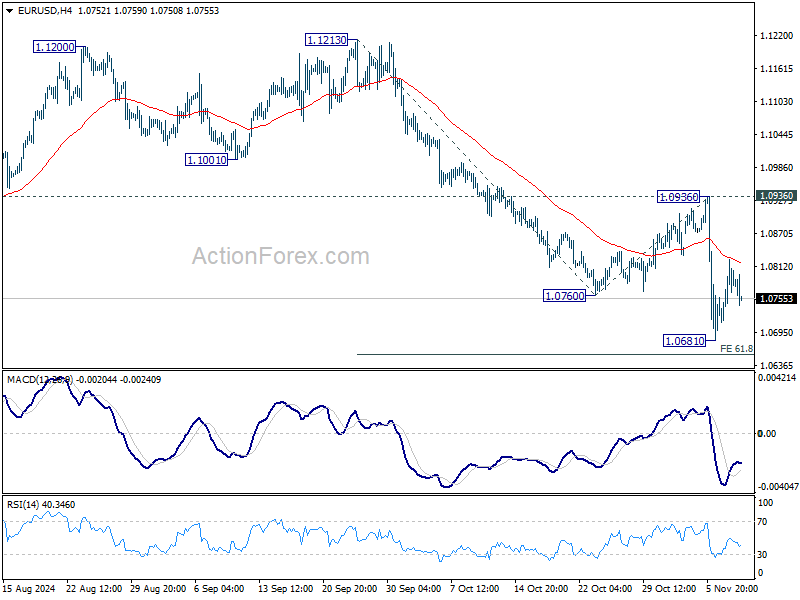
In the bigger picture, price actions from 1.1274 (2023 high) are seen as a consolidation pattern to up trend from 0.9534 (2022 low), with fall from 1.1213 as the third leg. Downside should be contained by 50% retracement of 0.9534 (2022 low) to 1.1274 at 1.0404, to bring up trend resumption at a later stage.
Dollar Rebounds, Suggesting Post-Election Bullish Sentiment Remains Intact
Dollar regained some strength in early US session, after a volatile week marked by high-profile events, including the US presidential election and Fed’s rate decision. The greenback's pullback from its post-election spike now appears to be more of a consolidation rather than reversal of its bullish momentum. However, Dollar bulls may need to wait until next week’s US CPI report to see if inflation data can provide the next catalyst for a decisive move.
Commodity currencies continue to top the weekly performance charts for now. However, there is uncertainty about whether they can maintain these gains as the trading week concludes, as Aussie appears to be leading a reversal.
Euro is currently the weakest performer of the week, with Swiss Franc also under pressure while Sterling is mixed. Yen also positions in the middle with help from today's strong rebound.
In Europe, at the time of writing, FTSE is down -0.62%. DAX is down -0.66%. CAC Is down -0.81%. UK 10-year yield is down -0.0490 at 4.455. Germany 10-year yield is down -0.046 at 2.402. Earlier in Asia, Nikkei rose 0.30%. Hong Kong HSI fell -1.07%. China Shanghai SSE fell -0.53%. Singapore Strait Times rose 1.39%. Japan 10-year yield fell -0.0006 to 1.006.
Canada's unemployment rate unchanged at 6.5%, wages growth picks up
Canada’s employment data for October revealed modest job growth, with 15k increase in jobs, falling short of the anticipated 33k. Employment rate slipped by -0.1% to 60.6%, marking its sixth consecutive monthly decline, while the unemployment rate remained steady at 6.5%. Labor force participation also declined, slipping by -0.1% to 64.8%, indicating a contraction in the active workforce.
On the positive side, total hours worked rose by 0.3% over the month and were up 1.6% yoy. Additionally, wage growth picked up, with average hourly wages rising 4.9% yoy, increase from September’s 4.6% yoy rise. This uptick in wages could signal pickup pressure on labor costs, potentially impacting inflation.
BoE's Pill emphasizes focus on long-term inflation amid temporary budget impact
In a briefing today, BoE Chief Economist Huw Pill emphasized that while the recent budget is expected to give inflation a temporary boost, the primary focus will remain on underlying, longer-term inflationary pressures.
Pill is more more concerned with structural inflation trends than short-term fluctuations triggered by fiscal policies.
"To a large extent, we will have to look through and interpret in a way that allows us to have a good sight of these underlying and more persistent components of inflation that really have to be the focus of what's driving our policy decisions," Pill said
According to BoE estimates, the budget is expected to add about 0.5% to inflation at its peak, which is anticipated to occur within the next two years. Governor Andrew Bailey expressed that this increase is unlikely to significantly alter BoE’s anticipated path of interest rate cuts.
EUR/USD Mid-Day Outlook
Daily Pivots: (S1) 1.0736; (P) 1.0780; (R1) 1.0848; More...
EUR/USD retreats after initial rejection by 55 4H EMA. Intraday bias remains neutral and more consolidations could still be seen above 1..0681 temporary low. But further decline is expected as long as 1.0936 resistance holds. On the downside, sustained break of 61.8% projection of 1.1213 to 1.0760 from 1.0936 at 1.0656 will pave the way to 100% projection at 1.0483.
In the bigger picture, price actions from 1.1274 (2023 high) are seen as a consolidation pattern to up trend from 0.9534 (2022 low), with fall from 1.1213 as the third leg. Downside should be contained by 50% retracement of 0.9534 (2022 low) to 1.1274 at 1.0404, to bring up trend resumption at a later stage.
BoE’s Pill emphasizes focus on long-term inflation amid temporary budget impact
In a briefing today, BoE Chief Economist Huw Pill emphasized that while the recent budget is expected to give inflation a temporary boost, the primary focus will remain on underlying, longer-term inflationary pressures.
Pill is more more concerned with structural inflation trends than short-term fluctuations triggered by fiscal policies.
"To a large extent, we will have to look through and interpret in a way that allows us to have a good sight of these underlying and more persistent components of inflation that really have to be the focus of what's driving our policy decisions," Pill said
According to BoE estimates, the budget is expected to add about 0.5% to inflation at its peak, which is anticipated to occur within the next two years. Governor Andrew Bailey expressed that this increase is unlikely to significantly alter BoE’s anticipated path of interest rate cuts.