
Sample Category Title
Canada’s unemployment rate unchanged at 6.5%, wages growth picks up
Canada’s employment data for October revealed modest job growth, with 15k increase in jobs, falling short of the anticipated 33k. Employment rate slipped by -0.1% to 60.6%, marking its sixth consecutive monthly decline, while the unemployment rate remained steady at 6.5%. Labor force participation also declined, slipping by -0.1% to 64.8%, indicating a contraction in the active workforce.
On the positive side, total hours worked rose by 0.3% over the month and were up 1.6% yoy. Additionally, wage growth picked up, with average hourly wages rising 4.9% yoy, increase from September’s 4.6% yoy rise. This uptick in wages could signal pickup pressure on labor costs, potentially impacting inflation.
EUR/USD Stabilises, Considers Trump’s Impact
EUR/USD is settling around 1.0785, assessing the market impact of this week's events. With Donald Trump’s return as US President, the market is recalibrating expectations around inflation and economic policies that his administration may reintroduce.
Trump’s protectionist stance could stir inflationary pressures, prompting the Federal Reserve to maintain higher interest rates than anticipated. This potential for elevated rates is boosting the dollar’s appeal.
Yesterday, the Federal Reserve cut interest rates by 25 basis points to 4.75% in line with market predictions. The Fed’s commentary suggested no deviations from its planned rate trajectory, hinting at continued easing.
Looking ahead, another rate reduction of 25 basis points is expected at the Fed’s December meeting, continuing its cautious but steady approach to monetary easing.
Technical analysis of EUR/USD
The EUR/USD pair has completed a bullish move towards 1.0820, as part of an ongoing upward impulse. Current market behaviour suggests a retracement to 1.0758 before resuming its ascent towards 1.0833. This outlook is supported by the MACD indicator, which, although below zero, is trending upwards, signalling a potential bullish continuation.
The hourly frame shows EUR/USD undergoing a corrective phase to 1.0758. Upon reaching this level, a rebound to 1.0833 is expected, followed by another potential pullback to 1.0758. The stochastic oscillator supports this outlook, with its signal line poised to rise towards 80, suggesting increasing bullish momentum.
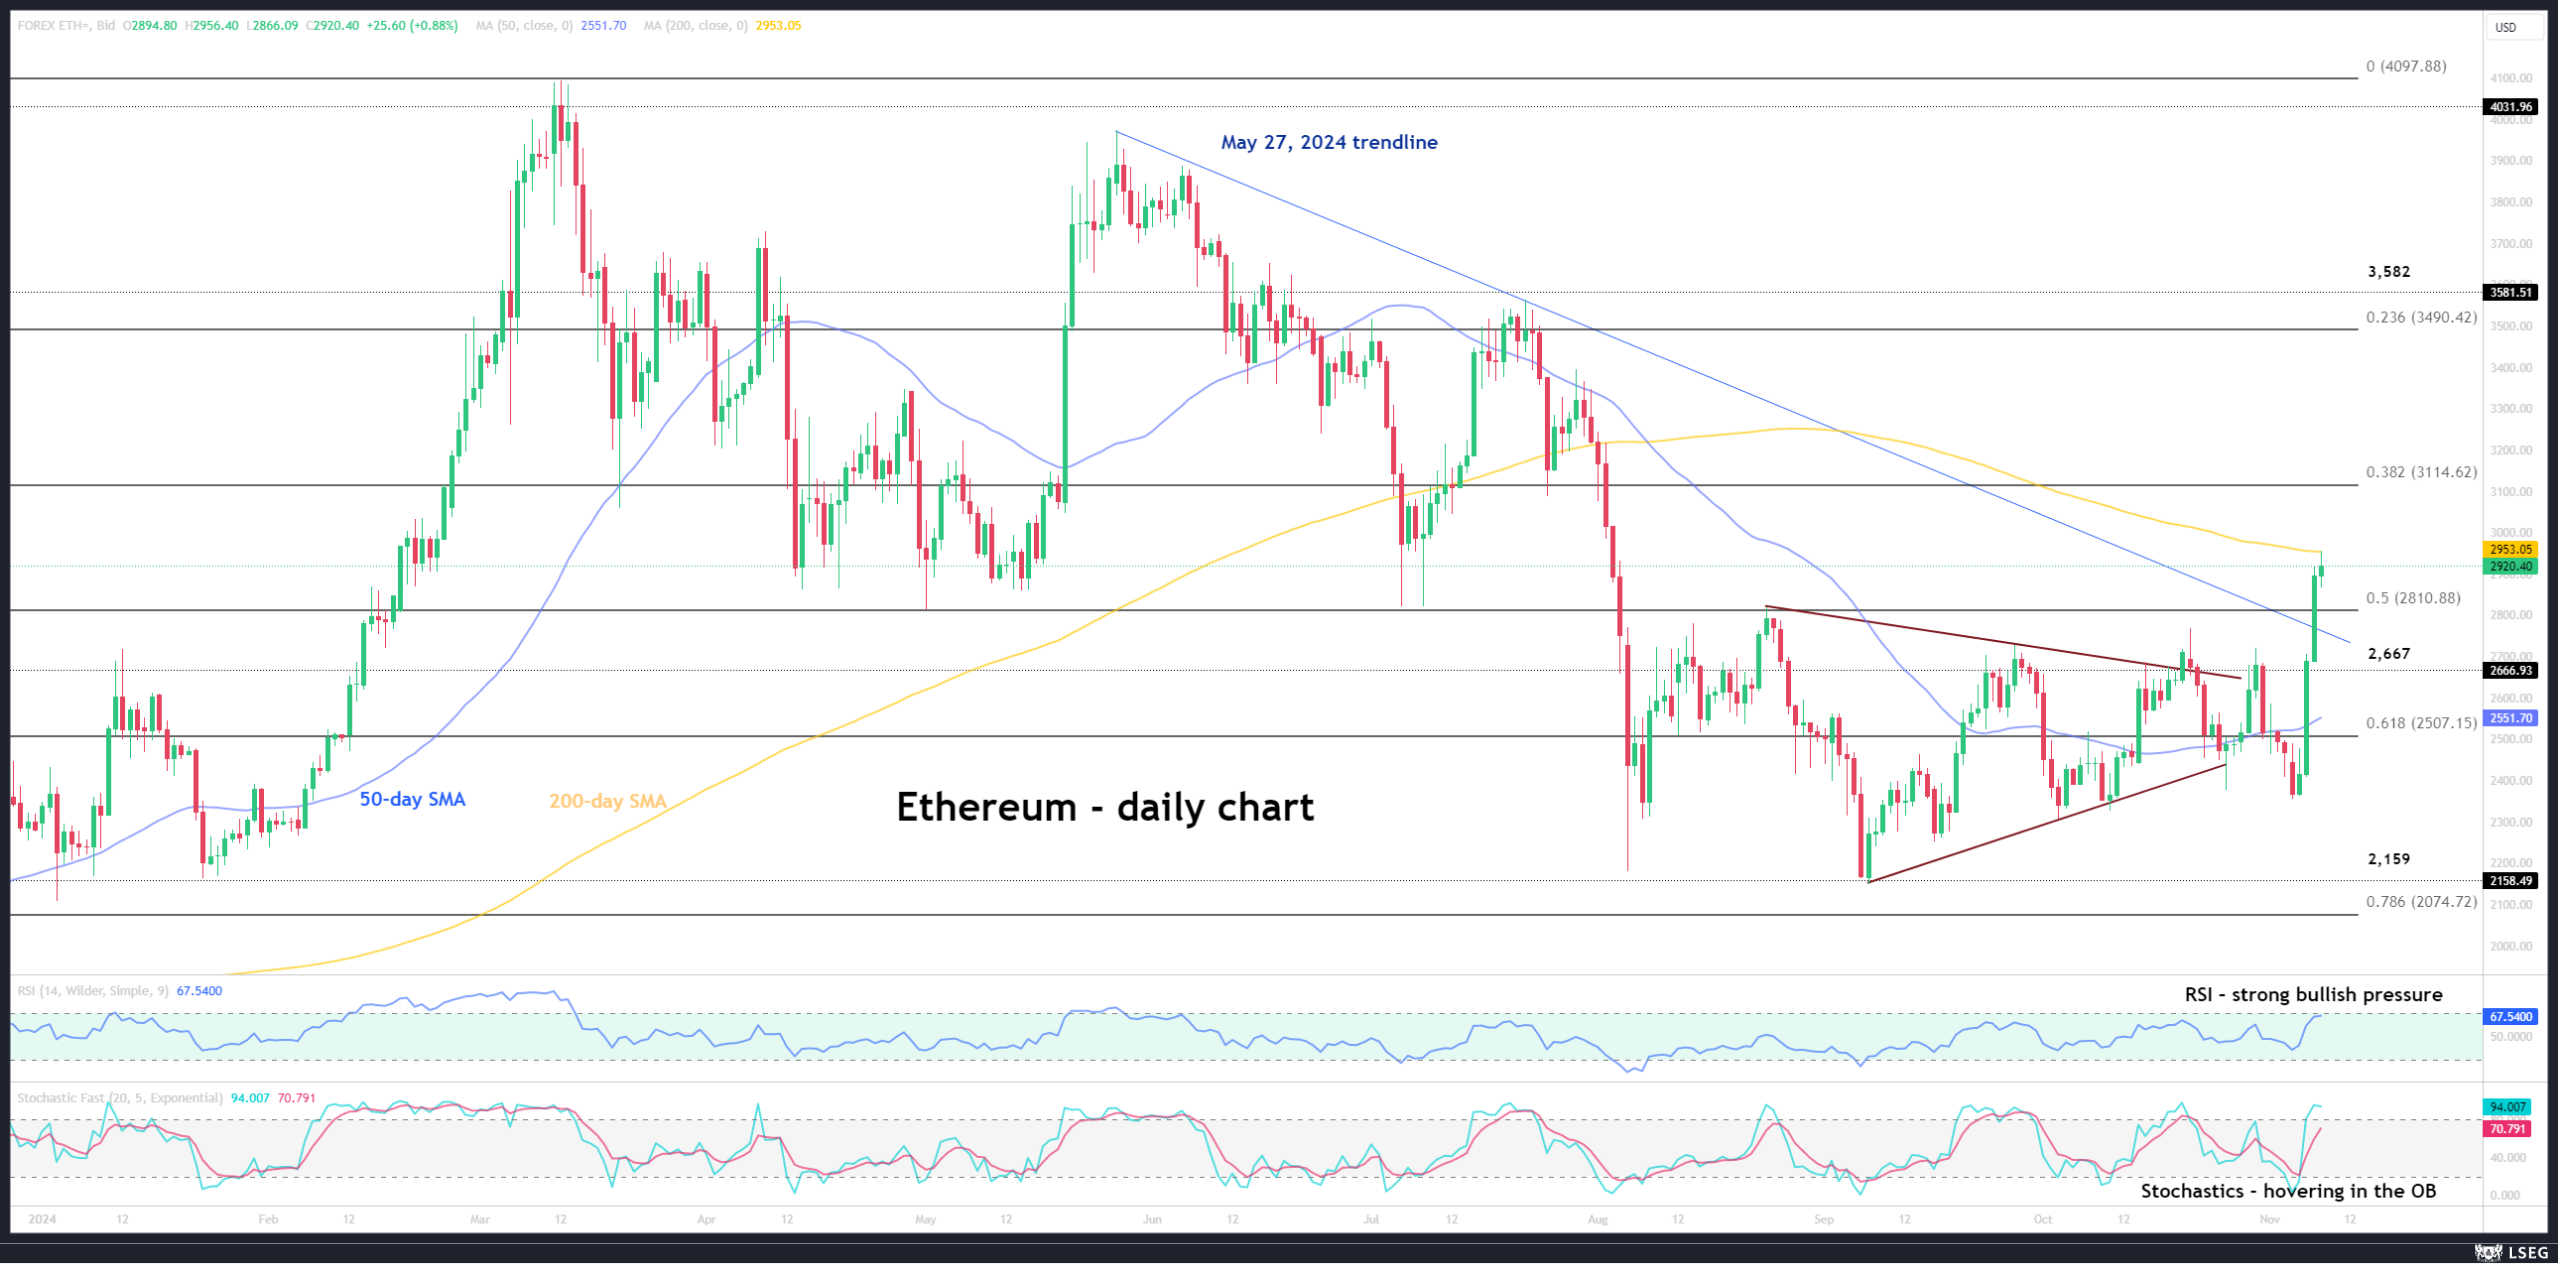
Ethereum Rally Stops At Key Resistance Level
- Cryptocurrencies benefit from Trump’s win
- Ethereum finds resistance at the 200-day SMA
- Momentum indicators confirm the bullish pressure
Ethereum has been benefiting from the outcome of the US presidential election by recording strong gains and returning above the 2,810 area for the first time since early August. It managed to overcome some key levels on its way higher, including the key May 27, 2024 descending trendline, with the rally pausing at the 200-day simple moving average (SMA). Contrary to bitcoin’s explosive rally in 2024, ethereum has yet to return to its March 2024 levels.
Meanwhile, the momentum indicators are bullish. The RSI has been climbing aggressively higher, thus confirming the strong bullish pressure in ethereum. Interestingly, the stochastic oscillator has returned to its overbought (OB) area and still maintains a good gap from its moving average. The stochastic oscillator could hover for a while in its OB region before signalling its readiness for a move lower, which would be a bearish signal.
Should the bulls remain confident, they would try to keep ethereum above the 50% Fibonacci retracement level of the October 13, 2023 – March 12, 2024 uptrend at 2,811, and then retest the resistance set by the 200-day SMA. If successful, the door would then be open for a move towards the 38.2% Fibonacci retracement level of 3,115, provided the bulls overcome the 3,000 level first.
On the other hand, the bears will try to regain the upper hand. A move below 2,811 could be the initial step for a more protracted move lower. Should they manage to push ethereum below the key May 27, 2024 trendline, the path could then be clear for a selloff towards the 2,500 area.
To conclude, ethereum has benefited from this week’s key events but it is now facing a key resistance level.
GBPJPY Fails to Challenge 200.00 Key Level
- GBPJPY retreats somewhat, but broader picture remains positive
- Momentum oscillators suggest declines
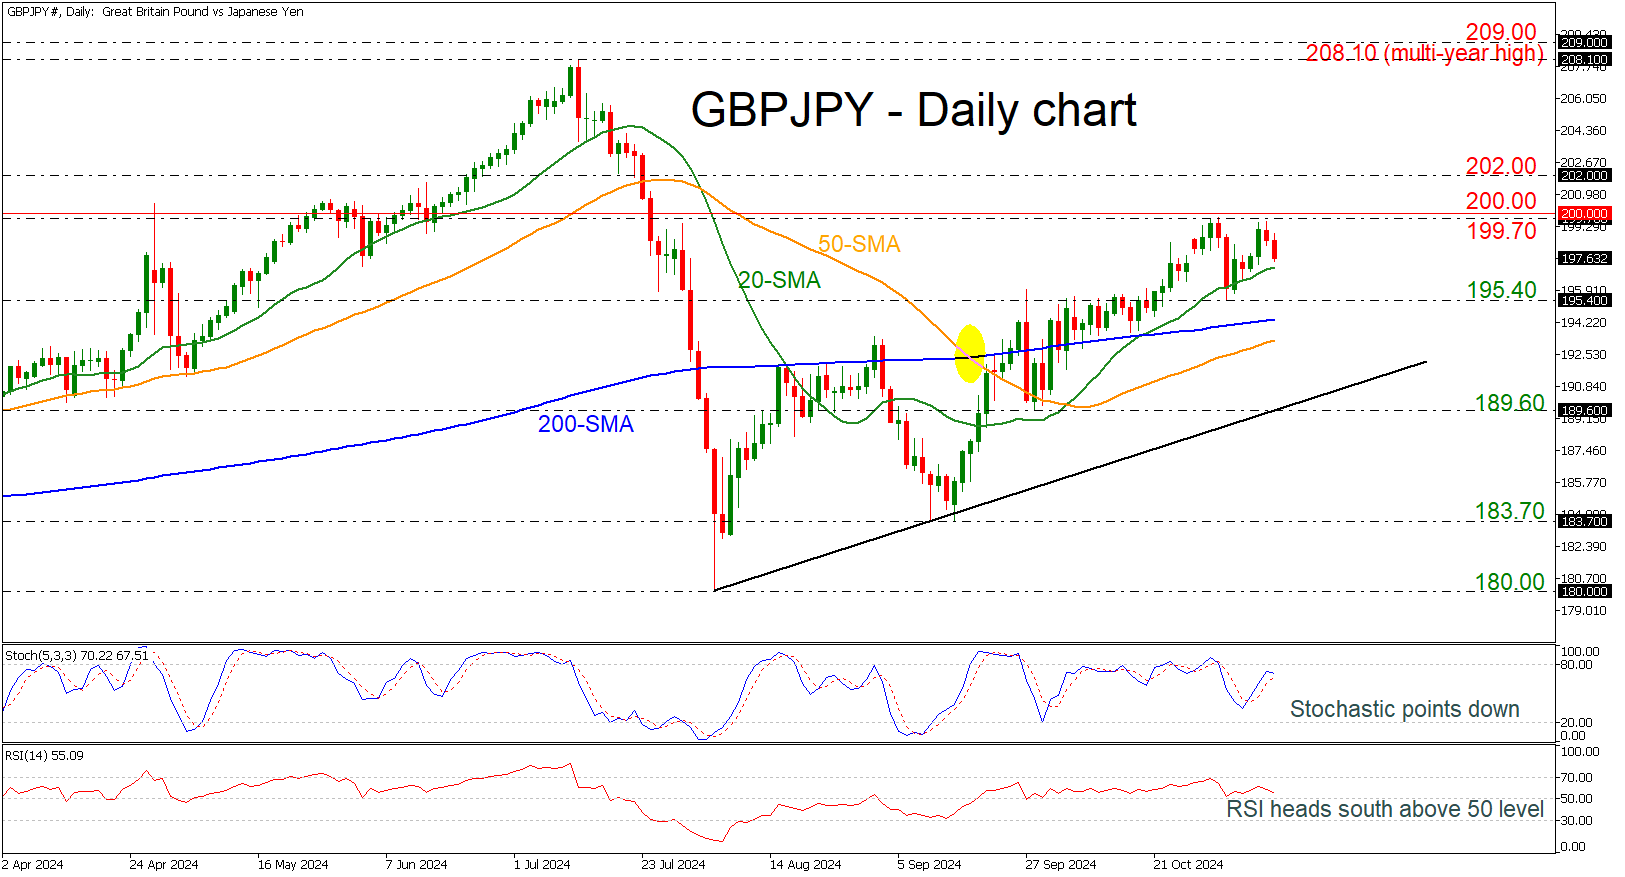
GBPJPY retreats after several attempts to touch the 200.00 round number, but the short-term bias remains positive.
From a technical perspective, there is a growing risk of a negative correction. The stochastic oscillator is pointing south, ready to post a bearish crossover, while the RSI is ticking down near the neutral threshold of 50.
If GBPUSD extends its rally above the 199.70 resistance, the 200.00 is the first point of call, after which attention would turn to the 202.00 handle.
However, should the price reverse, there could be some support at the 20-day simple moving average (SMA) of 197.20. Further down, the 195.40 mark could attempt to halt the decline ahead of the crucial support line of the 200-day SMA at 194.40. A breach of this line would shift the risks to the downside, meeting the 50-day SMA at 193.30 and the near-term uptrend line near 190.00.
In brief, there could be some further downside moves for GBPJPY in the short term before the rally continues to the upside. But the price needs to surpass the 200.00 key level to put the uptrend on a more sustainable footing, whereas a drop below the uptrend line would attract the bears.
AUD/USD: “Trump Trade” Overshadowed Cautiously Hawkish RBA, At Risk of Further Downside
- US President-elect Trump’s proposed policies may trigger a further upside movement on longer-term US Treasury yields.
- A break above the 4.49% on the US Treasury yield may see a further potential rally towards 5.20%.
- A further reduction of the 2-year and 10-year yield spread between the Australian government sovereign bonds and US Treasuries may put further downside pressure on the AUD/USD.
Among the developed nations’ central banks, the Australian central bank, RBA is the sole “lone ranger” (except Japan’s BoJ) that continued to defend its staunch “cautiously hawkish” guidance and kept its short-term policy interest rate unchanged at 4.35%, a 13-year high.
In the recent RBA monetary policy meeting that concluded on Tuesday, 5 November, RBA Governor Bullock reiterated that interest rates in Australia need to stay restrictive for the time being due to upside risks to services inflation.
Even though the labour market has softened, RBA does not see a massive sharp deterioration in underlying conditions. In addition, Australia’s core CPI has eased to 3.5% y/y in Q3 from its Q4 2022 peak print of 6.8%, but RBA’s latest forecast showed core inflation trend will likely only hit its 2-3% target by mid-to-late 2025.
Hence, market participants expect the RBA to only enact its first interest rate cut in either May or July next year, and based on the RBA Rate indicator as of 6 November that calculates a percentage probability of an RBA interest rate change based on the market-determined prices in the ASX 30-day interbank cash rate futures market suggests an implied interest rate cut of 47 basis points (bps) in total for 2025.
Relentless push-up in the 10-year US Treasury yield
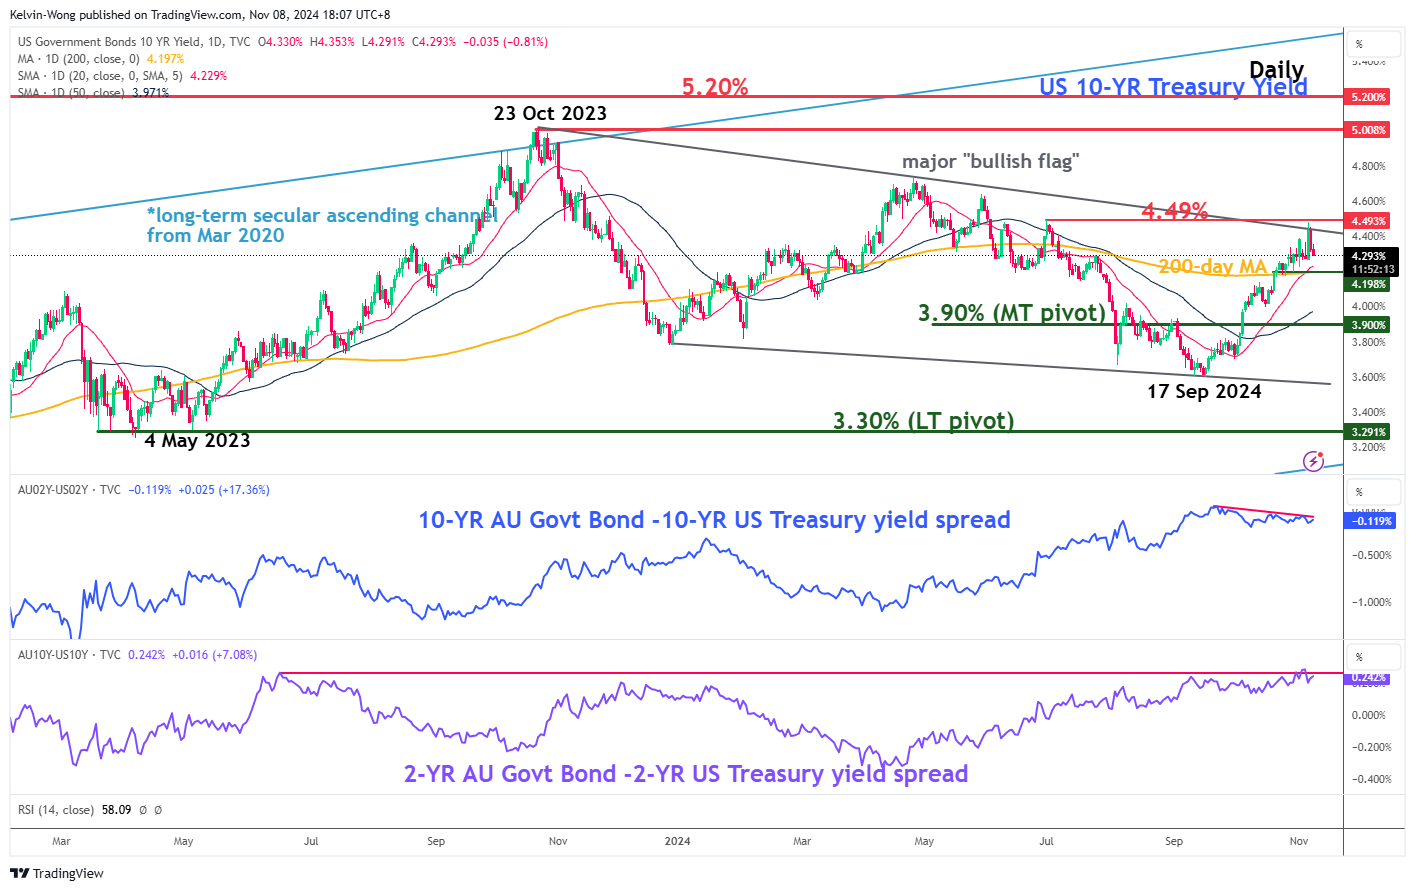
Fig 1: Medium-term & major trends of 10-year US Treasury yield with yield spreads of AU sovereign bonds/US Treasuries
(Source: TradingView, click to enlarge chart)
US President-elect Trump’s proposed deep cut on the corporation tax rate from 21% to 15% is likely to further increase the US budget deficit. In addition, the proposed higher trade tariffs on Chinese and the rest of the world’s imports may also revive inflationary pressure in the US economy.
The net effect of Trump’s campaign trail proposed policies is higher longer-term US Treasury yields which the bond vigilantes have responded to in the past four weeks.
The start of the current US Federal Reserve interest rate cut cycle on 18 September saw a jumbo 50 basis points (bps) cut on the Fed funds rate. In contrast, the longer-term 10-year US Treasury yield traded higher and rallied by 88 bps from its 17 September low of 3.60% to print a recent high of 4.47% on US presidential election day, 5 November.
A bullish breakout with a daily close above 4.49% on the 10-year US Treasury yield may see further upside to revisit the 5% to 5.20% major resistance zone which in turn can potentially assert downside pressure on the 2-year and 10-year yield spreads between Australian government sovereign bonds and US Treasuries (see Fig 1).
A reduction in these yield spreads may trigger further downside pressure on the AUD/USD
AUD/USD at risk of revisiting 0.6400/6360
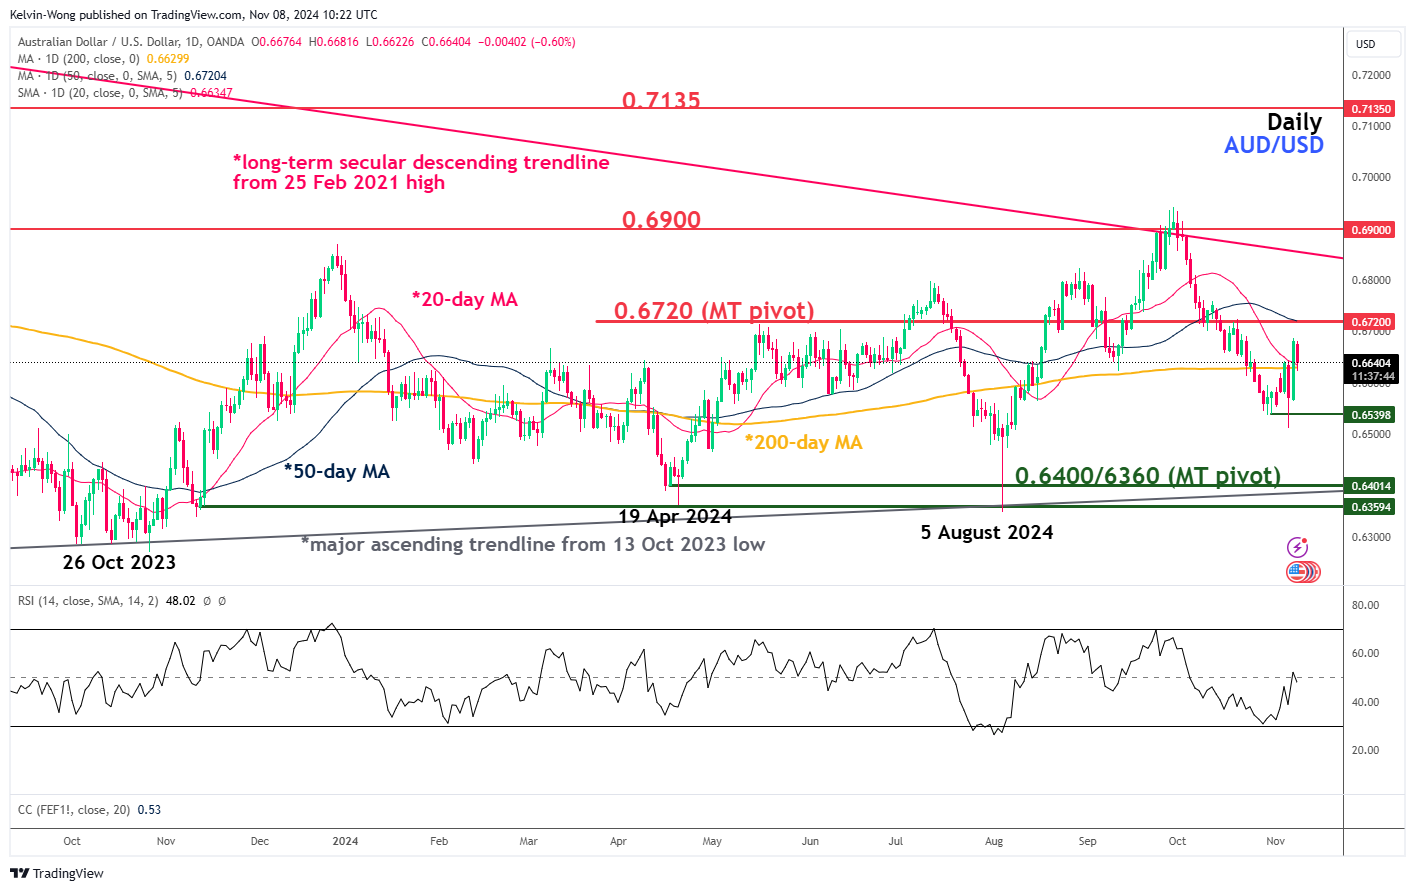
Fig 2: AUD/USD medium-term trend as of 8 Nov 2024 (Source: TradingView, click to enlarge chart)
The price actions of AUD/USD have continued to oscillate within a major complex sideways range configuration since its 13 October 2023 low of 0.6170.
After a test on the upper limit of the major range configuration at 0.6900 on 27 September, the AUD/USD started to decline toward the lower limit of the range, broke below its 50-day moving average, and traded below it since 14 October (see Fig 2).
Watch the 0.6720 key medium-term pivotal resistance. A break below the 0.6540 intermediate support may expose the medium-term pivotal support zone of 0.6400/6360 (also the major ascending trendline from the 13 October 2023 low).
On the other hand, a clearance above 0.6720 negates the bearish tone for a retest on the 0.6900 major resistance (also close to the long-term secular descending trendline from the 25 February 2021 high).
USD/CAD Eyes Canadian Jobs Report
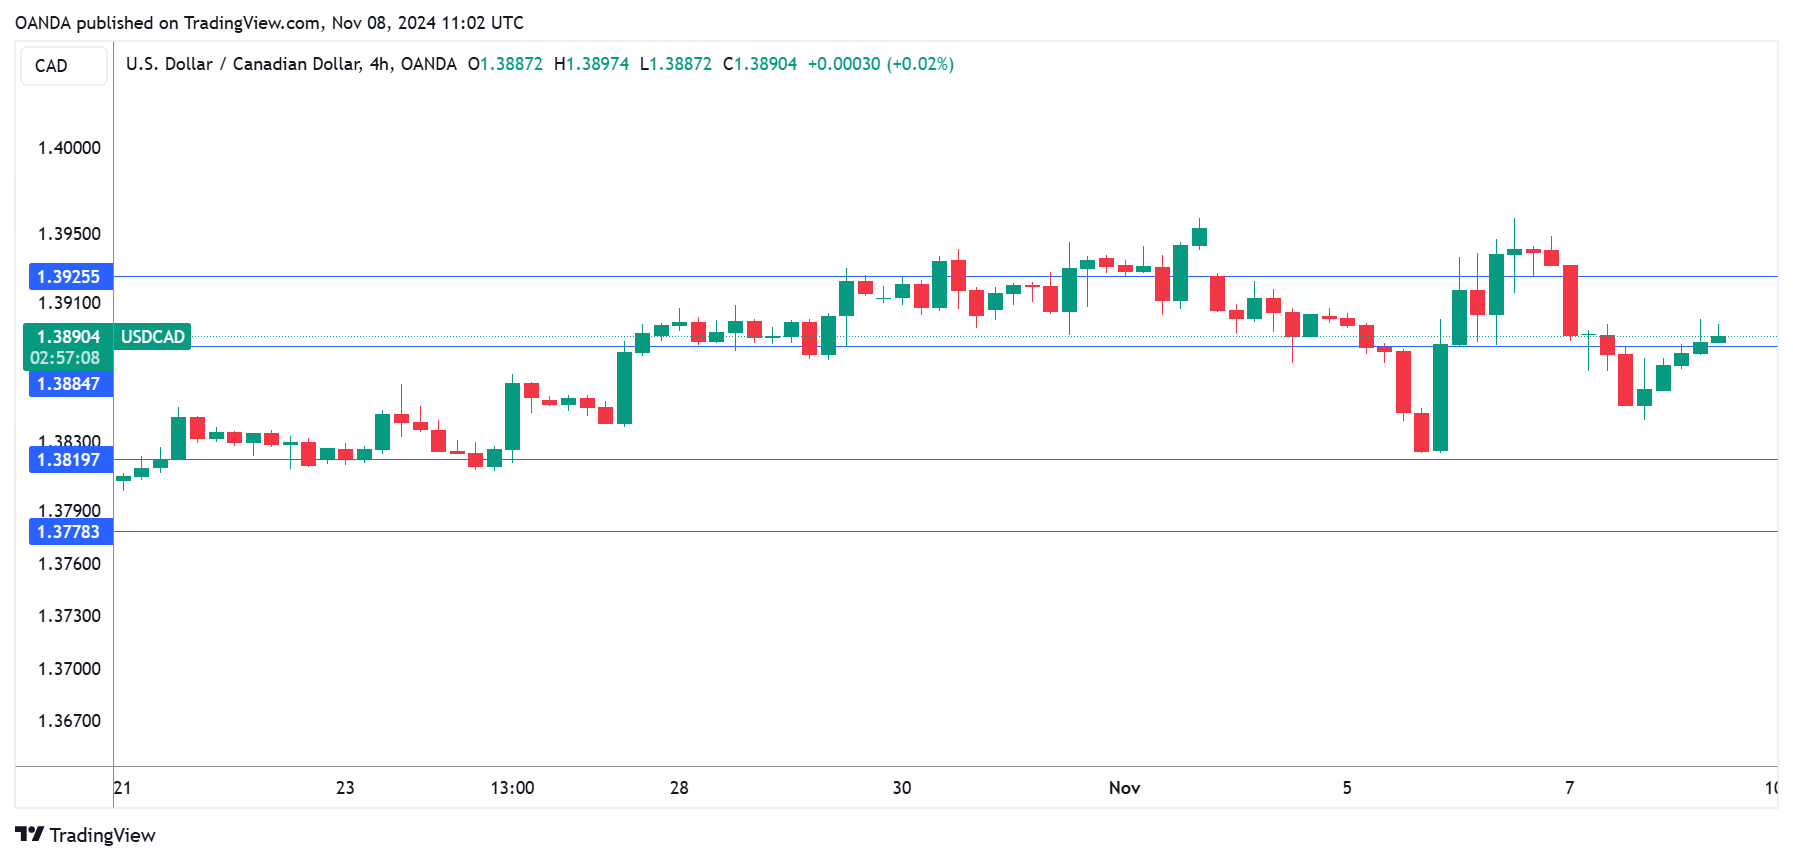
The Canadian dollar has steadied on Friday after a roller-coaster week. In the European session, USD/CAD is trading at 1.3889 at the time of writing, up 0.22% on the day.
Canada’s job growth expected to slow
With the tough battle against inflation largely won, the Bank of Canada has been a leader in the easing cycle among central banks, having cut rates three times this year. BoC policymakers are still keeping an eye on inflation but employment data is also in focus. The labor market has performed well despite high interest rates and a sluggish economy and the BoC needs the labor market to remain strong in order to ease the economy into a ‘soft landing’ and avoid a recession.
The September employment report was impressive as job growth jumped by 46.7 thousand, which was much higher than expectations. The October release is expected at 25 thousand and the unemployment rate is projected to creep up to 6.6% from 6.5%. If the forecasts prove accurate, it would point to a gradually weakening labor market, which would allow the BoC to continue cutting rates in modest increments of 25 basis points. The BoC holds its last rate meeting of the year on Dec. 11.
The Federal Reserve lowered the benchmark rate by 25-basis points on Wednesday. This is the second cut in the easing cycle after an oversized 50-bp chop in September. The move was widely expected and overshadowed by Donald Trump’s decisive and surprisingly easy win in the US election. The Fed plans to continue trimming rates but the size of the cuts will depend on the health of the economy, with employment and inflation data being the crucial factors which will determine the Fed’s rate path.
USD/CAD Technical
- USD/CAD is testing resistance at 1.3884. Above, there is resistance at 1.3925
- 1.3819 and 1.3778 are the next support levels
Japan’s Consumer Spending Slips, Yen Extends Gains
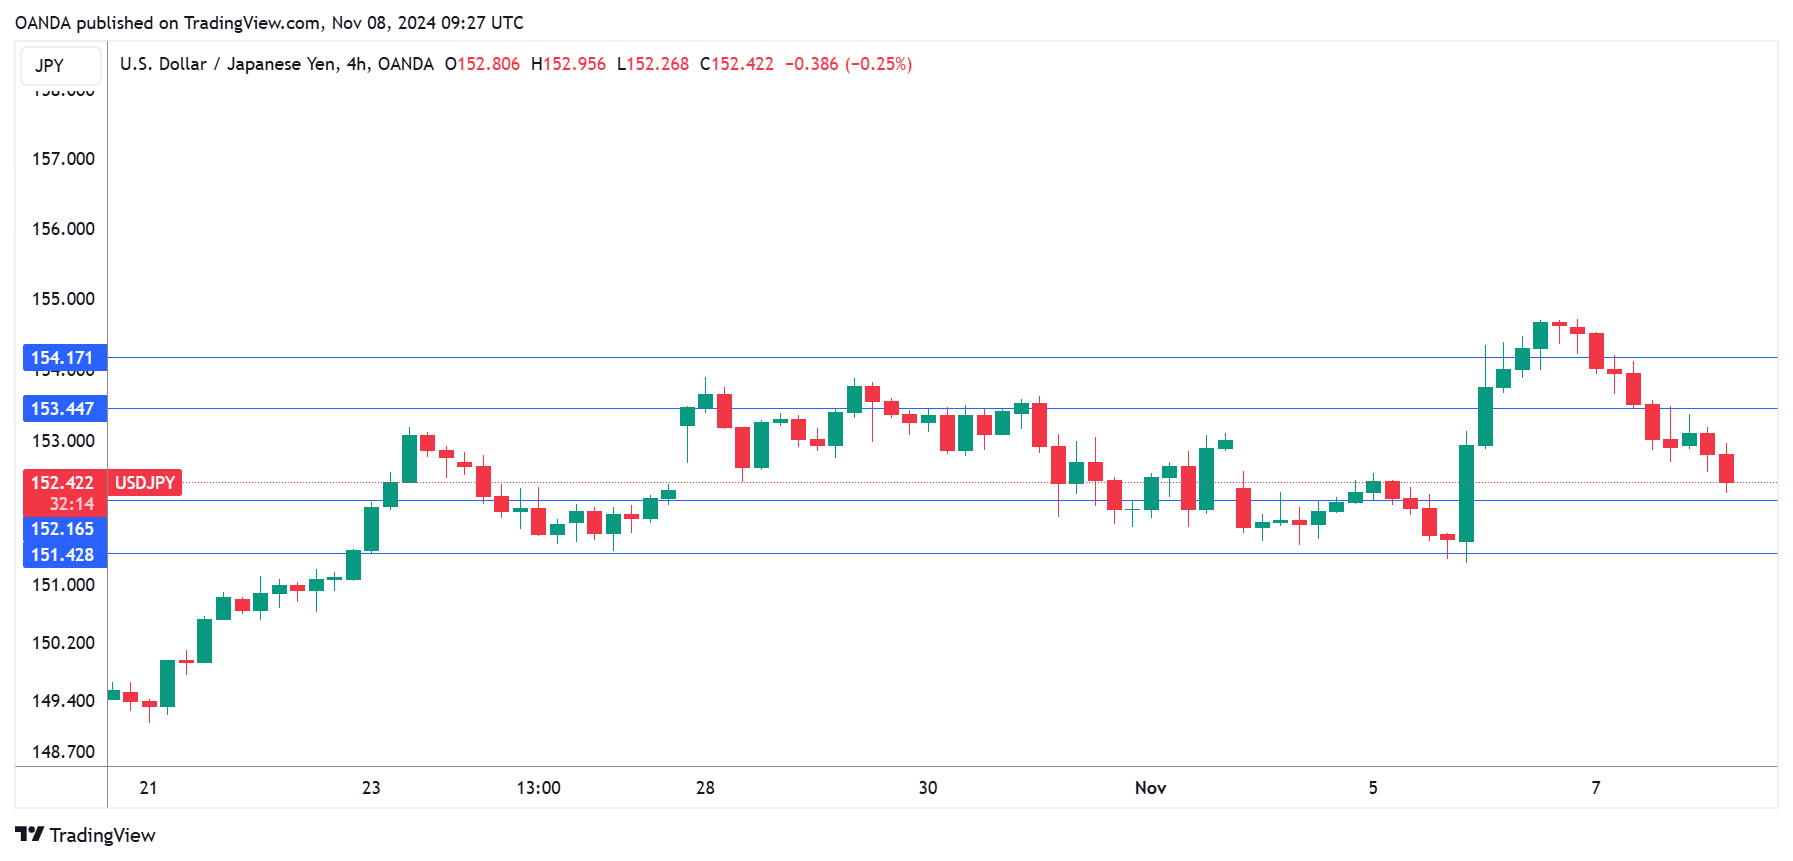
The Japanese yen has posted gains on Friday. In the European session, USD/JPY is trading at 152.38, down 0.36% on the day. The yen has taken traders on a roller-coaster ride this week, plunging 2% on Wednesday and rebounding on Thursday with a 1.1% gain.
Japan’s household spending declines 1.1%
Japan’s household spending fell by 1.1% y/y in September, following a 1.9% drop in August. This was better than the market estimate of -2.1%. Household spending has declined in 10 of the past 12 months, as consumer confidence fell in October and inflation is relatively high. On a monthly basis, household spending decreased 1.3%, after a strong 2% gain in August. This beat the market estimate of 0.7%.
The weak yen is also weighing on consumers, who are being squeezed as their purchasing power has fallen. The yen fell to three-month lows this week against the dollar and if the downswing continues, the Bank of Japan will be under pressure to respond with a rate hike.
Although consumers are holding tight on the purse strings, wages have been rising and the BoJ is hopeful that will translate into increased consumer spending and demand-driven inflation. Consumer spending makes up more than half of the economy and BoJ is unlikely to make further rate hikes until it sees stronger consumer spending. The markets don’t expect a rate hike until early 2025.
The Federal Reserve didn’t surprise anyone with a 25-basis point rate cut on Wednesday. This is the second cut in the easing cycle after an oversized 50-bp chop in September. The vote was unanimous and unlike the Bank of Japan, the Fed has been transparent and telegraphed its plan to cut rates ahead of the meeting. The Fed is expected to continue cutting rates in the coming meeting and will be keeping a close eye on inflation and employment reports.
USD/JPY Technical
- USD/JPY faces resistance at 153.44 and 154.17
- 152.16 and 151.43 are the next support levels
EUR/USD Outlook: Bears Hold Grip But Prolonged Consolidation May Precede Fresh Push Lower
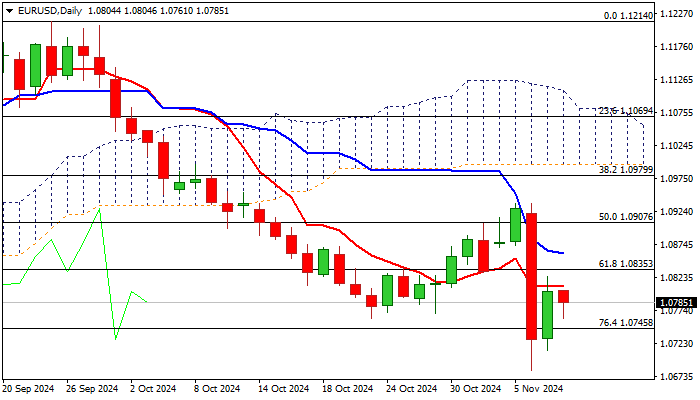
EURUSD weakened on Friday after recovery attempts from new multi-month low (1.0682), hit after Wednesday’s post-election 1.7% fall (the biggest daily loss since 19 Mar 2020), failed to clear daily Tenkan-sen (1.0809).
Formation of bull-trap pattern on daily chart adds to weak near term outlook as Wednesday’s massive bearish daily candle weighs heavily, technical studies remain in full bearish setup and converging weekly Tenkan/Kijun-sen are about to form bear-cross.
However, bears continue to face headwinds from a false break of Fibo support at 1.0745 (76.4% retracement of 1.0601/1.1214 ascend) with weekly close above this level to add to signals that bears are likely to consolidate before resuming the larger downtrend.
Long shadows on weekly candlestick contribute to scenario.
Near-term bias to remain with bears while daily Tenkan-sen caps, with potential extended upticks to be capped under pivotal 200DMA barrier (1.0868).
Res: 1.0835; 1.0848; 1.0869; 1.0907.
Sup: 1.0761; 1.0745; 1.0700; 1.0682.
Dollar Index Outlook: Markets Digest News from US Election /Fed Policy Outlook
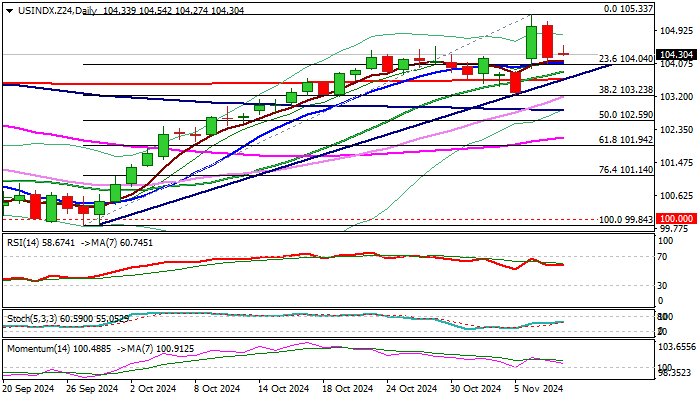
The Dollar Index is in a sideways mode on Friday morning after Thursday’s drop almost fully reversed post-election rally on Wednesday.
Near-term action ranging above the base of thick hourly Ichimoku cloud and expected to remain constructive above trendline support (103.72) and 200DMA (103.64).
The dollar stabilizes after volatile conditions from release of US election results and Fed rate decision, keeping overall bullish structure and on track for the sixth consecutive bullish weekly close.
Profit taking from post-election rally pushed the price lower, but relatively hawkish Fed rate cut is expected to further underpin the US currency.
Fed cut rates by 25 basis points as widely expected and Chair Powell signaled in his post-policy meeting speech that the central bank is starting to assess the new economic landscape after Donald Trump enters the White House.
Trump’s program will be mainly focused on the economy and faster growth is likely to fuel inflation that will require a review of Fed’s current stance on monetary policy.
Initial projections signal that fewer rate cuts and earlier than expected end of policy easing cycle would be likely scenario when plans of new administration start to materialize which would be overall supportive for the dollar in the near future.
Technical picture remains bullish on daily chart, but loss of positive momentum, with long upper shadow on weekly candlestick, overbought conditions on weekly chart and likely failure to register weekly close above cracked pivotal Fibo barrier at 105.13 (38.2% retracement of 114.72/99.20 downtrend) warn that bulls may be running out of steam.
Prolonged consolidation above trendline / 200DMA supports is seen as ideal scenario, in which bulls will consolidate and regain traction for fresh push higher, with sustained break above 105.13/33 pivots (Fibo / new four-month peak) to focus targets at 105.78 (June 28 high), 106.36 (May 1) and 106.90 (50% retracement).
Alternative scenario sees risk of deeper correction on loss of key supports at 103.72/64 (trendline / 200DMA) and 103.24 (Nov 5 higher low / Fibo 38.2% of 99.84/105.33 rally).
Res: 104.54; 104.83; 105.33; 105.87.
Sup: 104.05; 103.72; 103.64; 103.24.
Crypto Market Stands on Top
Market Picture
The cryptocurrency market is consolidating near the $2.5 trillion mark after pulling back slightly from the local peak. Judging by intraday performance, the market is undergoing a shakeout of positions as some players close positions related to the idea of a Republican victory. The market’s further momentum will depend on whether politicians continue to support crypto, which creates the risk of volatility.
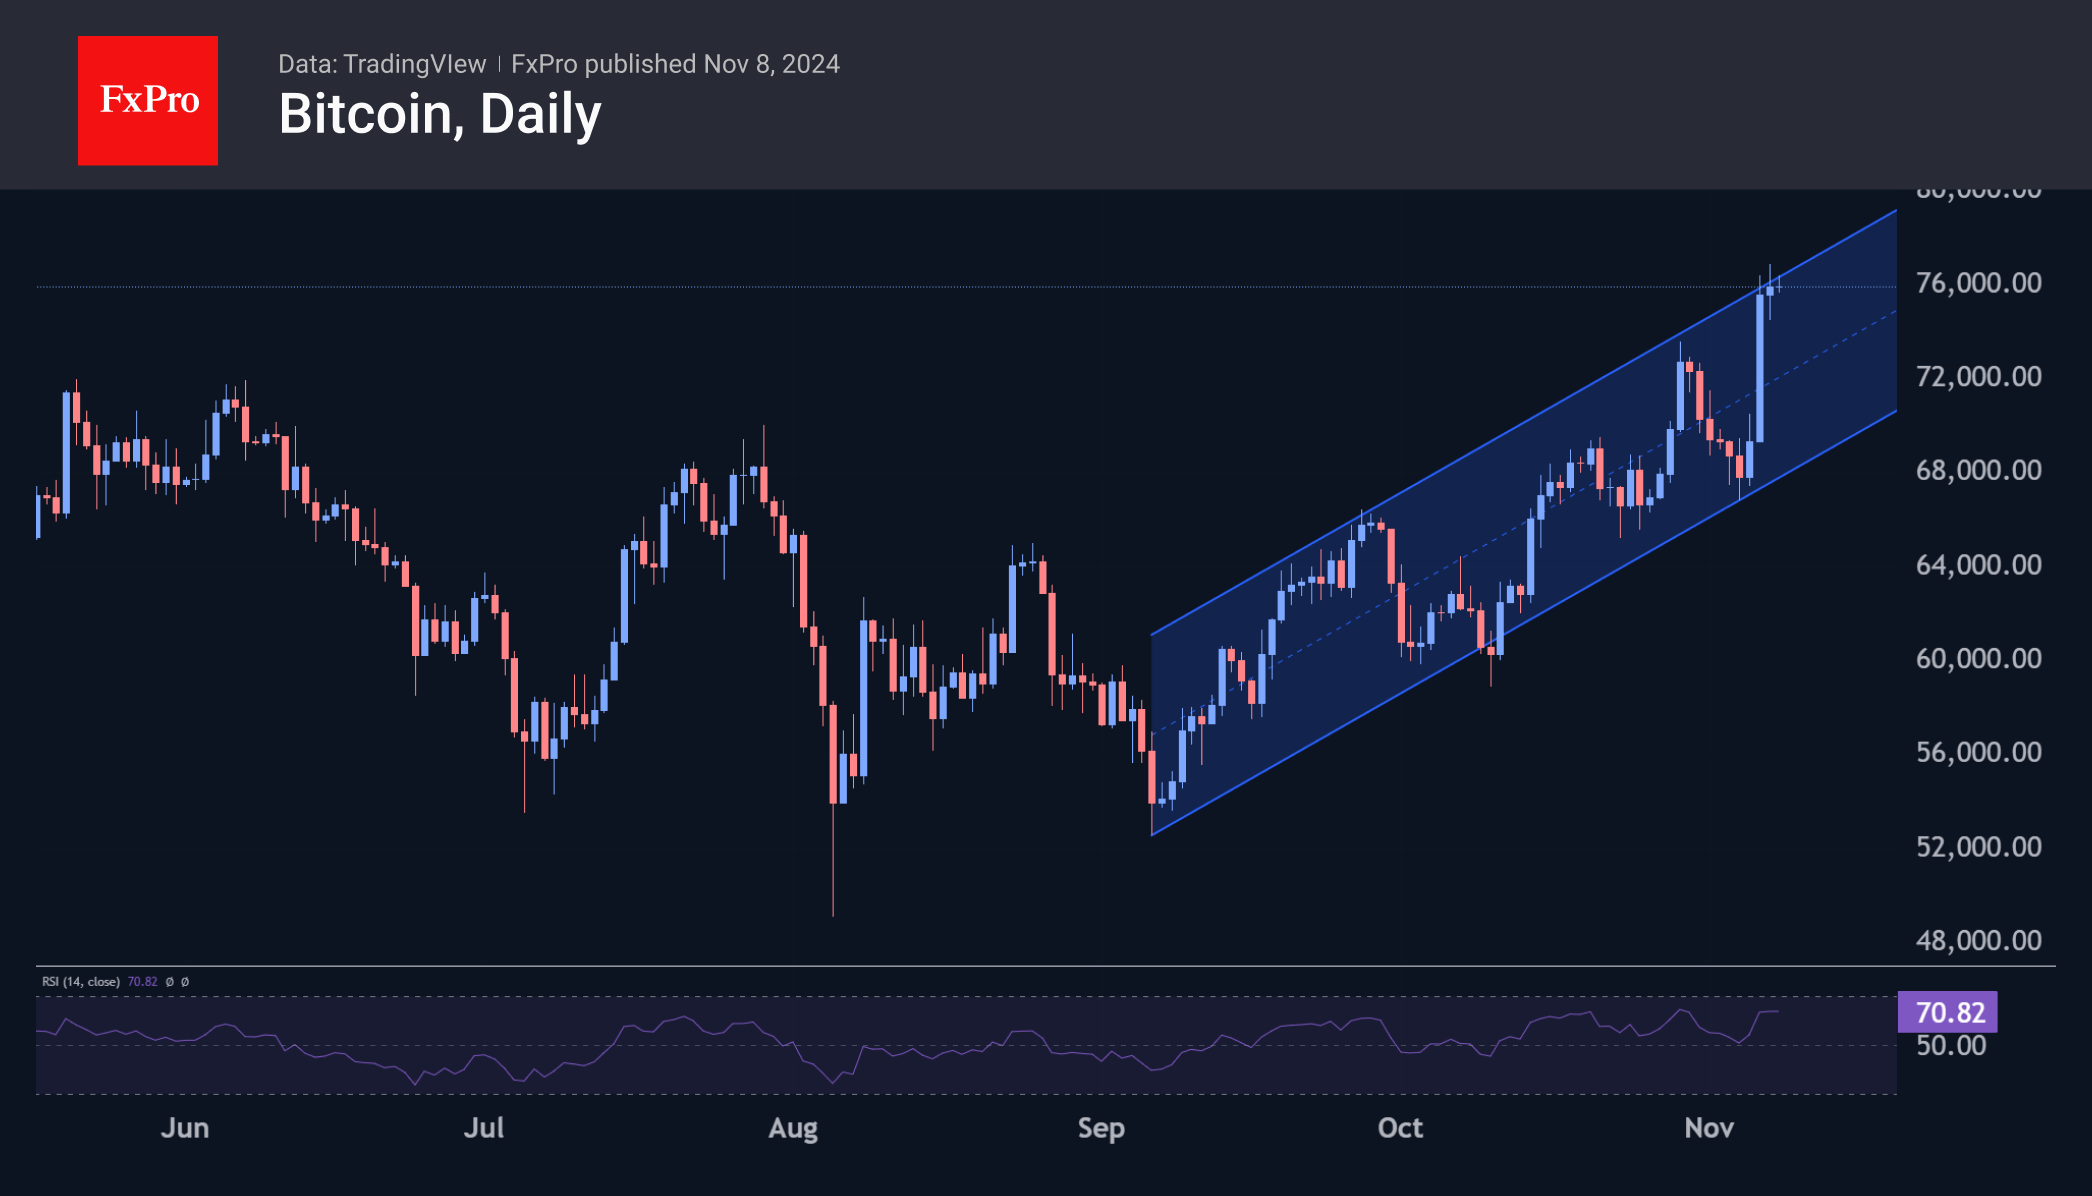
Bitcoin is hovering around $75.7K, close to the highs. This stabilisation in the 3% range is helping to blow off steam for short-term speculators who were closing in on the idea of a Trump victory. The technical picture has changed a little: Bitcoin is close to the upper boundary of the upward channel, which raises the risk of a corrective pullback. At the same time, after rising above 72, the first cryptocurrency has broken through the upper boundary, suggesting further growth.
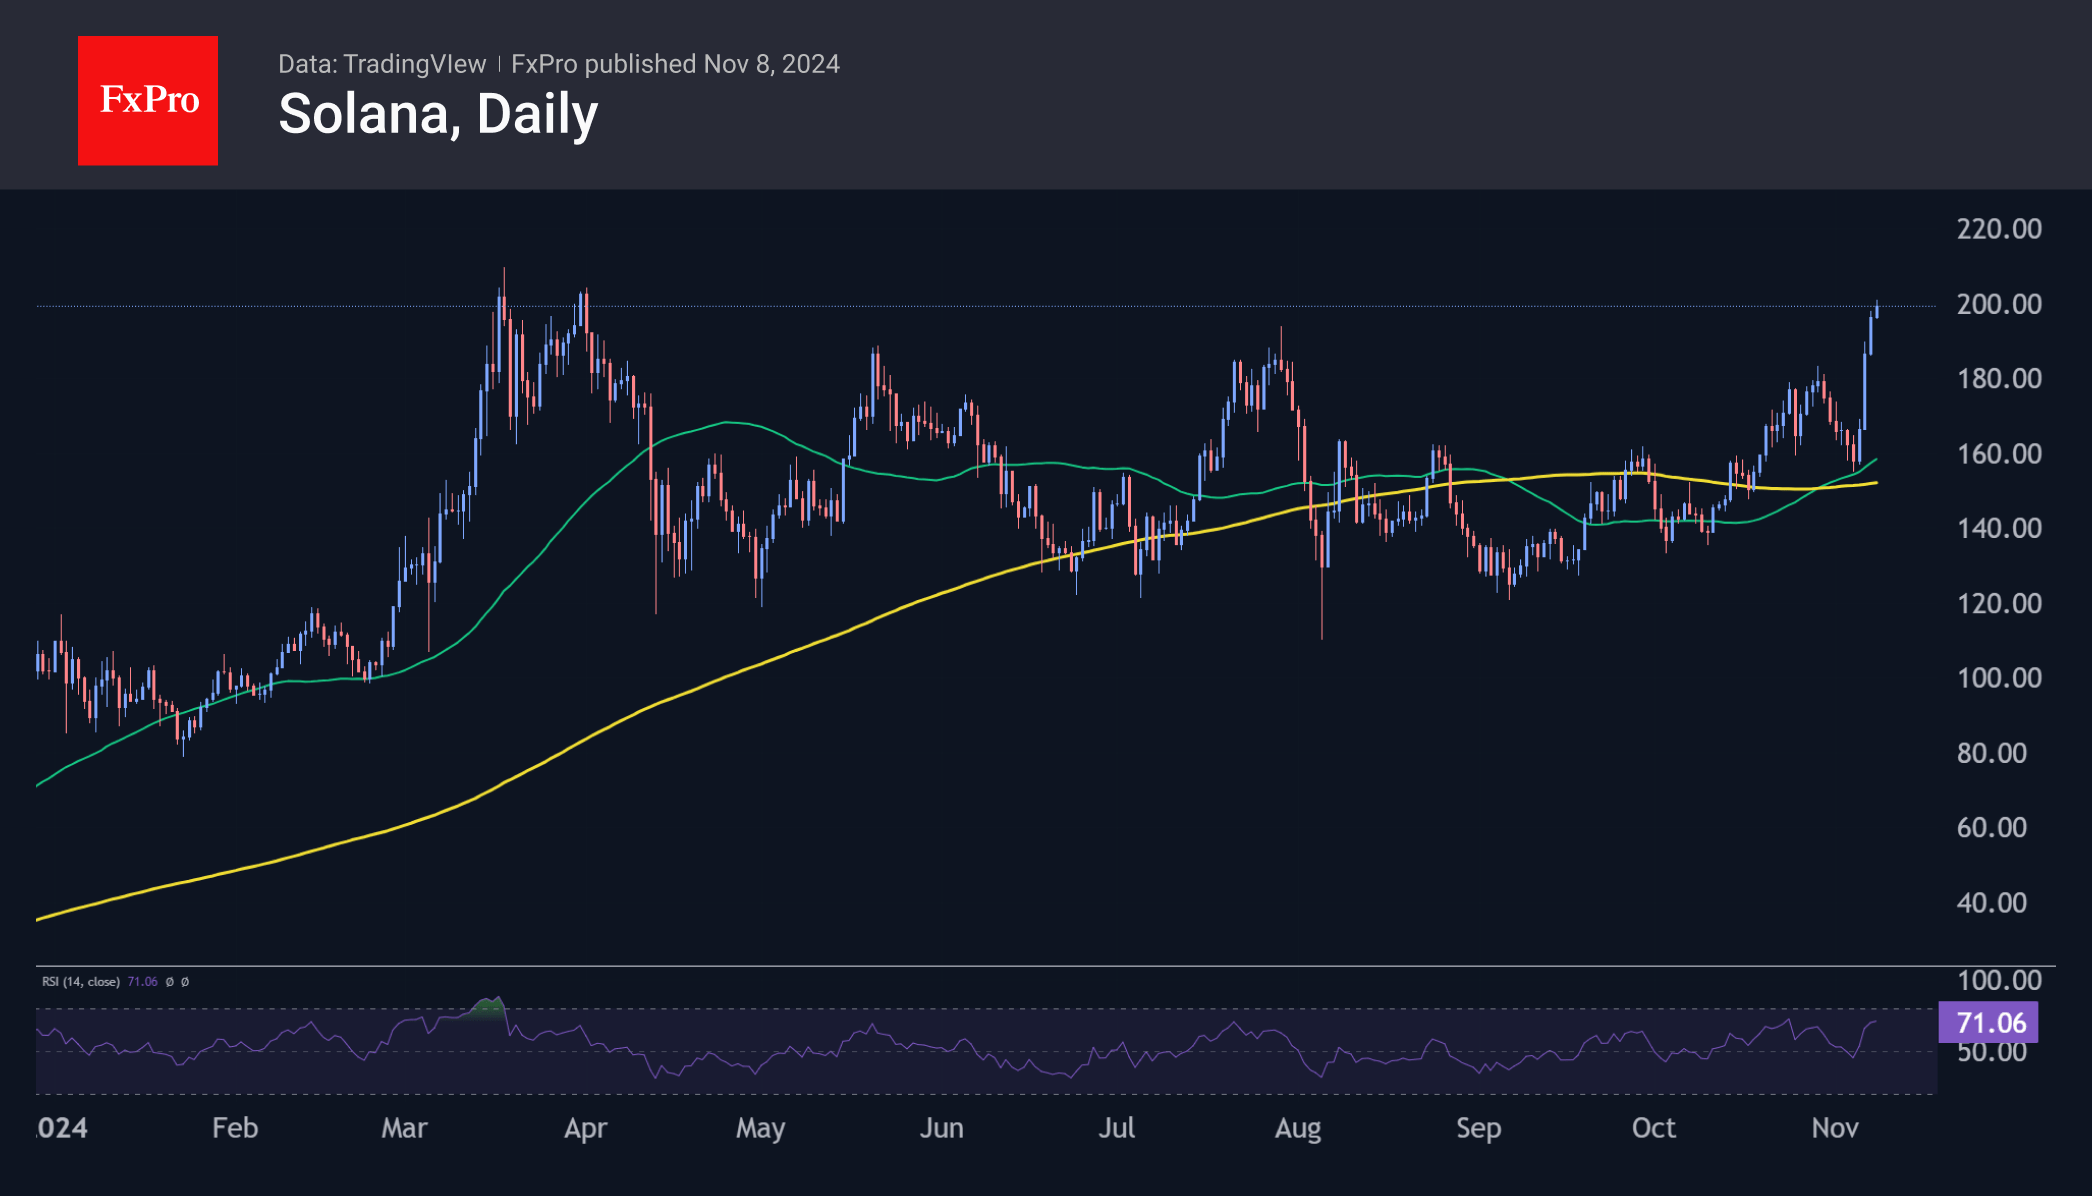
Solana is attempting to copy Bitcoin’s momentum this year, having reached the March highs. However, trading close to $200, it has yet to break through resistance. It is also still below the 2021 high of $260.
News Background
After updating its record in the wake of the US election, Glassnode believes that bitcoin can continue to grow thanks to fresh capital inflows. It has strengthened significantly since the beginning of September, suggesting a growing appetite for risk among investors.
According to CoinShares, Donald Trump’s administration is likely to create a more favourable environment for cryptocurrencies, including the passage of the Bitcoin Act. BTC could be approved as a strategic reserve asset, with the US government able to purchase up to 5% of the available issue.
Ethereum developers launched the first test network as part of the Pectra hardfork. The aim is to assess the impact of the EIP before the main network launches in the first half of 2025.
According to Lookonchain, the Ethereum Whale, which holds 398,891 ETH ($1.14 billion), has started selling assets after eight years of inactivity. On 7 November, it sold 13,400 ETH ($37.38m) against a backdrop of ETH rising to $2800.