
Sample Category Title
(FED) Federal Reserve Issues FOMC Statement
Recent indicators suggest that economic activity has continued to expand at a solid pace. Since earlier in the year, labor market conditions have generally eased, and the unemployment rate has moved up but remains low. Inflation has made progress toward the Committee's 2 percent objective but remains somewhat elevated.
The Committee seeks to achieve maximum employment and inflation at the rate of 2 percent over the longer run. The Committee judges that the risks to achieving its employment and inflation goals are roughly in balance. The economic outlook is uncertain, and the Committee is attentive to the risks to both sides of its dual mandate.
In support of its goals, the Committee decided to lower the target range for the federal funds rate by 1/4 percentage point to 4-1/2 to 4-3/4 percent. In considering additional adjustments to the target range for the federal funds rate, the Committee will carefully assess incoming data, the evolving outlook, and the balance of risks. The Committee will continue reducing its holdings of Treasury securities and agency debt and agency mortgage‑backed securities. The Committee is strongly committed to supporting maximum employment and returning inflation to its 2 percent objective.
In assessing the appropriate stance of monetary policy, the Committee will continue to monitor the implications of incoming information for the economic outlook. The Committee would be prepared to adjust the stance of monetary policy as appropriate if risks emerge that could impede the attainment of the Committee's goals. The Committee's assessments will take into account a wide range of information, including readings on labor market conditions, inflation pressures and inflation expectations, and financial and international developments.
Voting for the monetary policy action were Jerome H. Powell, Chair; John C. Williams, Vice Chair; Thomas I. Barkin; Michael S. Barr; Raphael W. Bostic; Michelle W. Bowman; Lisa D. Cook; Mary C. Daly; Beth M. Hammack; Philip N. Jefferson; Adriana D. Kugler; and Christopher J. Waller.
The Red Fork in the Road
We were already expecting loose US fiscal policy and higher interest rates across the curve on average than pre-pandemic. This week’s US election results push our view further in that direction.
It is the nature of event risk that, when it is finally realised, it closes off some potential futures and narrows down the remaining possibilities. As we flagged back in July, elections can be such an event risk. Schrödinger’s November box has been opened, and we now know that, not only did the cat turn out to be red, but it seems to be accompanied by two little red kittens called ‘Senate’ and ‘House of Representatives’.
We do not yet know exactly what the incoming Trump administration’s fiscal and trade policies will be, but we have a sense of the direction. Relative to the superposition of red and blue possible futures, fiscal policy will be at least a bit more expansionary. It will also be skewed more to tax cuts than spending, meaning that more of the extra demand will be private sector not public sector. Recall, though, that both parties were promising a continuation of the current large fiscal deficits. Fiscal consolidation was not on either side’s agenda. So the now-likely future is a difference at the margin from our earlier view, not a complete departure from it.
In addition, the proposed tariffs will lift the price level in the United States, boosting measured inflation for a time and raising the relative price of traded goods relative to non-tradeables.
We were already expecting that the global interest rate structure would be higher in the future than it had been in the period between the GFC and the pandemic. This has been a core part of our house view for some time. The large US fiscal deficits, which would have continued regardless of the election result, were among the factors underlying this view.
With one fork in the road now closed off, though, some further evolution of that view is in order.
At the margin, the expected demand impulse from the next Trump administration’s likely fiscal policy will be larger, and more inflationary, than our existing base case. Bond markets are already adjusting to this. The result is higher bond yields across the whole US curve. The US bond market’s dominant position globally means that most of this uplift also flows through to our view on Australian bond yields. Because Australia’s fiscal position is stronger than in the United States, we continue to expect the spread between Australian and US long yields to be narrower than historical norms.
Trump’s tax cuts and tariffs push the US inflation outlook up. This will take a while to come through, though, given that it will likely be well into 2025 before they are enacted. We have therefore not shifted our view of near-term path for the Fed funds rate. The Fed cut rates by 25 basis points at this week’s meeting as expected, and we continue to expect the Fed funds rate to reach its low point of 3.375% (midpoint) in the third quarter of 2025.
In contrast, we do think the outlook further out has shifted from our earlier expectations. Recall that we already expected the Fed funds rate to bottom out at a higher rate than implied by the FOMC ‘dot plot’, consistent with our view about the longer-run global interest rate structure. That view seems even more likely given recent developments. Further, we now think it likely that the Fed will start hiking rates in the second half of 2026, in response to rising inflationary pressures. While it is too soon to know what Trump’s immigration policies imply for US population and labour supply, and so the domestic cost base, a shift here is likely to reinforce the inflationary implications of Trump’s other signature policies.
We do not see the same inflationary impulses in Australia, especially given that rising labour force participation here has been a positive for labour supply and is likely to remain so for a while. In addition, the impact of tariffs on China could be indirectly negative for Australia, given its importance as a destination for our exports. Against that, though, we need to be mindful that China is likely to respond to any negative external shock with additional stimulus targeting the consumer and residential investment, lifting commodity demand. We would also see Australia as one likely destination for all those cheaper manufactured goods that a tariff-bound United States no longer demands. This implies some downside risk for the relative price of goods relative to services in Australia, and to inflation more broadly. We have therefore not revised our view on the RBA cash rate in light of Trump’s victory.
The relative shift in rates suggests a stronger US dollar, and so we have flattened the slope of the expected appreciation of the AUD (and NZD) against the USD accordingly. Relative purchasing power tends to be the centre of gravity that exchange rates revert to over the 3–5 year horizon, but it now seems that this will take longer than we previously assumed.
FOMC Focused on Health of Labour Market and Success with Inflation
Unsurprisingly, the FOMC made clear it was too early to assess the economic implications of this week’s US election. Activity and prices meanwhile justify a gradual withdrawal of policy tightness.
The US FOMC delivered a 25bp cut at its November meeting as expected, taking the mid-point of the fed funds range to 4.625%. Overall, the Committee's view on the outlook remains constructive. Labour market conditions "have generally eased, and the unemployment rate has moved up" but it "remains low". Economic activity has also “continued to expand at a solid pace”. On inflation, progress has been made towards “the Committee's 2 percent objective though [it still] remains somewhat elevated."
Risks to the outlook are seen as being "roughly in balance"; however, the Committee made clear they intend to continue "carefully assess[ing] incoming data, the evolving outlook, and the balance of risks". Clearly it is too early to assess, let alone react to, the policy/ economic developments that may ensue from this week’s US election – more below.
In the press conference, Chair Powell reiterated the statement’s key messages, in particular noting that the labour market is now less tight than it was prior to the pandemic despite continued job gains. The labour market is consequently not seen as a concern for inflation, while supply across the economy is also assessed to have improved over the past year. These developments allow the FOMC to reduce their restrictiveness at a measured pace even as GDP growth remains above trend.
On this week’s election specifically, Chair Powell made clear that, in the near term, the outcome will have no effect on monetary policy. It is only over time, as policy is committed to and implemented, that the economic implications become clear and any monetary policy response can be decided upon. The December FOMC meeting will be the first opportunity for Committee members to update their forecasts; however, this will be more than a month before even inauguration takes place, let alone when the President-elect and new Congress begin to debate policy.
Regarding financial conditions, while assessed continually, for monetary policy it is the materiality and persistence of any change that matters. Reading between the lines of Chair Powell’s remarks, with several points of uncertainty affecting markets and the economy, it is too early to assess the sustainability, let alone the consequences, of recent fluctuations in interest rates and equity prices.
A few comments were also made in response to questions on inflation’s progress to target. Chair Powell was clear that non-housing services inflation and goods inflation were currently consistent with headline inflation at target. Further, housing inflation was being held up by past agreements not current market dynamics, with rent increases agreed for new contracts instead negligible. A continuation of these trends will see headline inflation sustainably at target within the forecast horizon, particularly given the labour market is not currently inflationary and is susceptible to softening further.
All told, the FOMC is mindful of evolving risks, but feels justified to continue reducing the restrictiveness of monetary policy at a measured pace into 2025. Arguably their net assessment of economic risks is now modestly skewed down given the confidence the Committee have in the inflation outlook and reason for caution over labour market momentum. We see these views as consistent with our forecast for 25bp rate cuts at the December, January and March meetings, followed by one cut per quarter to September 2025. That would leave the fed funds rate at 3.375%, modestly above the FOMC’s longer-run neutral rate forecast of 2.9% but broadly in line with our own view of this metric. Inflationary risks related to this week’s election are instead likely to become apparent in late-2025 and 2026, assuming policy mooted by President-elect Trump is passed and implemented.
Fed Continues To Dial Back Policy Restraint via 25 bps Rate Cut
Summary
- As widely expected, the FOMC cut rates by 25 bps at today's policy meeting. The decision was unanimous.
- The Committee noted that progress has been made in returning inflation to its target of 2% and that the risks of achieving its goals of price stability and full employment are roughly balanced.
- Despite 75 bps of rate cuts since the September 18 policy meeting, the stance of monetary policy remains restrictive. That is, the real fed funds rate remains above most estimates of "neutral." Therefore, we look for the FOMC to ease policy further at upcoming meetings.
- In our view, the FOMC will not react to potential policy changes that could be implemented by the incoming Trump administration until those policies are more fully formed. If, however, tariffs or other fiscal policies were to cause inflation to move higher next year, then we believe the nominal fed funds rate would not fall all the way toward 3%, as we had forecasted prior to the election.
Progress on Inflation and Balanced Risks Lead to Rate Cut
As widely expected, the Federal Open Market Committee (FOMC) decided at its policy meeting today to reduce the target range for the federal funds rate by 25 bps to 4.50%-4.75%. After peaking at a range of 5.25%-5.50%, the FOMC has now cut rates by 75 bps since September (chart). The decision to cut rates by 25 bps today was unanimously supported by all 12 voting members of the Committee. Federal Reserve Governor Michelle Bowman dissented at the September 18 meeting when the FOMC reduced the target range for the fed funds rate by 50 bps. Governor Bowman preferred a rate cut of only 25 bps at that meeting.
The statement that the FOMC released after its meeting today is similar to the one that it released on September 18. That is, the Committee noted in today's statement that "inflation has made progress toward the Committee's 2 percent objective." In that regard, the PCE deflator, which is the Fed's preferred measure of the rate of consumer price inflation, was up only 2.1% on a year-ago basis in September (chart). Furthermore, the FOMC judges "that the risks to achieving" its dual mandate of price stability and full employment "are roughly in balance." Therefore, "in support of its goals" the FOMC decided to cut rates by 25 bps today.
Stance of Policy Remains Restrictive Despite Recent Rate Cuts
Recently released data show that real GDP was up at a solid rate of 2.7% on a year-ago basis in Q3-2024 and that the unemployment rate was only 4.1% in October. If the economy is doing so well, why cut rates at all? The reason is that the stance of monetary policy, as measured by the real fed funds rate (i.e., the nominal rate minus the underlying rate of inflation) is restrictive at present. Indeed, Chair Powell noted the restrictive stance of policy in his post-meeting press conference. The "neutral" real fed funds rate, which is the real interest rate that neither stimulates the economy nor restrains it, is unobservable. However, most analysts estimate that the neutral real rate is somewhat around 1%. With the real fed funds rate currently above 2% (chart), Federal Reserve policymakers apparently judged that they needed to dial back the degree of policy restraint via a cut to the nominal fed funds rate. Otherwise, they risk a significant deceleration in economic activity, which could push up the unemployment rate by more than most Fed officials would feel comfortable.
The final FOMC meeting of 2024 will be held on December 18, and our current forecast looks for another 25 bps rate cut at that meeting as the FOMC "feels" its way back toward neutral. As we noted in a recent report, however, the sharp increase in tariff rates that the incoming Trump administration may levy on many of America's trading partners could lead inflation to move higher after their implementation. In our view, the FOMC will not make a policy decision at its upcoming meeting based on what it thinks the incoming administration may do. Rather, the Committee will wait until policies are more fully formed and their effects better understood before reacting, if appropriate, with its own response. Our most recent forecast, which was compiled before the election, looked for the FOMC to cut its target range for the fed funds rate to 3.00%-3.25% by the end of 2025. (We do not make assumptions about the outcomes of elections until the ballots are counted). But if the incoming Trump administration does indeed levy significant tariffs or adopt other inflationary policies, then we believe the fed funds rate may bottom out next year closer to 4% than to 3%.
Fed Review: In a Good Place After All
- The Fed cut rates by 25bp in its November meeting, as widely expected.
- Powell delivered practically no new policy signals. Despite the political uncertainty, Powell affirmed that the Fed remains in a good place with cooling inflation and still stable economy.
- Market reaction was minimal. Markets price in around 65-70% probability of the Fed delivering another 25bp cut in the December meeting. We make no changes to our call and still expect cuts to continue in every meeting towards H1 2025.
While all eyes have been on Trump's election win this week, and focus has turned to his expansionary and potentially inflationary fiscal policy plans, the Fed is not yet overly concerned. Powell made it clear that the election result will not have any near-term policy impact even if in the longer run, fiscal policies can of course affect the economy. For the time being, as long as we know very little about policy change details, there is simply 'nothing to model'. On a more personal note, when asked if he would resign if requested to do so by Trump, Powell's answer was a very firm 'no'.
In the middle of all the political uncertainty, the Fed remains in a good place. Economy is on a solid footing, inflation continues to cool and labour markets are no longer a source of inflation. Powell noted that incoming data has generally been somewhat stronger than expected in the September meeting and that downside risks have eased, but avoided discussing how this could impact rates outlook for the December meeting and beyond.
Powell emphasized that all options remain on the table going forward, including faster cuts if labour markets weaken unexpectedly, but also slowing down the pace of easing if the Fed estimates it is approaching neutral faster than thought. The Fed is paying close attention to inflation expectations and Powell mentioned he had taken note of the recent uptick in market-based expectations following the election results. That said, the current 5y5y forward rate (2.55%) remains very close to the longer-run target when adjusted for the historical average spread between CPI and PCE inflation measures (0.3-0.4%). In addition, most consumer and business survey-based measures have returned very close to the Fed's target.
While we agree that the US economy is not in a dire need of easier monetary conditions, we also think the Fed has no reason to delay its return toward neutral any longer. Current ratio of job openings to unemployed job seekers remains below pre-pandemic levels and while layoffs remain low for now, the number has continued to edge higher. When labour markets are on a cooling trend, and forward-looking inflation measures are near target, the Fed is likely to continue cutting rates at steady 25bp intervals in the coming meetings.
If Trump's policy plans spark a more persistent uptick in inflation expectations, a pause in December could be warranted. In addition, if more expansionary fiscal policies suggest the neutral rate will shift higher, then we think the Fed could end the easing cycle short of our current terminal rate forecast (3.00-3.25%). Markets price in 30-35% probability for a pause in December, but for the time being, we make no changes to our Fed call.
Bank of England Review – Gradual Easing Supports a Stronger GBP
- At today's monetary policy meeting the BoE cut the Bank Rate by 25bp to 4.75%, as was widely expected.
- In line with our view, the BoE delivered a hawkish twist to its guidance emphasising their gradual approach to reducing the restrictiveness of monetary policy. We think this supports our base case of the next cut coming in February.
- The market reaction was modest with Gilt yields tracking slightly higher and EUR/GBP moving lower.
As expected, the Bank of England (BoE) decided to cut the Bank Rate by 25bp to 4.75%. The vote split was 8-1 in line with our expectation, with the majority of members voting for a cut and hawk Mann voting for an unchanged decision.
The BoE retained much of its previous guidance noting that "a gradual approach to removing policy restraint remains appropriate". From the minutes it was evident that this "gradual approach" increasingly is becoming the consensus view within the MPC. In line with our expectation the BoE revised its inflation and growth forecast higher following the fiscal announcement last week, which delivered a notably more expansive fiscal stance than assumed in the latest round of BoE forecasts from August. The BoE now sees CPI at 2.7% y/y (prev. 2.2%) and GDP at 1.7% y/y (prev. 0.9%) in Q4 2025. While we still think only a gradual cutting cycle is warranted, amid the inflationary boost from the fiscal policy announced, we highlight that the new forecasts were done with a market implied Bank Rate path from prior to the Budget announcement. This is important as this path was notably lower than current pricing, which in turn means that the upward revisions above should be taken with a pinch of salt.
Overall, we think the communication today supports our call of a more gradual approach to the cutting cycle. We expect the next 25bp cut in February with the Bank Rate ending the year at 4.75% in 2024 and 3.25% in 2025.
Rates. Gilt yields initially moved higher across the board on the hawkish twist to the statement but partly retraced the move during the press conference - also aided by the global fixed income rally. Overall, the UK-specific reaction in rates markets was muted. Markets price 5bp worth of cuts for December and 65bp by YE 2025. We still favour being paid in the very short-end of the Sonia-curve but highlight the potential for the BoE to deliver more easing in 2025 than currently priced.
FX. EUR/GBP moved lower on the announcement on the notion of a gradual cutting cycle. The guidance delivered today highlights the more cautious approach of the BoE, which supports our case of a continued move lower in EUR/GBP. This is further amplified by UK economic outperformance and tight credit spreads. The key risk is a soft BoE.
Our call. We expect the BoE to remain on hold at the December meeting and maintain its "gradual approach". In 2025, we expect cuts at every meeting starting in February and until H2 2025 where we expect a step down to a quarterly pace. This leaves the Bank Rate at 3.25% by YE 2025.
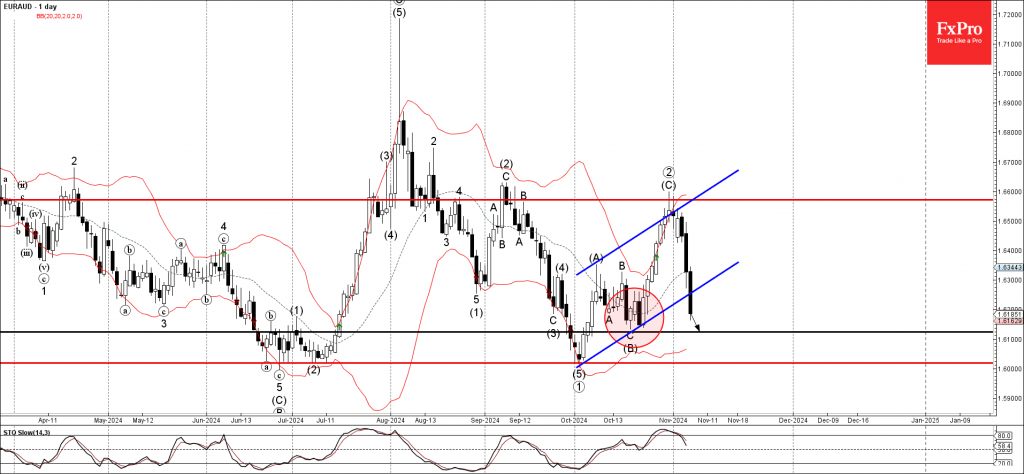
EURAUD Wave Analysis
- EURAUD under bearish pressure
- Likely to fall to support level 1.6125
EURAUD currency pair under bearish pressure after the earlier breakout of the support trendline of the daily up channel from the start of October.
The breakout of this up channel accelerated the active minor impulse wave 1 of the higher order impulse sequence (1) from the end of last month.
Given the strongly bullish Australian dollar sentiment seen across the FX markets today, EURAUD currency pair can be expected to fall to the next support level 1.6125 (which stopped the previous intermediate ABC correction (B) in the middle of October).
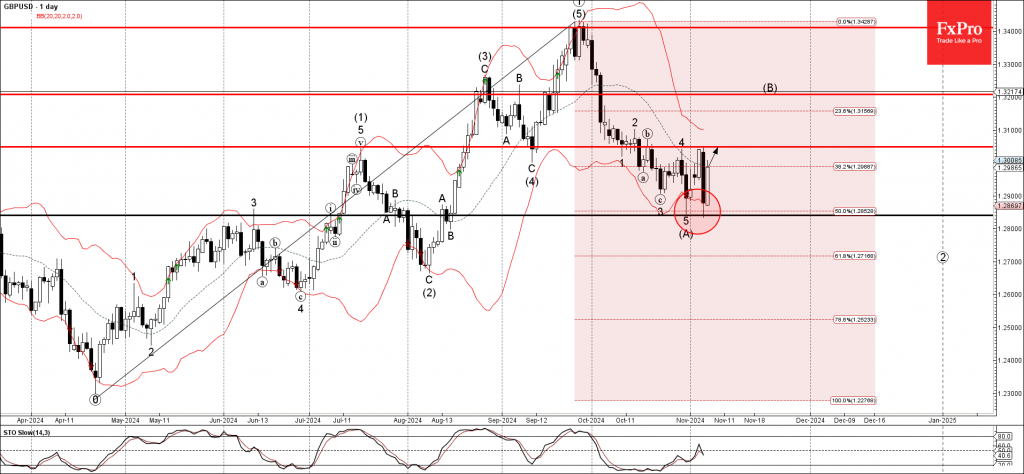
GBPUSD Wave Analysis
- GBPUSD reversed from support level 1.2840
- Likely to rise to resistance level 1.3050
GBPUSD currency pair recently reversed up from the support level 1.2840 (which stopped the previous intermediate correction (A) at the end of October).
The upward reversal from the support level 1.2840 created the daily Japanese candlesticks reversal pattern Piercing Line.
Given the clear daily uptrend and the strong US dollar sales seen today, GBPUSD currency pair can be expected to rise to the next resistance level 1.3050 (top of the previous minor correction 4).
October CPI Preview: Disinflation Is Getting Harder
Summary
The October Consumer Price Index will likely show that progress in wringing out the last bit of inflation remains frustratingly slow. We look for headline CPI to have advanced 0.2% in October, which would bump up the 12-month change in consumer prices to 2.5%. Excluding food and energy, prices are likely to have increased 0.3% for a third consecutive month as another increase in goods prices coincides with glacial easing in services inflation.
Glacial Slowing in Services and Firmer Goods Prices Bode Poorly for Overall Inflation Progress
The October CPI report will likely support the notion that the last mile of inflation's journey back to target will be the hardest. We look for the Consumer Price Index to have advanced 0.2% (0.21% unrounded) in October, causing the year-over-year rate to edge back up to 2.5% from 2.4% last month (Figure 1). Excluding food and energy, a third consecutive 0.3% monthly increase is expected to keep the core index up 3.3% year-over-year—still about one percentage point higher than its pre-pandemic pace.
A more temperate gain in food prices likely helped to keep October's headline gain in check. After grocery prices leapt 0.4% in September, we expect a slower rise in October (0.1%). About one-third of September's increase in food at home could be traced to eggs, but wholesale prices have eased in recent weeks, pointing to some giveback from September's hot reading. Amid a trend-like 0.3% rise in food away from home, we estimate the 12-month change in overall food inflation edged back down to 2.2%. Further offering consumers some reprieve was the continued easing of gas prices last month. We estimate energy goods prices fell roughly 1.4% in October and 13% from this time last year. However, the downdraft to overall inflation from energy is waning, and the risks to energy costs, at least for the time being, lie to the upside given geopolitical tensions in the Middle East.
Glacial Slowing in Services Keeping Inflation On
Excluding the more volatile energy and food components, the unwinding of pandemic-era price distortions has proven to be frustratingly slow. Our expectation for a 0.28% monthly gain would push the three-month annualized rate of core CPI up to 3.6% while keeping the 12-month rate at 3.3% for a second straight month.
Core goods prices look set for another rise in October, although it will likely be more modest (0.1% compared to 0.2% September) with a different set of drivers. After some of the largest gains of the past year in categories like apparel, household furnishings and other goods, we expect some mean-reversion in non-vehicle core goods. In contrast, the recent rebound in auction prices for used cars point to what could be the largest monthly gain in the CPI for used vehicles in about a year (Figure 2). We still think that the benefits of smoother supply chains and cooler demand have yet to fully run their course, but the deflationary impulses from new and used cars in particular may ebb through the final months of the year—especially as the devastation of Hurricanes Helene and Milton boosts demand for replacement vehicles and parts.
Having increased 4.8% in the year through September, services categories remain the real laggard in terms of core inflation settling back down (Figure 3). We look for a 0.34% rise in services ex-food and energy, which would be essentially unchanged from the prior monthly gain of 0.36%. Primary shelter likely advanced at a similar pace as September (0.3%), which would lead the 12-month change down a tick to 5.0%. Travel prices likely firmed up over the month as hurricane-related evacuations and displacements drove up demand for lodging away from home. However, smaller monthly gains for vehicle insurance, tuition and medical care should lead to an easing of the other core services, as service providers continue to be benefit from more stable prices for goods inputs and slower growth in labor costs (Figure 4).
While the journey back to price stability has not been completed, we have been of the view that the cooler jobs market, un-kinked supply chains, pickup in productivity and anchored inflation explanations would help drive inflation slowly back to the Fed's target over the course of the next two years. A number of upside risks remain in the near to medium term, however, including a pullback in labor supply, deglobalization's impact on import prices, the potential for worsening conflict in the Middle East and still-strong demand.
Many of the policies proposed by President-elect Donald Trump on the campaign trail are likely to contribute to these pressures and extend the journey back to the Fed's target, if not lead to a re-acceleration in price growth over the next year or so, in our view. We have discussed some initial policy implications of the 2024 election results, but will publish a detailed update to our medium-term inflation forecast with the release of our Annual Economic Outlook on November 21.