
Sample Category Title
GBP/USD Daily Outlook
Daily Pivots: (S1) 1.2928; (P) 1.2958; (R1) 1.3007; More...
Intraday bias in GBP/USD is turned neutral with a temporary low formed at 1.2906. Further decline is expected as long as 1.3070 resistance holds. Below 1.2906 will resume the fall from 1.3433 to 61.8% retracement of 1.2298 to 1.3433 at 1.2732. However, considering bearish divergence condition in 4H MACD, firm break 1.3070 resistance will indicate short term bottoming, and turn bias back to the upside for stronger rebound.
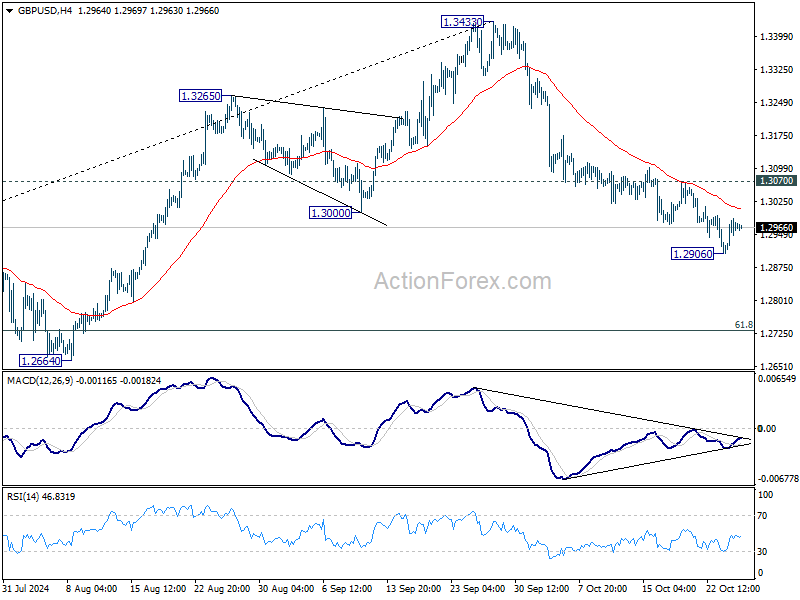
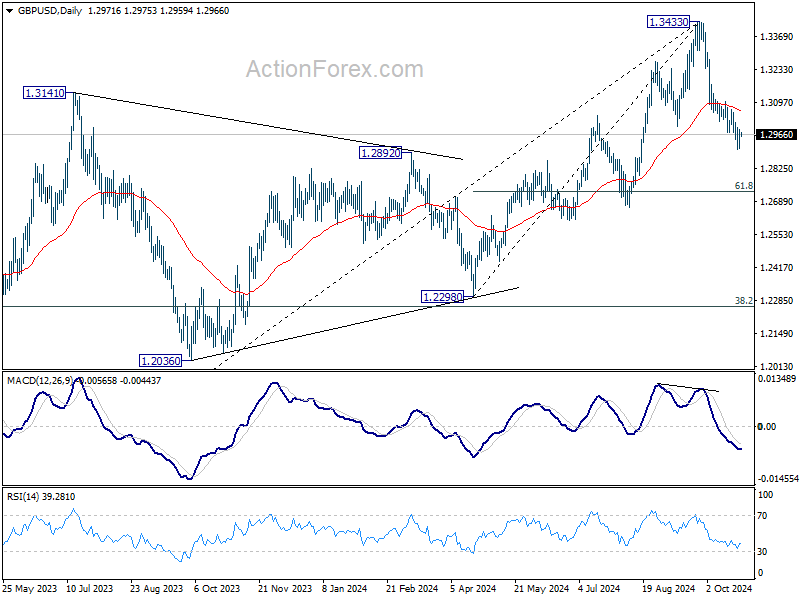
In the bigger picture, considering mildly bearish divergence condition in D MACD, a medium term top is likely in place at 1.3433 already. Price actions from there are seen as correction to whole up trend from 1.0351 (2022 low). Deeper decline would be seen to 38.2% retracement of 1.0351 to 1.3433 at 1.2256, which is close to 1.2298 structural support. Strong support should be seen there to bring rebound.
USD/CHF Daily Outlook
Daily Pivots: (S1) 0.8646; (P) 0.8662; (R1) 0.8674; More…
Intraday bias in USD/CHF is turned neutral as a temporary top is formed at 0.8685, ahead of 38.2% retracement of 0.9223 to 0.8374 at 0.8698. Considering bearish divergence condition in 4H MACD, firm break of 0.8629 support will indicate short term topping, and turn bias back to the downside for 55 D EMA (now at 0.8601). Nevertheless, sustained break of 0.8698 will argue that fall from 0.9223 has completed at 0.8374, after defending 0.8332 low. Further rally should then be seen to 61.8% retracement at 0.8899 next.
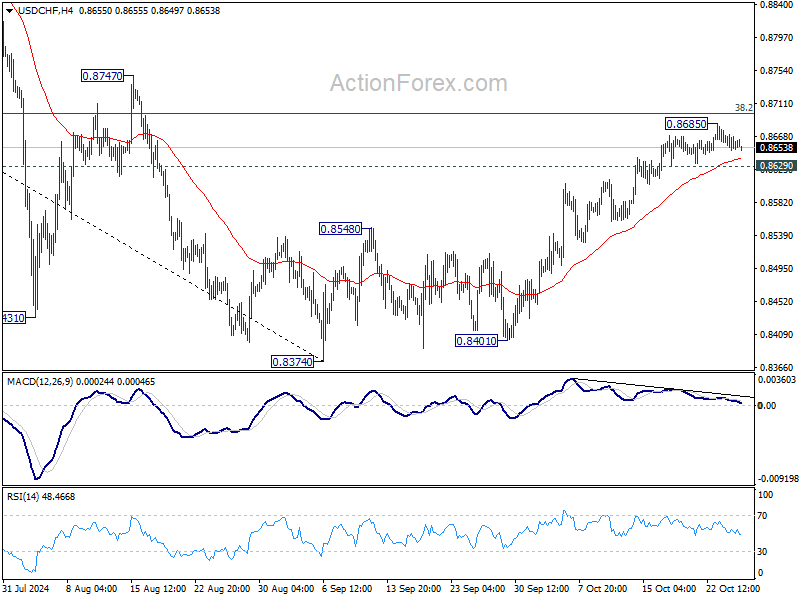
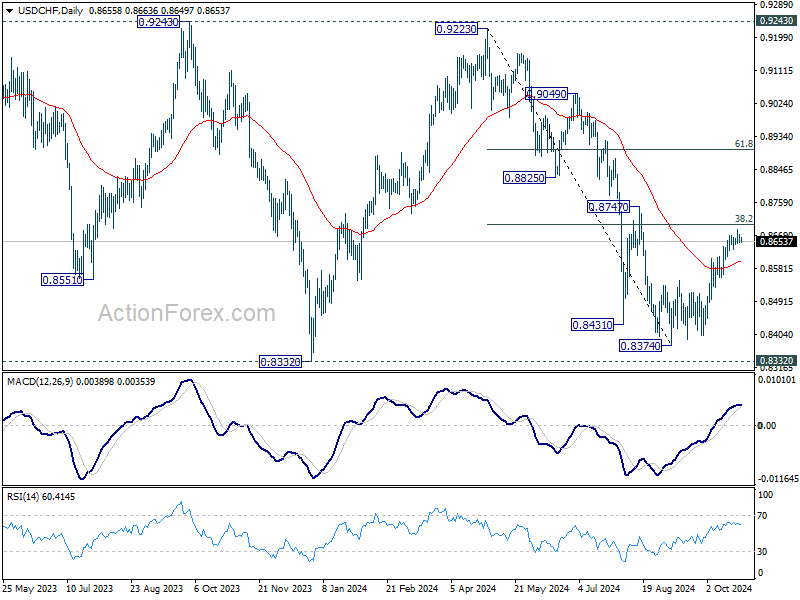
In the bigger picture, price actions from 0.8332 (2023 low) are currently seen as a medium term corrective pattern, with fall from 0.9223 as the second leg. Strong support could be seen from 0.8332 to bring rebound. Yet, overall outlook will continue to stay bearish as long as 0.9243 resistance holds. Firm break of 0.8332, however, will resume larger down trend from 1.0146 (2022 high).
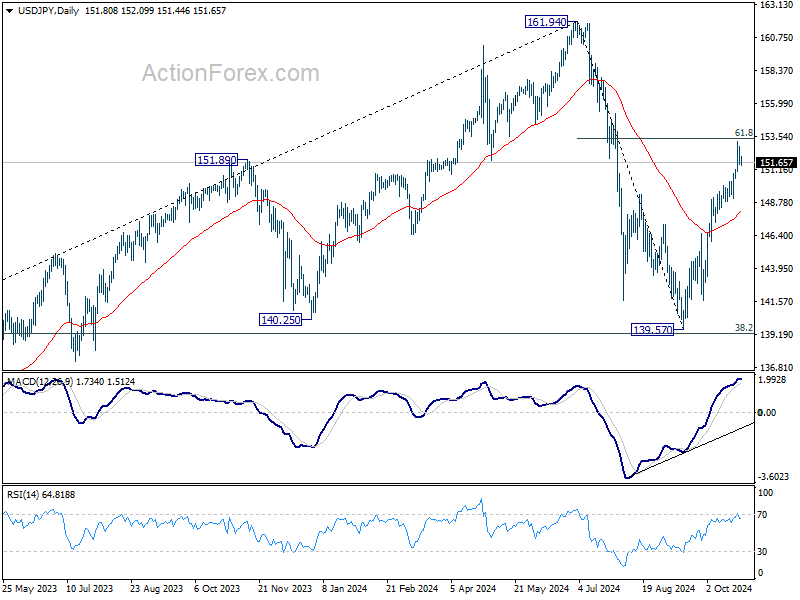
USD/JPY Daily Outlook
Daily Pivots: (S1) 151.30; (P) 152.07; (R1) 152.58; More...
Intraday bias in USD/JPY is turned neutral as a temporary top was formed at 153.17, ahead of 61.8% retracement of 161.94 to 139.57 at 153.39. Considering bearish divergence condition in 4H MACD, break of 151.18 will indicate short term topping, and turn bias to the downside for 55 D EMA (now at 148.01). Nevertheless, decisive break of 153.39 will extend the rally from 139.57 to retest 161.94 high.
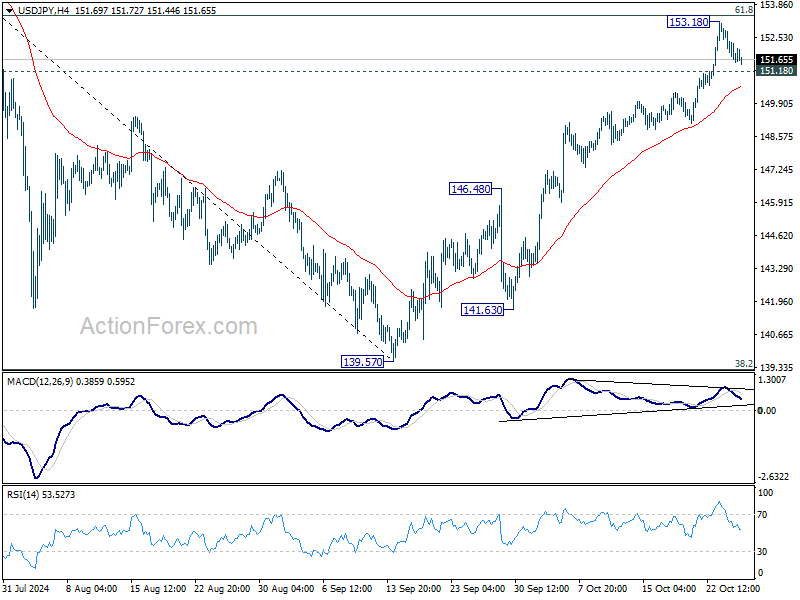
In the bigger picture, price actions from 161.94 are seen as a corrective pattern to rise from 102.58 (2021 low). The range of medium term consolidation should be set between 38.2% retracement of 102.58 to 161.94 at 139.26 and 161.94. Nevertheless, sustained break of 139.26 would open up deeper medium term decline to 61.8% retracement at 125.25.
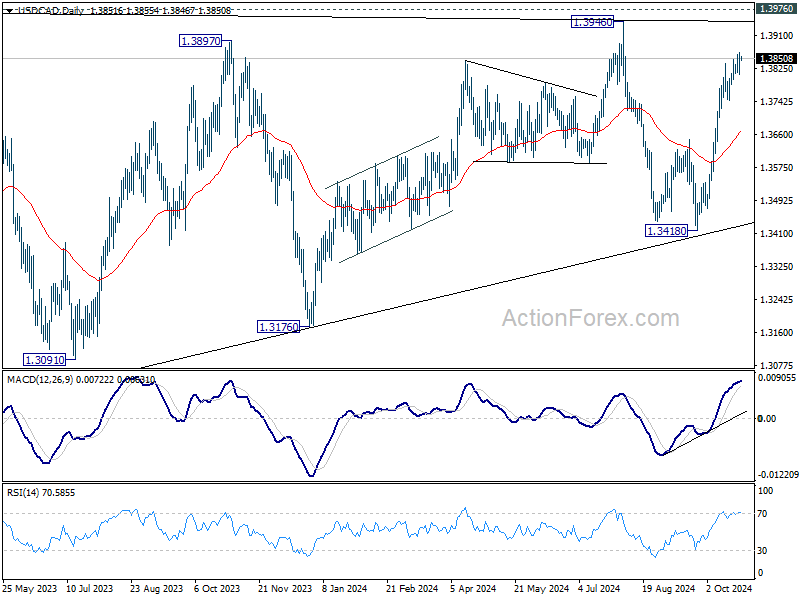
USD/CAD Daily Outlook
Daily Pivots: (S1) 1.3823; (P) 1.3846; (R1) 1.3879; More...
Intraday bias in USD/CAD stays on the upside at this point. Current rally from 1.3418 is in progress for retesting 1.3946/76 key resistance zone. Strong resistance might be seen there to limit upside. On the downside, break of 1.3746 support is needed to indicate short term topping, or another rise is in favor in case of retreat.
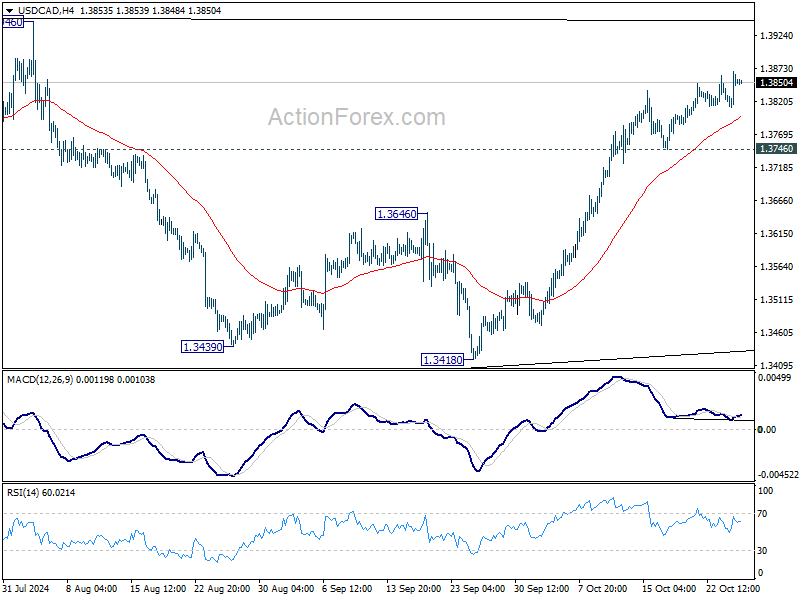
In the bigger picture, sideway consolidation pattern from 1.3976 (2022 high) might still extend further. While another decline cannot be ruled out, strong support should emerge above 1.2947 resistance turned support to bring rebound. Rise from 1.2005 (2021 low) is still in favor to resume at a later stage.
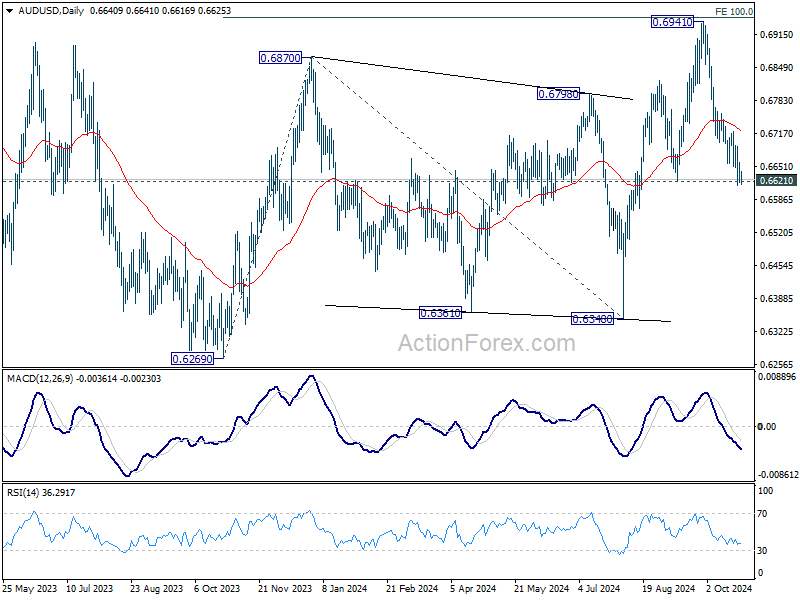
AUD/USD Daily Report
Daily Pivots: (S1) 0.6620; (P) 0.6641; (R1) 0.6660; More...
Intraday bias in AUD/USD remains on the downside for the moment. Firm break of 0.6621 support should confirm near term bearish reversal after topping at 0.6941. Deeper decline should then be seen to 0.6348 support next. On the upside, above 0.6694 minor resistance will turn intraday bias neutral first.
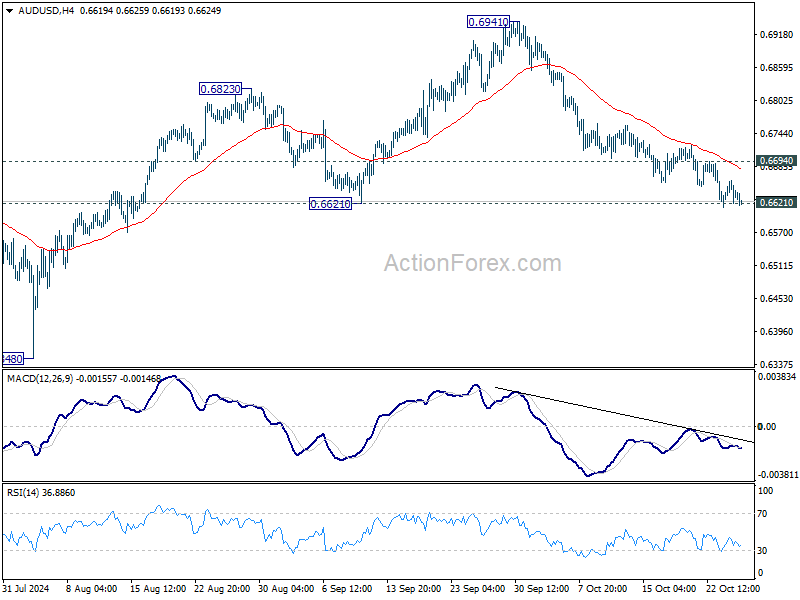
In the bigger picture, overall, price actions from 0.6169 (2022 low) are seen as a medium term corrective pattern, with rise from 0.6269 as the third leg. Firm break of 100% projection of 0.6269 to 0.6870 from 0.6340 at 0.6941 will target 138.2% projection at 0.7179. However, sustained break of 0.6621 support will argue that rise from 0.6269 has completed and bring deeper fall back to 0.6269/6348 support zone.
Dollar Cools as Yields Stabilize, Gold Rally Loses Momentum
Dollar has started to ease after a strong rally this week, alongside US Treasury yields. While the greenback is consolidating gains against European majors and Yen, there’s little indication of a substantial pullback for now. Against commodity currencies, Dollar still holds potential for additional gains. Still, traders may avoid large moves ahead of the weekly close, aiming to lock in recent gains.
For the week so far, Dollar is maintaining its lead as the strongest currency, trailed by Swiss Franc and Canadian Dollar. Meanwhile, Yen remains under pressure, particularly with no strong signs of a bounce back before Japan’s snap elections on Sunday. New Zealand and Australian Dollars have also struggled amid weaker risk sentiment, and both may face further downside. Euro and Pound maintain middle-ground performance.
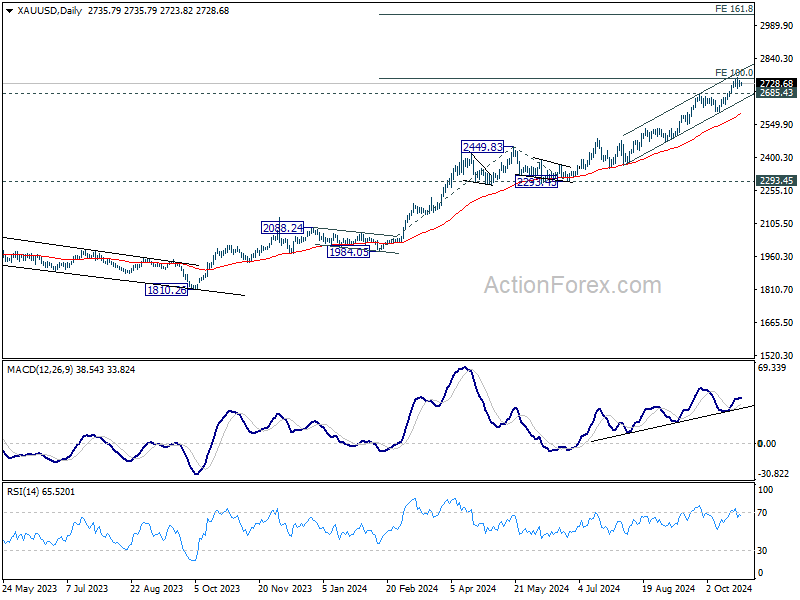
Technically, Gold's up trend stalled after hitting 100% projection of 1984.05 to 2449.83 from 2293.45 at 2759.23. Break of 2685.43 resistance turned support will confirm short term topping, and bring pullback towards 55 D EMA (now at 2596.31). Nevertheless, sustained break of 2759.23 will pave the way to 161.8% projection at 3047.82.
In Asia, at the time of writing, Nikkei is down -0.95%. Hong Kong HSI is up 1.10%. China Shanghai SSE is up 0.75%. Singapore Strait Times is down -0.60%. Japan 10-year JGB yield is down -0.0065 at 0.951. Overnight, DOW fell -0.33%. S&P 500 rose 0.21%. NASDAQ rose 0.76%. 10-year yield fell -0.0420 to 4.200.
BoJ's Ueda signals no immediate rate hike
BoJ Governor Kazuo Ueda indicated that the central bank is not in a hurry to adjust its monetary policy, stating after the G20 meeting in Washington, "I believe we have enough time" to make a decision. This suggests that BoJ will refrain from hiking interest rates in its upcoming meeting next week.
Ueda emphasized the importance of considering the broader economic context, including the effects of the weak Yen and uncertainties surrounding the US economy, which may be influenced by the upcoming US presidential election.
During the same press conference, Japan's Finance Minister Katsunobu Kato reiterated concerns over Yen's high volatility. He highlighted the need for close attention to fluctuations in the foreign exchange market.
Tokyo CPI core dips to 1.8% in Oct on lower energy prices
Japan's Tokyo CPI core (excluding food) dropped from 2.0% yoy to 1.8% yoy in October, slightly above market expectations of 1.7%. This marks the first time in five months that inflation has dipped below BoJ's 2% target. Headline CPI also slowed from 2.1% yoy to 1.8% yoy.
The deceleration was largely driven by a slowdown in energy prices, with government subsidies for energy costs contributing to a 0.51 percentage point reduction in the overall index.
Despite this, underlying inflationary momentum ticked up, as core-core CPI (excluding food and energy) rose from 1.6% yoy to 1.8% yoy. Services prices also saw an uptick, increasing by 0.8% yoy compared to 0.6% yoy in the prior month.
Looking ahead
German Ifo business climate is the main feature in European session, while Eurozone will release M3 money supply. Later in the day, Canada will publish retail sales and new housing price index. US will release durable goods orders.
AUD/USD Daily Report
Daily Pivots: (S1) 0.6620; (P) 0.6641; (R1) 0.6660; More...
Intraday bias in AUD/USD remains on the downside for the moment. Firm break of 0.6621 support should confirm near term bearish reversal after topping at 0.6941. Deeper decline should then be seen to 0.6348 support next. On the upside, above 0.6694 minor resistance will turn intraday bias neutral first.
In the bigger picture, overall, price actions from 0.6169 (2022 low) are seen as a medium term corrective pattern, with rise from 0.6269 as the third leg. Firm break of 100% projection of 0.6269 to 0.6870 from 0.6340 at 0.6941 will target 138.2% projection at 0.7179. However, sustained break of 0.6621 support will argue that rise from 0.6269 has completed and bring deeper fall back to 0.6269/6348 support zone.
Cliff Notes: Calm Before the Storm
Key insights from the week that was.
In the absence of any major data or events in Australia this week, markets continued to ponder the likely timing and shape of the RBA’s easing cycle, eventually pricing in only about two and a half 25bp interest rate cuts by the end of 2025. These developments mirrored the modest changes in global sentiment, but the centre of the debate being on the question of ‘when’ locally versus ‘how fast’ and ‘how much’ interest rates are going to go down globally is a clear point of distinction.
Next week’s Q3 CPI update will prove critical in calibrating local market expectations. Our preview delves into the detail behind our expectations and forecasts for the forthcoming update. In summary, the full roll-out of cost-of-living rebates across the states are set to drive headline inflation back into the target band in Q3 – we forecast 2.9%yr. The RBA will instead be more focused on trimmed mean inflation, to the extent that it will provide a clearer gauge of the true underlying momentum of inflation. We anticipate a constructive development on this front too, with trimmed mean inflation forecast to ease from 3.9%yr in June to 3.5%yr in September.
Should the headline results and general composition from the data print broadly as we expect, we view the inflation dynamics as being most consistent with a February start to the rate cutting cycle. At a pace of 25bps per quarter, we anticipate the cash rate to reach a terminal rate of 3.35% by the end of next year. This end-point is predicated on our view that the global structure of interest rates will be higher than it was pre-pandemic. In this week’s essay, Chief Economist Luci Ellis discusses why reversion to pre-pandemic ‘norms’ might not necessarily be an appropriate baseline.
Late last week, China’s Q3 GDP data came in weak at 4.6%yr, well below the official government’s target. Monthly data for September showed some signs of activity picking up. Industrial production rose 5.4%yr supported by strong growth in chips and EV production. News on consumer spending was also positive, as retail sales accelerated to 3.2%yr, the highest since May, with the government subsidies for consumer goods providing a boost. Meanwhile, property investment and sales continue to decline in the double digits. Looking ahead, the Q4 data will be closely watched for impacts of the stimulus measures announced since late September, with a lift expected to provide the support needed for the economy to reach target growth.
In advanced economies, politics dominated the news flow. Opinion polls in the US suggested that Donald Trump was gaining momentum, with financial markets pricing USD and government bond yields higher. Political uncertainty also increased in Japan, as polls show that the ruling coalition led by the new Prime Minister Ishiba might struggle to secure a majority. This will be a huge departure from the norm as the Liberal Democratic Party has been in power most years since 1955, mostly recently having lost power in 2009. And in the UK, the focus remained on next week’s Budget announcement by the new Labour government, with news reports highlighting the significant challenges for public finances ahead.
Against that backdrop, the global PMIs for October showed that growth momentum in most major economies weakened at the start of Q4. In the euro area, the composite index remained in contractionary territory for a second month, and was down by 0.6pts from the Q3 average. The composite PMI in the UK fell to 51.7, the lowest level for nearly a year, and was consistent with quarterly UK GDP growth of only 0.1%qtr, which represents a sharp slowdown from the first half of this year. Meanwhile, the US PMIs stood out, implying firmer and more stable growth momentum despite the uncertainty ahead of the election. Indeed, the US composite PMI came in at 54.3, slightly higher compared to September levels, and unchanged from the Q3 average. But the FOMC’s Beige Book was more sanguine suggesting that the US economic activity was little changed from its July update. Negative impact from hurricanes to agriculture, tourism and the general business activity in the Southeast was noted, but employment was assessed to have increased slightly. Wage growth was described as modest, and most districts saw slight increases in selling prices.
South of the border, the Bank of Canada accelerated the pace of easing and lowered the target for the overnight rate by 50bp to 3.75%. In its communications, it highlighted that inflation returned to the 2% target falling significantly in the last few months, but lower interest rates are needed to maintain it at that level, in particular given concerns about the weakness in the underlying growth momentum.
USD/JPY Holds Strong on Dips: Will More Gains Follow?
Key Highlights
- USD/JPY extended gains above the 152.50 resistance zone.
- It broke a key rising channel with resistance at 151.20 on the 4-hour chart.
- Gold prices started a short-term downside correction after hitting a new all-time high at $2,758.
- EUR/USD and GBP/USD could attempt a recovery wave.
USD/JPY Technical Analysis
The US Dollar remained in a bullish zone above 148.00 against the Japanese Yen. USD/JPY cleared the 150.00 resistance to move into a positive zone.
Looking at the 4-hour chart, the pair settled above the 150.50 level, the 100 simple moving average (red, 4-hour), and the 200 simple moving average (green, 4-hour). The pair broke a key rising channel with resistance at 151.20.
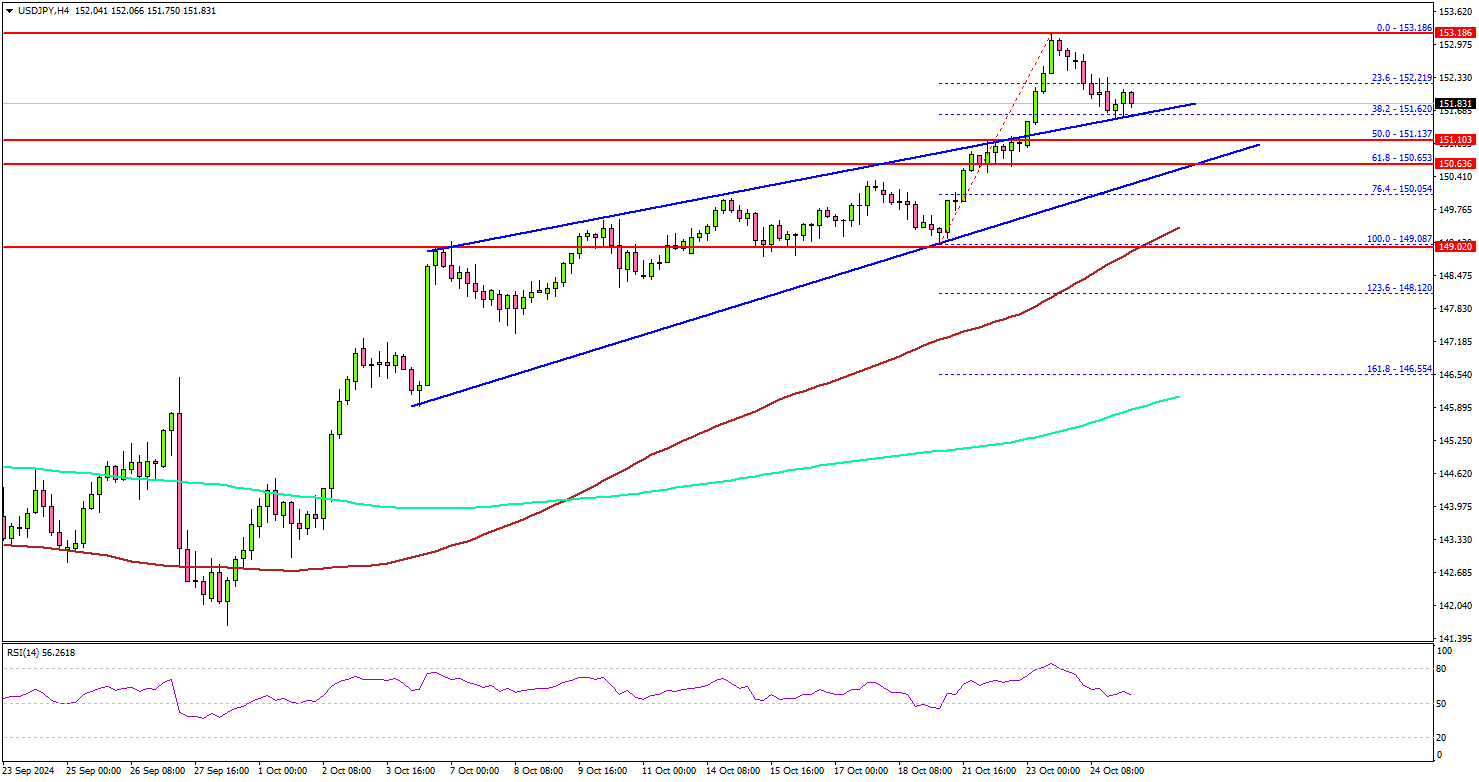
Finally, it surpassed the 153.00 level. A high was formed at 153.18 before there was a pullback. On the downside, immediate support sits near the 151.50 level.
The next key support sits near the 150.50 level. Any more losses could send the pair toward the 150.00 level. The main support sits near the 100 simple moving average (red, 4-hour) at 149.10.
On the upside, the pair could face resistance near the 152.80 level. The first key resistance is near the 153.20 level. A close above the 153.20 level could set the tone for another increase. The next major resistance could be 153.50, above which the price could accelerate higher toward the 155.00 level.
Looking at EUR/USD, the pair declined toward the 1.0765 zone and might attempt a recovery wave in the near term.
Upcoming Economic Events:
- US Durable Goods Orders for Sep 2024 – Forecast -0.9% versus 0% previous.
- Michigan Consumer Sentiment Index for Oct 2024 (Prelim) – Forecast 69.0, versus 68.9 previous.
Tokyo CPI core dips to 1.8% in Oct on lower energy prices
Japan's Tokyo CPI core (excluding food) dropped from 2.0% yoy to 1.8% yoy in October, slightly above market expectations of 1.7%. This marks the first time in five months that inflation has dipped below BoJ's 2% target. Headline CPI also slowed from 2.1% yoy to 1.8% yoy.
The deceleration was largely driven by a slowdown in energy prices, with government subsidies for energy costs contributing to a 0.51 percentage point reduction in the overall index.
Despite this, underlying inflationary momentum ticked up, as core-core CPI (excluding food and energy) rose from 1.6% yoy to 1.8% yoy. Services prices also saw an uptick, increasing by 0.8% yoy compared to 0.6% yoy in the prior month.
BoJ’s Ueda signals no immediate rate hike
BoJ Governor Kazuo Ueda indicated that the central bank is not in a hurry to adjust its monetary policy, stating after the G20 meeting in Washington, "I believe we have enough time" to make a decision. This suggests that BoJ will refrain from hiking interest rates in its upcoming meeting next week.
Ueda emphasized the importance of considering the broader economic context, including the effects of the weak Yen and uncertainties surrounding the US economy, which may be influenced by the upcoming US presidential election.
During the same press conference, Japan's Finance Minister Katsunobu Kato reiterated concerns over Yen's high volatility. He highlighted the need for close attention to fluctuations in the foreign exchange market.