
Sample Category Title
USD/JPY Daily Outlook
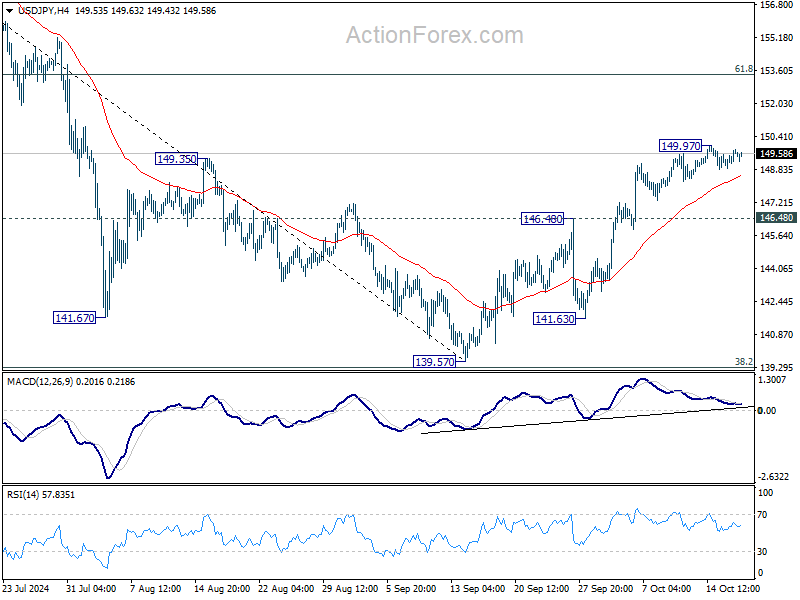
Daily Pivots: (S1) 149.08; (P) 149.44; (R1) 150.02; More...
Intraday bias in USD/JPY remains neutral for consolidations below 149.97 temporary top. Further rally is expected with 146.48 resistance turned support intact. Above 149.97 will resume the rise from 139.57 to 61.8% retracement of 161.94 to 139.57 at 153.39 next. However, firm break of 146.48 will argue that such rebound has completed, and turn bias back to the downside for retesting 139.57 low.
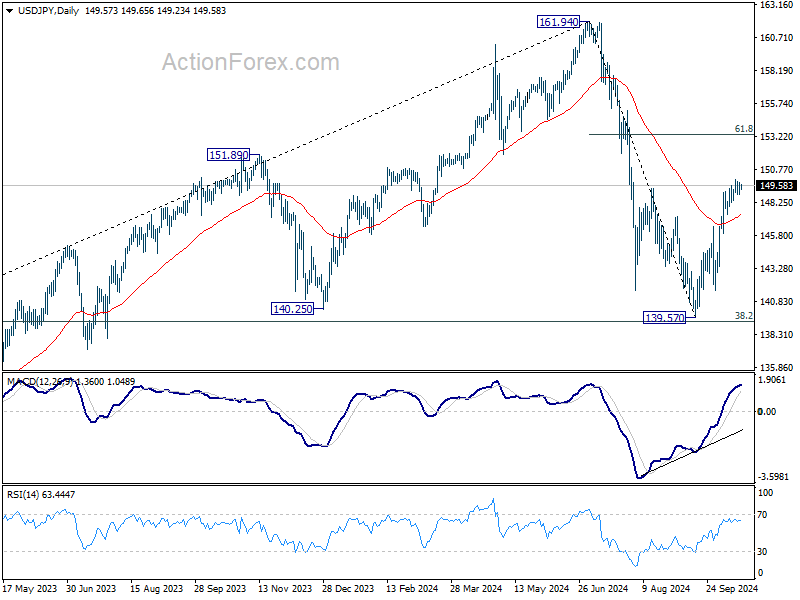
In the bigger picture, price actions from 161.94 are seen as a corrective pattern to rise from 102.58 (2021 low). The range of medium term consolidation should now be set between 38.2% retracement of 102.58 to 161.94 at 139.26 and 161.94. Nevertheless, sustained break of 139.26 would open up deeper medium term decline to 61.8% retracement at 125.25.
USD/CAD Daily Outlook
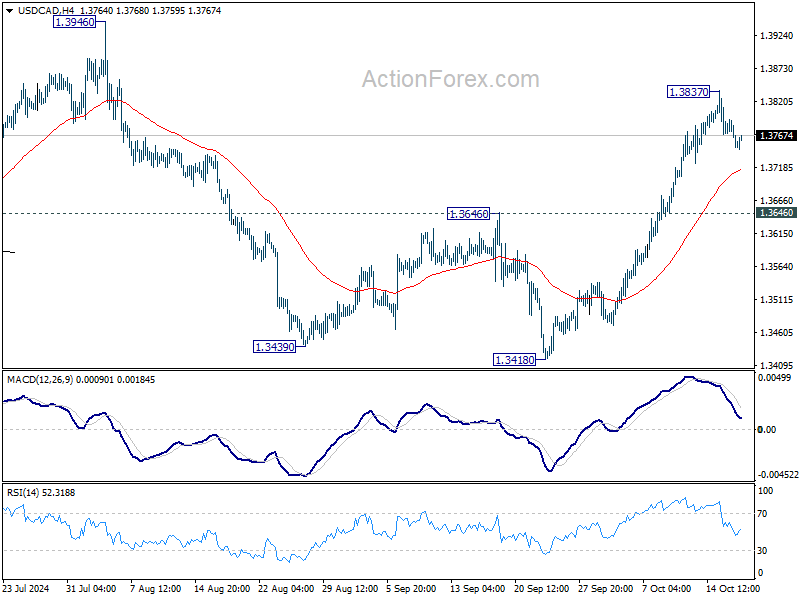
Daily Pivots: (S1) 1.3736; (P) 1.3764; (R1) 1.3779; More...
Intraday bias in USD/CAD stays neutral for consolidation below 1.3837 temporary top. Downside of retreat should be contained above 1.3646 resistance turned support. On the upside, above 1.3837 will resume the rally from 1.3418 to 1.3946/76 key resistance zone.
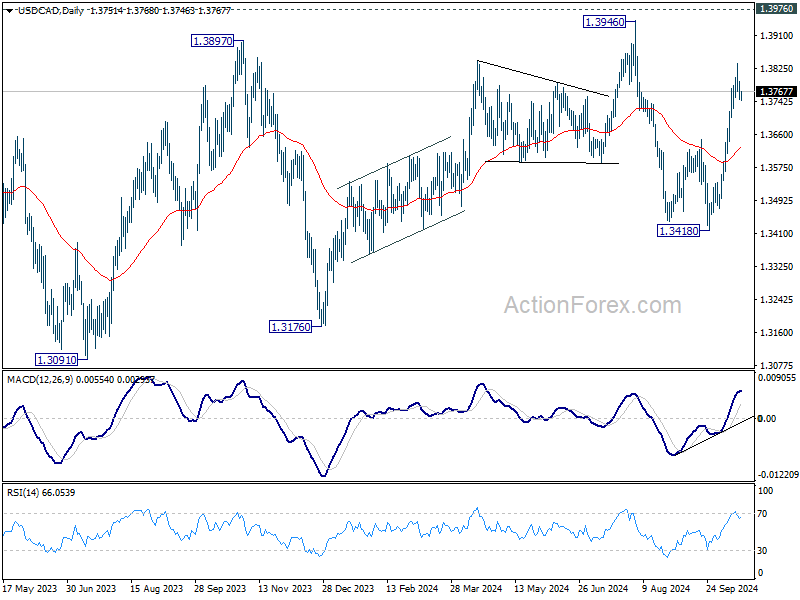
In the bigger picture, sideway consolidation pattern from 1.3976 (2022 high) might still extend further. While another decline cannot be ruled out, strong support should emerge above 1.2947 resistance turned support to bring rebound. Rise from 1.2005 (2021 low) is still in favor to resume at a later stage.
Will ECB Give in to Soft Inflation, Stagnating Growth?
It’s yet another day of stimulus announcements in China, and another round of letdowns for investors. Chinese authorities today announced to almost double the amount it deployed to support what’s called ‘white list’ projects – we are talking about a 4 trillion yuan initiative to facilitate funding thousands of public and private projects in 170 cities of China. But in vain, the announcement was again seen as too small to match the People’s Bank of China’s (PBoC) massive monetary easing, and failed to give the Chinese equities a sustainable boost. The CSI 300 was initially up but gains melted like snow under the sun: the index is flat at the time of writing, the CSI mainland real estate index is down by 4% and the Hang Seng index also gave back earlier gains. There is severe a disconnect between the Chinese authorities and investor expectations. The only way to bring the two groups to an agreement is the announcement of a massive fiscal spending figure that Xi’s government hasn’t been willing to do so far.
Copper and iron ore futures are down this morning, and the AUDUSD – though better bid after yesterday’s selloff below the 100-DMA, sees resistance near this level. Crude oil, on the other hand, remains under pressure a touch above the $70pb despite a surprise decline in US oil inventories last week, according to the latest API release. China’s inability to cheer investors up and the fading worries that Israel will attack the Iranian oil facilities, combined with a deteriorating global demand outlook suggest that it’s not a matter of if, but a matter of when and by how much US crude will sink below the $70pb level. The bearish oil outlook remains supportive of a softer Loonie against the greenback, along with the softening price pressures in Canada. Released yesterday, the latest CPI report revealed that inflation in Canada eased faster than expected in September and the headline figure now stands near 1.6% - backing further rate cuts from the Bank of Canada (BoC) to support the economy.
In the US, the unexpected fall in NY Empire manufacturing index gathered little attention yesterday. The US dollar index extended gains above the 100-DMA, as Cable slipped below the 1.30 level after inflation report in Britain came in softer than expected and boosted the Bank of England (BoE) doves’ expectation of rate cuts in Britain. The sterling bears are now testing the major 38.2% Fibonacci retracement, a few pips below the 1.30 mark, to reverse the April to September positive trend and send the pair into a medium-term bearish consolidation zone.
Across the Channel, the EURUSD took out the 200-DMA support yesterday and extended losses to 1.0850 level ahead of today’s European Central Bank (ECB) decision. The ECB is expected to lower its rates by another 25bp as the headline Eurozone inflation eased below the bank’s 2% target in September and the Eurozone economies are struggling to keep their head above water. Germany, once the zone’s growth engine, is thought to be in mild recession, its car factories are suffering the Chinese EV competition – and will likely be heavily hit by the European tariffs on Chinese EVs that will fire back on the European carmakers. Its iconic VW already announced factory closures, and even ASML, which was the proxy of the AI trade in Europe, is not doing well after it confessed that orders are looking weak into 2025 due to a delayed recovery in chip industry – concerning other than AI chips, and the European luxury brands – which are among the biggest European companies – are heavily hit by the fading Chinese/Asian spending. LVMH erased all gains triggered by the Chinese stimulus optimism of late September and is back to the down-trending trend building since March this year. Under these circumstances, the ECB could safely deliver another 25bp cut today and hint at more rate cuts to come. The only thing that could held the ECB officials back from sounding overly dovish is persistent core and services inflation in the region. The ECB members will likely remain cautious regarding that metric to make sure that the rate cuts don’t happen faster than the music. But in fine, the Eurozone needs financial relief and inflation’s trajectory, both in the Eurozone and away, are supportive of further monetary policy easing.
The market’s reaction to ECB decision and the post-decision presser could be mixed. A rate cut today, a dovish message from the ECB and another 25bp cut in December are already widely priced in. Lagarde's tone at the post-decision press conference will play a crucial role in determining whether the euro will further weaken against the dollar. We could see a buy-the-rumour-sell-the-fact reaction to today’s decision if Lagarde highlights risks regarding the softening inflation. If the ECB does not convey strong confidence that today’s rate cut is merely a midpoint in a series of reductions, the EURUSD may experience a rebound from its near-overbought conditions. But any potential price rallies will likely see a solid resistance near the 1.0980 level, the major 38.2% Fibonacci retracement on April to September to rebound, and keep the pair within the medium-term bearish consolidation zone for further depreciation in the medium run. Paradoxically, the Stoxx 600 index is trading near an ATH level as the cyclical nature of the European stocks fuelled by lower global rate prospects have been boosting appetite for European companies since a year now. Whether the European stock bulls will survive to what could be a gloomy earnings season is yet to be seen.
In the US, however, the earnings season is going quite well, as Morgan Stanley also announced better-than-expected earnings and closed the march for big banks on a positive note. The S&P500 consolidates near record.
Focus Turns to ECB
In focus today
Focus today is on the ECB meeting, where we expect the ECB to deliver yet another rate cut of 25bp, bringing the deposit rate to 3.25%. Our expectations are supported by the recent weaker-than-anticipated growth indicators, as well as a decline in inflation. We expect that the ECB sticks to the 'meeting-by-meeting' and 'data dependent' approach that it has been following in the past few quarters. Ahead of the meeting, we receive the final HICP inflation data, which will allow us to see how the LIMI measure of domestic inflation fared in September, which is an important input for the ECB.
US September retail sales and industrial production data as well as the weekly jobless claims are due for release in the afternoon. Retail sales will provide the markets with the latest hard evidence of the strength of the US consumer. Initial jobless claims from the week ending 12 October will for the first time include the impact of Hurricane Milton, which likely distorted the data upwards especially in Florida.
The Central Bank of Turkey will announce their rate decision after their monetary policy meeting. Markets consensus is an unchanged decision of 50%.
Overnight we get, the September inflation in Japan. The figure likely declined sharply from 2.8% in August as an early Tokyo release also indicated. BoJ's preferred measure of inflation (CPI excl. fresh food) stood at 2.8% in August and should remain above the 2%-target. Core price pressures have largely aligned with 2% inflation recently and with the October yen slide in mind, we still see an opening for another BoJ hike in either December or January after the dust has settled upon the general election on 27 October.
Tomorrow morning at 4:00 CET, China releases its monthly data on home sales, house prices, retail sales, industrial production etc. as well as Q3 GDP data. We expect it to still paint a weak picture of China highlighting the need for the increased stimulus we are now seeing.
Economic and market news
What happened overnight
In Japan, trade figures for September came in lower than expected with exports at -1.7% y/y (cons: 0.5%), and imports at a small rise of +2.1% y/y (cons: 3.2%).
In China, it was announced that they are expanding their "white list" of housing projects eligible for financing, and increasing bank lending for these developments to USD 562bn from USD 313bn, according to Housing Minister Ni Hong. These initiatives are part of efforts to stabilize a sector that has faced a crisis since 2021, impacting the broader economy.
What happened yesterday
In the UK, inflation surprised sharply to the downside with headline at 1.7% (cons: 1.9%, prior: 2.2%), core at 3.2% (cons: 3.4%, prior: 3.6%) and services at 4.9% (cons: 5.2%, prior: 5.5%). This means that Q3 service inflation stands at 5.2%, which is notably lower than the BoE forecast at 5.6% from the August MPR. The decline was broad-based across categories with core services easing. The downside surprise should give the BoE more confidence that underlying inflationary pressures are easing and by extension, make a November cut a done deal. Going forward, we forecast the BoE will maintain its gradual approach delivering quarterly cuts until next year, where we expect a cut at every meeting for the first half of the year, leaving the Bank Rate at 3.25% at year-end 2025.
FI: Yesterday's decline in rates with very limited volatility was mostly a waiting game ahead of this week's big event, namely today's ECB meeting. The initial rally was supported by a benign UK inflation report. The 10y German point drifted 3bp lower to 2.18%.
FX: The Scandies had a poor session yesterday amid USD strength and US asset markets outperforming European equivalents. EUR/NOK rose close to 11.89 before trimming gains while the initial SEK losses kept EUR/SEK above 11.40 also during the US hours. EUR/USD continues to grind lower while GBP only partly erased losses following lower-than-expected UK CPI figures. USD/JPY continues to trade just below the 150-mark.
AUD/USD Daily Report
Daily Pivots: (S1) 0.6646; (P) 0.6678; (R1) 0.6699; More...
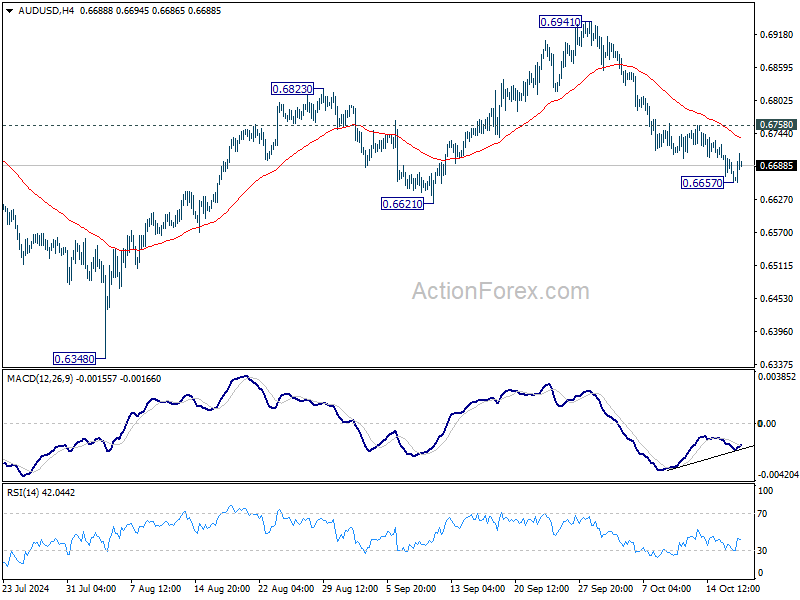
Intraday bias in AUD/USD is turned neutral with current recovery, but further decline is expected as long as 0.6758 resistance holds. Below 0.6657 will resume the fall from 0.6941 short term top to 0.6621 structural support. Decisive break there will pave the way back to 0.6348 support next. Nevertheless, considering bullish convergence condition in 4H MACD, firm break of 0.6758 will turn bias back to the upside for retesting 0.6941 instead.
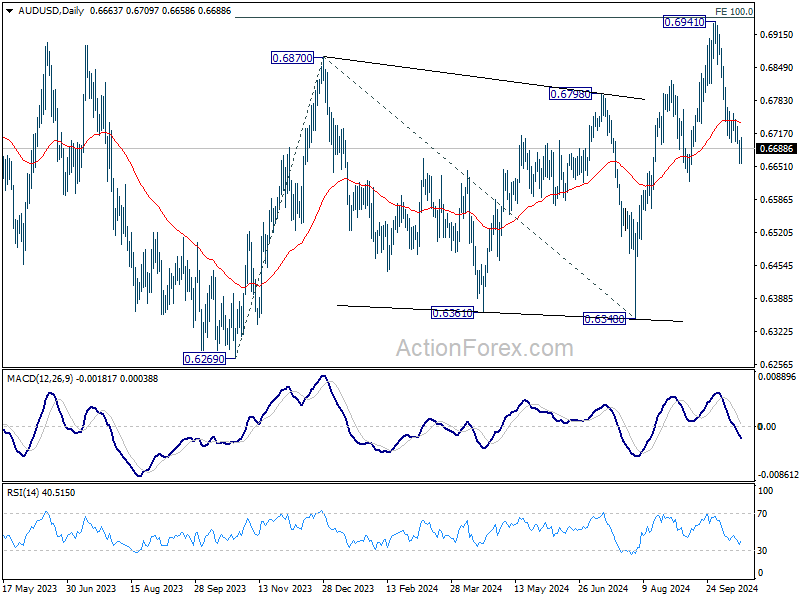
In the bigger picture, overall, price actions from 0.6169 (2022 low) are seen as a medium term corrective pattern, with rise from 0.6269 as the third leg. Firm break of 100% projection of 0.6269 to 0.6870 from 0.6340 at 0.6941 will target 138.2% projection at 0.7179. However, break of 0.6621 support will argue that rise from 0.6269 has completed and bring deeper fall back to 0.6269/6348 support zone.
Aussie Bounces on Strong Employment Data, But Concerns Over China Keep Gains in Check
Australian Dollar saw a modest rebound in the Asian session today, buoyed by much stronger-than-expected employment data. The Australian labor market continues to display resilience, with full-time jobs rising sharply, pushing the total over 10 million for the first time, while unemployment rate held steady at 4.1%. This robust labor market data has dashed any hopes for a near-term RBA rate cut. While some had hoped that rate reductions could come sooner, today's data suggests that the first policy shift will still likely be deferred until February next year, depending upon Q3 CPI figures due on October 30.
Despite this positive surprise, momentum for Aussie remains relatively weak. The underwhelming press conference from China’s Ministry of Housing, PBoC, and National Financial Regulatory Administration left markets disappointed. While China pledged to expand its “whitelist” of real estate projects and increase bank lending to unfinished developments by CNY 4T, analysts largely viewed these moves as "fine-tuning" of existing policies rather than the substantial stimulus package that markets had hoped for. This led to only a modest rebound in Chinese and Hong Kong stock markets.
In the broader currency markets, Canadian Dollar leads the way this week, though largely as a correction of recent losses. Dollar continues its upward march, while Yen remains resilient. Yen could avoid further sharp declines for now, unless traders push it through 150 psychological level against the greenback. At the other end of the spectrum, Swiss Franc is the weakest currency this week, followed by Aussie and New Zealand Dollar. Sterling is faring relatively better after yesterday’s selloff, while Euro is hovering in the middle as traders await today’s anticipated ECB rate cut.
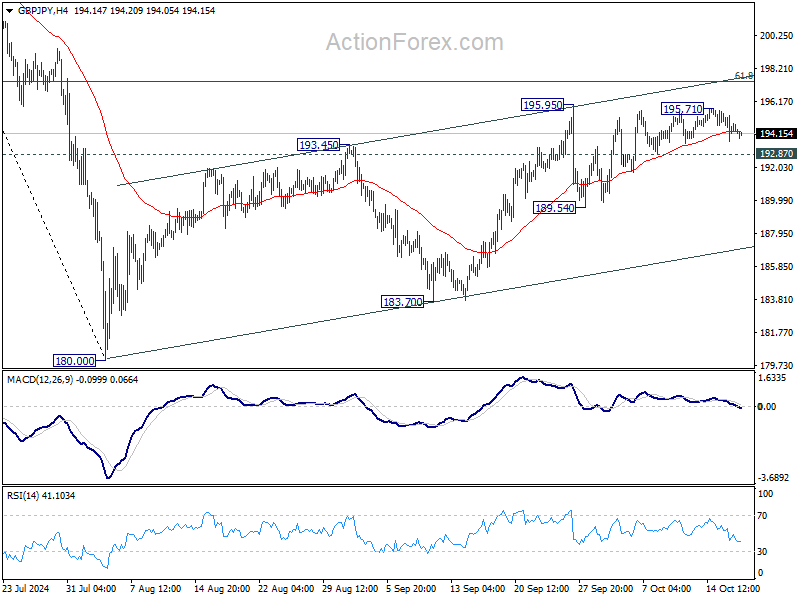
Technically, as GBP/JPY dips further today, focus is now on 192.87 minor support. Break there will firstly open up deeply decline to 189.54 support first. Decisive break there will rise the chance that whole corrective rise from 180.00 has completed, and turn near term outlook bearish for 180.00/183.70 support zone.
In Asia, at the time of writing, Nikkei is down -0.47%. Hong Kong HSI is up 0.83%. China Shanghai SSE is up 0.26%. Singapore Strait Times is up 0.93%. 10-year JGB yield is up 0.0091 at 0.964 . Overnight, DOW rose 0.79%. S&P 500 rose 0.47%. NASDAQ rose 0.28%. 10-year yield fell -0.022 to 4.016.
ECB gears up for first back-to-back rate cut in 13 yrs
ECB is widely expected to cut the deposit rate by 25bps to 3.25% today, marking the first back-to-back rate reduction in 13 years. This step reflects ECB’s growing urgency to accelerate monetary easing as inflation cools faster than anticipated and persistent manufacturing struggles spill over into services and employment.
Although December had initially been considered the optimal time for the next cut, recent economic data has heightened concerns among ECB officials. Nevertheless, the December meeting remains significant, with updated economic projections that will shape the policy direction in 2025.
While the market is almost fully pricing in three further cuts through March 2025, ECB President Christine Lagarde is unlikely to offer explicit guidance today. However, the underlying message will likely suggest that another cut in December is likely unless the economic outlook improves.
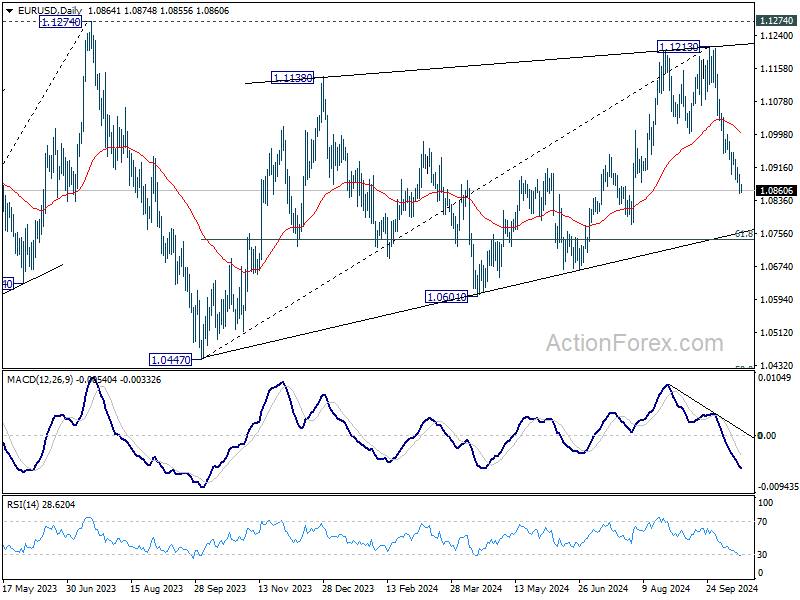
Technically, EUR/USD's fall from 1.1213 short term top is in progress. Near term outlook will stay bearish as long as 55 D EMA (now at 1.0999) holds. This decline is seen as the third leg of the corrective pattern from 1.1274 (2023 high). Next target is 61.8% retracement of 1.0447 to 1.1213 at 1.0740. Any further dovish tone from the ECB today could accelerate this downward movement.
Australia's employment grows 64.1k in Sep, unemployment rate unchanged at 4.1%
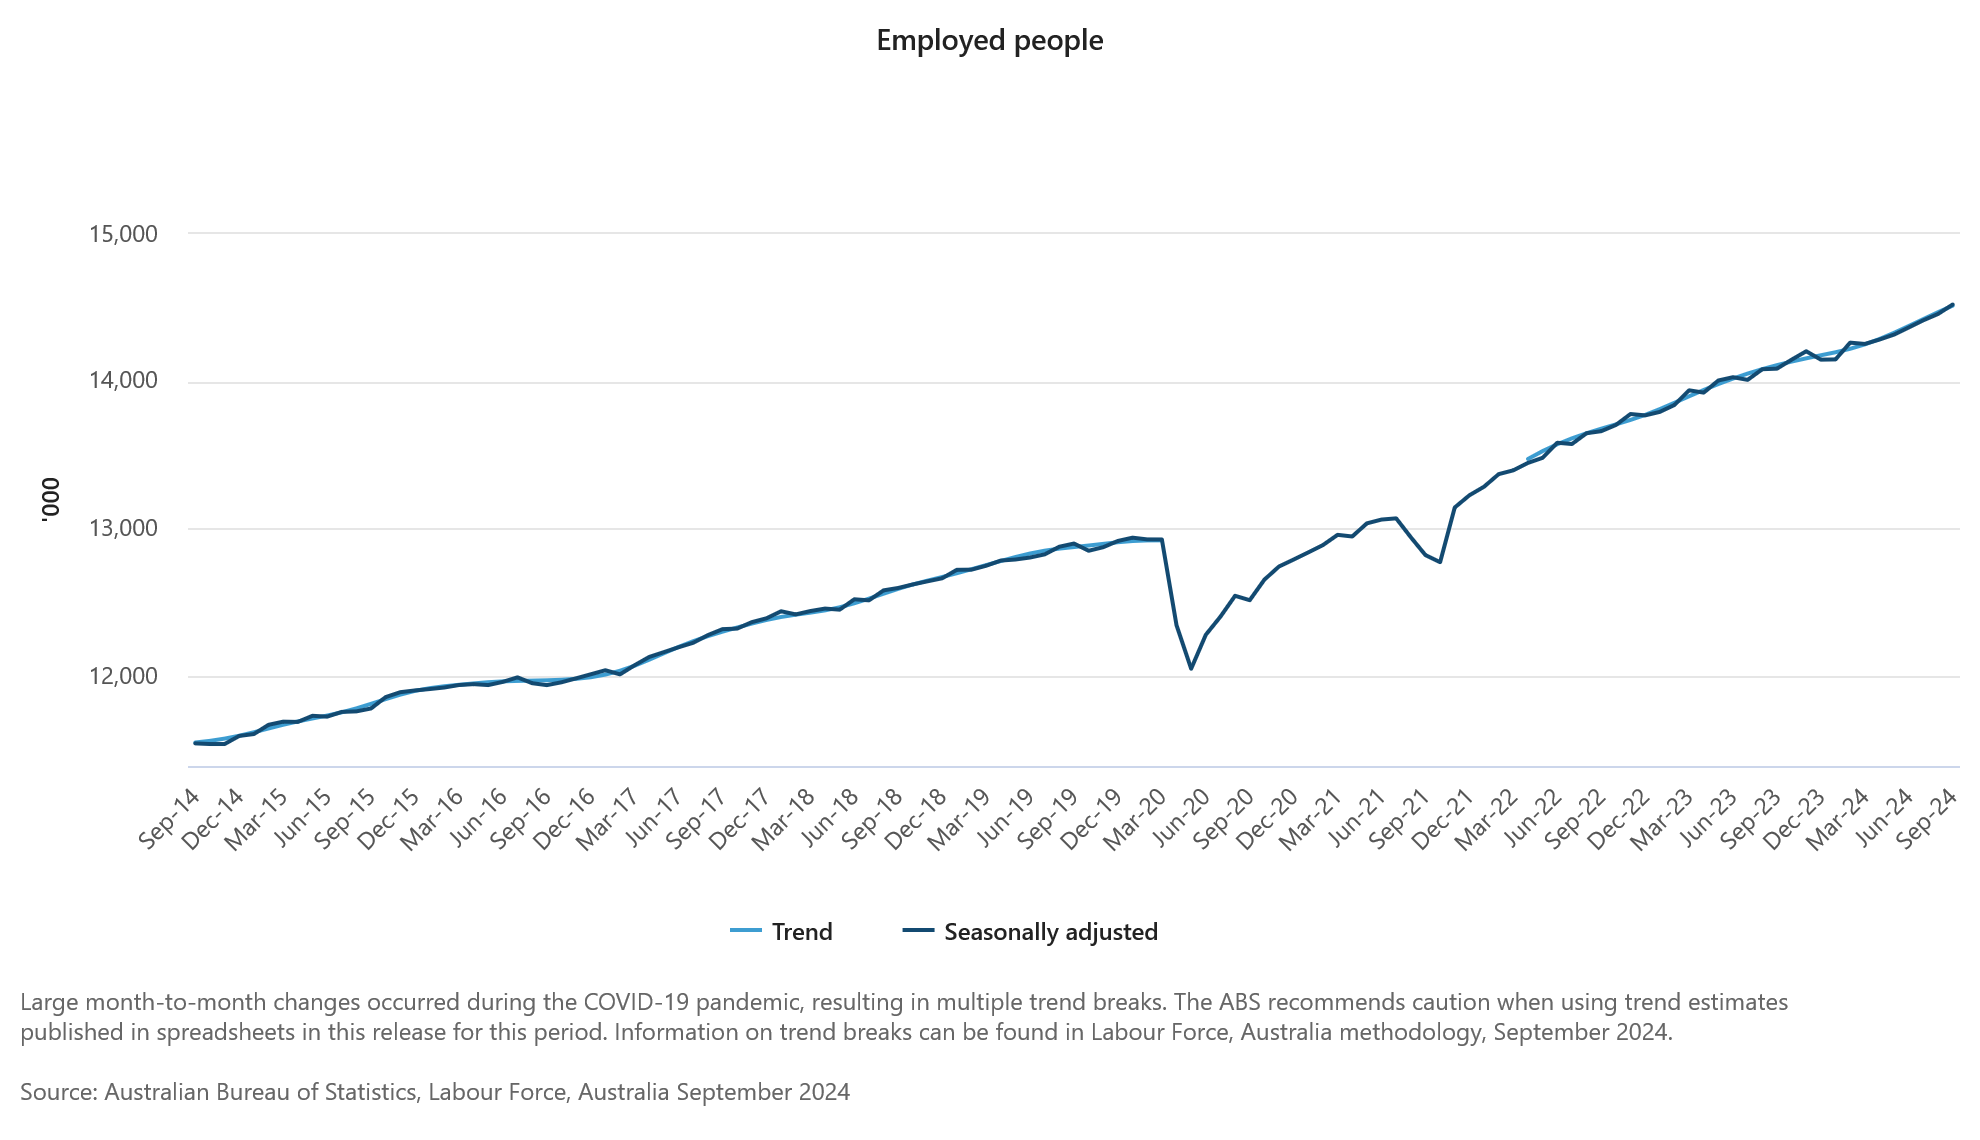
Australia's employment figures for September showed stronger-than-expected growth, with 64.1k jobs added, significantly exceeding forecast of 25.2k. Full-time employment led the gains, rising by 51.6k, while part-time jobs increased by 12.5k.
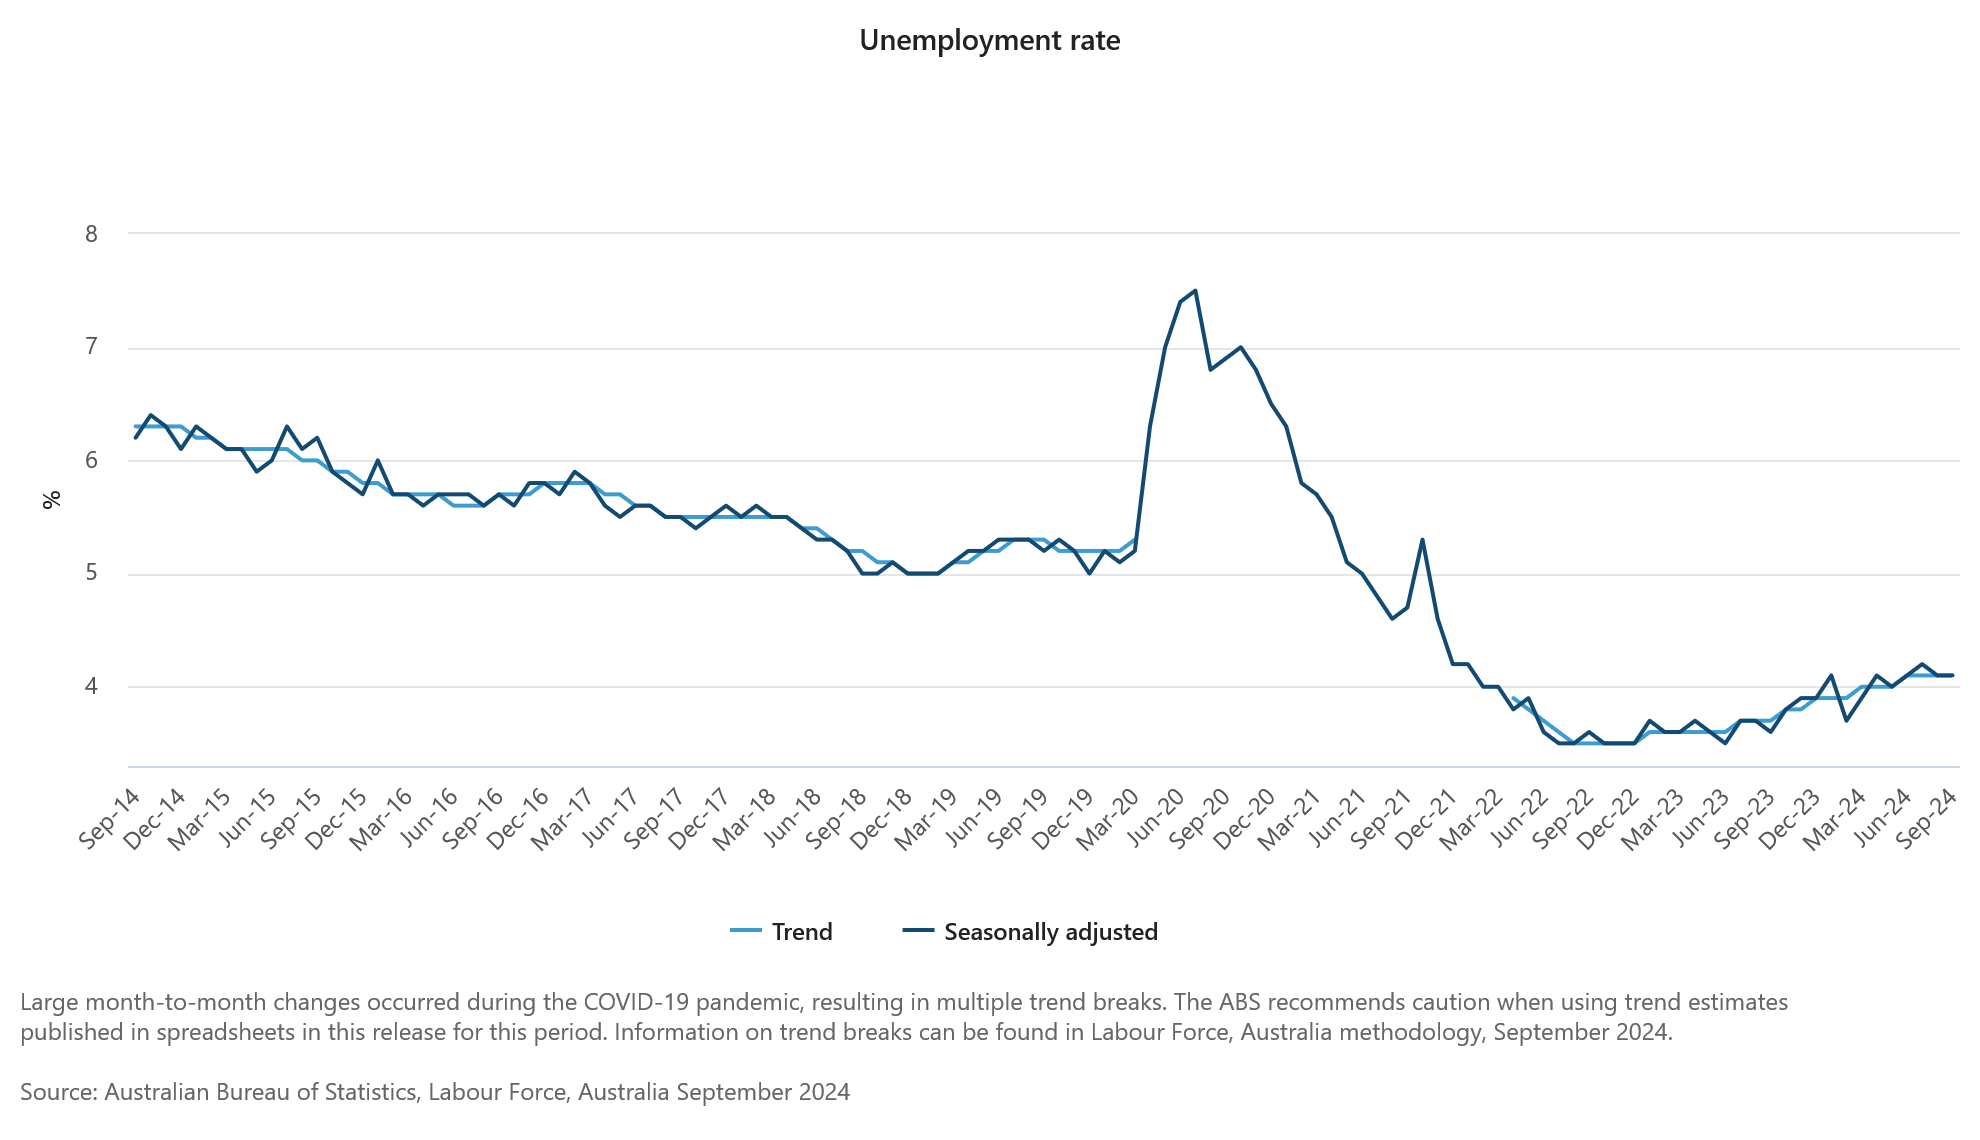
Unemployment rate remained steady at 4.1%, slightly better than the expected 4.2%. Participation also increased by 0.1% to 67.2%, indicating higher workforce engagement. Monthly hours worked saw a modest rise of 0.3% mom.
Over the past year, employment has grown by 3.1%, outpacing the civilian population growth of 2.5%. This pushed the employment-to-population ratio to a historical high of 64.4%, reflecting robust labor market conditions.
Australia's NAB business confidence drops to -6 in Q3, inflation pressures ease slightly as margins squeezed
Australia’s NAB quarterly Business Confidence declined from -2 to -6 in Q3. Business conditions also dropped from 5 to 2, with trade conditions falling from 9 to 5, profitability slipping from 2 to 0, and employment conditions down from 5 to 3, signaling softer economic momentum.
Leading indicators weakened, with expected business conditions for the next 3 months falling from 11 to 10, and for the next 12 months from 15 to 12. Forward orders remained negative at -4, and capacity utilization eased from 83.6% to 83.0%. Capital expenditure plans also declined from 24 to 19, indicating reduced investment expectations.
Cost pressures remained persistent. Labor costs grew 1.2%, up from 1.1%, and purchase costs increased to 1.0%, up from 0.9%. Final product price growth, however, slowed from 0.6% to 0.4%, and retail price growth remained steady at 0.7%, suggesting inflationary pressures are easing but at the expense of business margins.
NAB Head of Australian Economics Gareth Spence noted, “Labor cost growth remains elevated, and wage costs are the top issue affecting business confidence. While purchase cost growth persists, the marked drop in final product price growth suggests progress on inflation, though margins are under pressure.”
Japan's exports fall -1.7% yoy in Sep, first decline in 10 months
Japan's exports in September dropped by -1.7% yoy to JPY 9.038T, marking the first annual decline in 10 months. This slump was driven by weaker demand from key trading partners. Exports to China, Japan's largest market, fell by -7.3% yoy, while those to the US dropped by -2.4% yoy.
On the other hand, imports rose modestly by 2.1% yoy to JPY 9.333T, leading to a trade deficit of JPY -294B, the third consecutive monthly shortfall.
In seasonally adjusted terms, there was a small improvement. Exports grew by 2.0% mom to JPY 8.956T, while imports fell by -1.2% mom to JPY 9.144T. This led to a seasonally adjusted trade deficit of JPY -187B.
Looking ahead
ECB rate decision is the main event in European session. At the same time, Swiss trade balance, Eurozone trade balance and CPI final will also be released.
Later in the day, a batch of US data will be released including jobless claims, retail sales, Philly Fed survey, industrial production, business inventories and NAHB housing index.
AUD/USD Daily Report
Daily Pivots: (S1) 0.6646; (P) 0.6678; (R1) 0.6699; More...
Intraday bias in AUD/USD is turned neutral with current recovery, but further decline is expected as long as 0.6758 resistance holds. Below 0.6657 will resume the fall from 0.6941 short term top to 0.6621 structural support. Decisive break there will pave the way back to 0.6348 support next. Nevertheless, considering bullish convergence condition in 4H MACD, firm break of 0.6758 will turn bias back to the upside for retesting 0.6941 instead.
In the bigger picture, overall, price actions from 0.6169 (2022 low) are seen as a medium term corrective pattern, with rise from 0.6269 as the third leg. Firm break of 100% projection of 0.6269 to 0.6870 from 0.6340 at 0.6941 will target 138.2% projection at 0.7179. However, break of 0.6621 support will argue that rise from 0.6269 has completed and bring deeper fall back to 0.6269/6348 support zone.
ECB gears up for first back-to-back rate cut in 13 yrs
ECB is widely expected to cut the deposit rate by 25bps to 3.25% today, marking the first back-to-back rate reduction in 13 years. This step reflects ECB’s growing urgency to accelerate monetary easing as inflation cools faster than anticipated and persistent manufacturing struggles spill over into services and employment.
Although December had initially been considered the optimal time for the next cut, recent economic data has heightened concerns among ECB officials. Nevertheless, the December meeting remains significant, with updated economic projections that will shape the policy direction in 2025.
While the market is almost fully pricing in three further cuts through March 2025, ECB President Christine Lagarde is unlikely to offer explicit guidance today. However, the underlying message will likely suggest that another cut in December is likely unless the economic outlook improves.
Technically, EUR/USD's fall from 1.1213 short term top is in progress. Near term outlook will stay bearish as long as 55 D EMA (now at 1.0999) holds. This decline is seen as the third leg of the corrective pattern from 1.1274 (2023 high). Next target is 61.8% retracement of 1.0447 to 1.1213 at 1.0740. Any further dovish tone from the ECB today could accelerate this downward movement.
Bitcoin Price Restarts Bullish Surge: Is The Next Peak Near?
Key Highlights
- Bitcoin price started a fresh surge after it cleared the $65,000 resistance zone.
- BTC surpassed a major bearish trend line with resistance at $63,200 on the 4-hour chart.
- Gold prices rallied further and traded above the $2,675 resistance.
- EUR/USD is consolidating losses above the 1.0850 zone.
Bitcoin Price Technical Analysis
Bitcoin price started a fresh increase above the $62,500 resistance zone. BTC/USD climbed the $64,000 and $65,000 levels to move into a positive zone.
Looking at the 4-hour chart, the price surpassed a major bearish trend line with resistance at $63,200. It settled above the $65,000 level, the 200 simple moving average (green, 4 hours), and the 100 simple moving average (red, 4 hours).
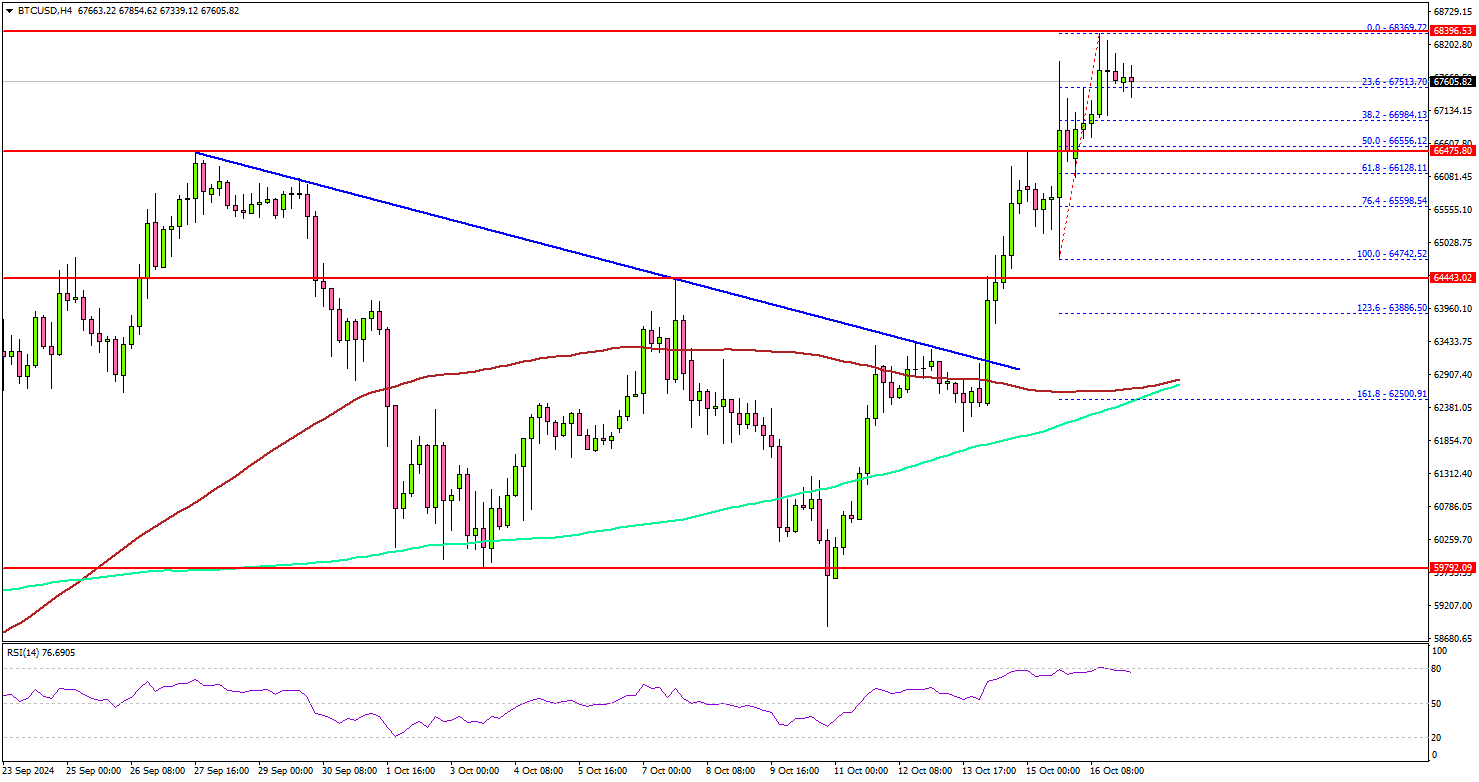
The increase was such that the price soared above the $67,500 level. It even spiked above $68,000 before the bears appeared. The price is now consolidating gains. Immediate support is near the $66,800 level.
The next key support sits at $66,400. A downside break below $66,400 might send Bitcoin toward the $64,500 support. Any more losses might send the price toward the $63,500 support zone.
On the upside, the price could face resistance near the $68,500 level. The next key resistance is at $69,200. A successful close above $69,200 might start another steady increase. In the stated case, the price may perhaps rise toward the $71,500 level or even a new all-time high.
Looking at EUR/USD, the pair saw a lot of bearish moves and recently started a consolidation phase above the 1.0850 support.
Today’s Economic Releases
- US Initial Jobless Claims - Forecast 258K, versus 258K previous.
- US Retail Sales for Sep 2024 (MoM) – Forecast +0.3%, versus +0.1% previous.
- US Industrial Production for Sep 2024 (MoM) – Forecast -0.2%, versus +0.8% previous.
Australia’s employment grows 64.1k in Sep, unemployment rate unchanged at 4.1%
Australia's employment figures for September showed stronger-than-expected growth, with 64.1k jobs added, significantly exceeding forecast of 25.2k. Full-time employment led the gains, rising by 51.6k, while part-time jobs increased by 12.5k.
Unemployment rate remained steady at 4.1%, slightly better than the expected 4.2%. Participation also increased by 0.1% to 67.2%, indicating higher workforce engagement. Monthly hours worked saw a modest rise of 0.3% mom.
Over the past year, employment has grown by 3.1%, outpacing the civilian population growth of 2.5%. This pushed the employment-to-population ratio to a historical high of 64.4%, reflecting robust labor market conditions.
Australia’s NAB business confidence drops to -6 in Q3, inflation pressures ease slightly as margins squeezed
Australia’s NAB quarterly Business Confidence declined from -2 to -6 in Q3. Business conditions also dropped from 5 to 2, with trade conditions falling from 9 to 5, profitability slipping from 2 to 0, and employment conditions down from 5 to 3, signaling softer economic momentum.
Leading indicators weakened, with expected business conditions for the next 3 months falling from 11 to 10, and for the next 12 months from 15 to 12. Forward orders remained negative at -4, and capacity utilization eased from 83.6% to 83.0%. Capital expenditure plans also declined from 24 to 19, indicating reduced investment expectations.
Cost pressures remained persistent. Labor costs grew 1.2%, up from 1.1%, and purchase costs increased to 1.0%, up from 0.9%. Final product price growth, however, slowed from 0.6% to 0.4%, and retail price growth remained steady at 0.7%, suggesting inflationary pressures are easing but at the expense of business margins.
NAB Head of Australian Economics Gareth Spence noted, “Labor cost growth remains elevated, and wage costs are the top issue affecting business confidence. While purchase cost growth persists, the marked drop in final product price growth suggests progress on inflation, though margins are under pressure.”
Full Australia quarterly NAB business confidence release here.