Sample Category Title
Japan’s exports fall -1.7% yoy in Sep, first decline in 10 months
Japan's exports in September dropped by -1.7% yoy to JPY 9.038T, marking the first annual decline in 10 months. This slump was driven by weaker demand from key trading partners. Exports to China, Japan's largest market, fell by -7.3% yoy, while those to the US dropped by -2.4% yoy.
On the other hand, imports rose modestly by 2.1% yoy to JPY 9.333T, leading to a trade deficit of JPY -294B, the third consecutive monthly shortfall.
In seasonally adjusted terms, there was a small improvement. Exports grew by 2.0% mom to JPY 8.956T, while imports fell by -1.2% mom to JPY 9.144T. This led to a seasonally adjusted trade deficit of JPY -187B.
GBP Price Action Ideas: GBP/USD, GBP/JPY and EUR/GBP
- The GBP has been declining against the USD due to softer-than-expected UK economic data, leading to expectations of more aggressive rate cuts by the Bank of England.
- GBP/USD is at a crucial level of 1.3000, a break below which could lead to further downside.
- GBP/JPY is showing signs of a potential breakout, with price coiling between the 100 and 200-day moving averages.
- EUR/GBP is near the YTD low, with immediate resistance at 0.8400. The pair’s future direction will depend on the GBP’s strength and the ECB’s decision.
The GBP has steadily declined against the greenback in recent weeks, while remaining stable against the Euro. This weakness in the British pound is attributed to market participants pricing in more aggressive rate cuts due to softer-than-expected data.
The Euro meanwhile continues to engage in a tug of war with the GBP but appears to be winning at present, much to my surprise. The JPY yen has been the major loser of late, unable to capitalize on GBP weakness. GBP/JPY continues to inch higher as there remains weakness in the Japanese Yen ahead of the election at the end of the month.
UK Inflation Data Surprise
This morning the UK’s Office for National Statistics released a mild Consumer Price Index (CPI) report for September. It showed that annual inflation dropped to 1.7%. While prices were expected to slow down, they were predicted to decrease to 1.9% from 2.2% in August. Monthly inflation stayed the same.
The most important print however came from services inflation which has been a sticky point for the Bank of England. According to the ONS, services inflation dropped more than expected, from 5.6% to 4.9%. This was not only below what experts predicted but also much lower than the Bank of England’s forecast of 5.5%. This softer result could lead to more interest rate cuts in the upcoming Bank of England meetings this year.
All is not lost for the UK and the Pound as the Bank of England are still priced in to cut rates at around the same pace as the Federal Reserve. Initially the pound had been benefitting from the potential of rate divergence with the US Dollar in particular, however any such hopes appear to have been dashed following the latest UK inflation report.
Technical Analysis
GBP/USD
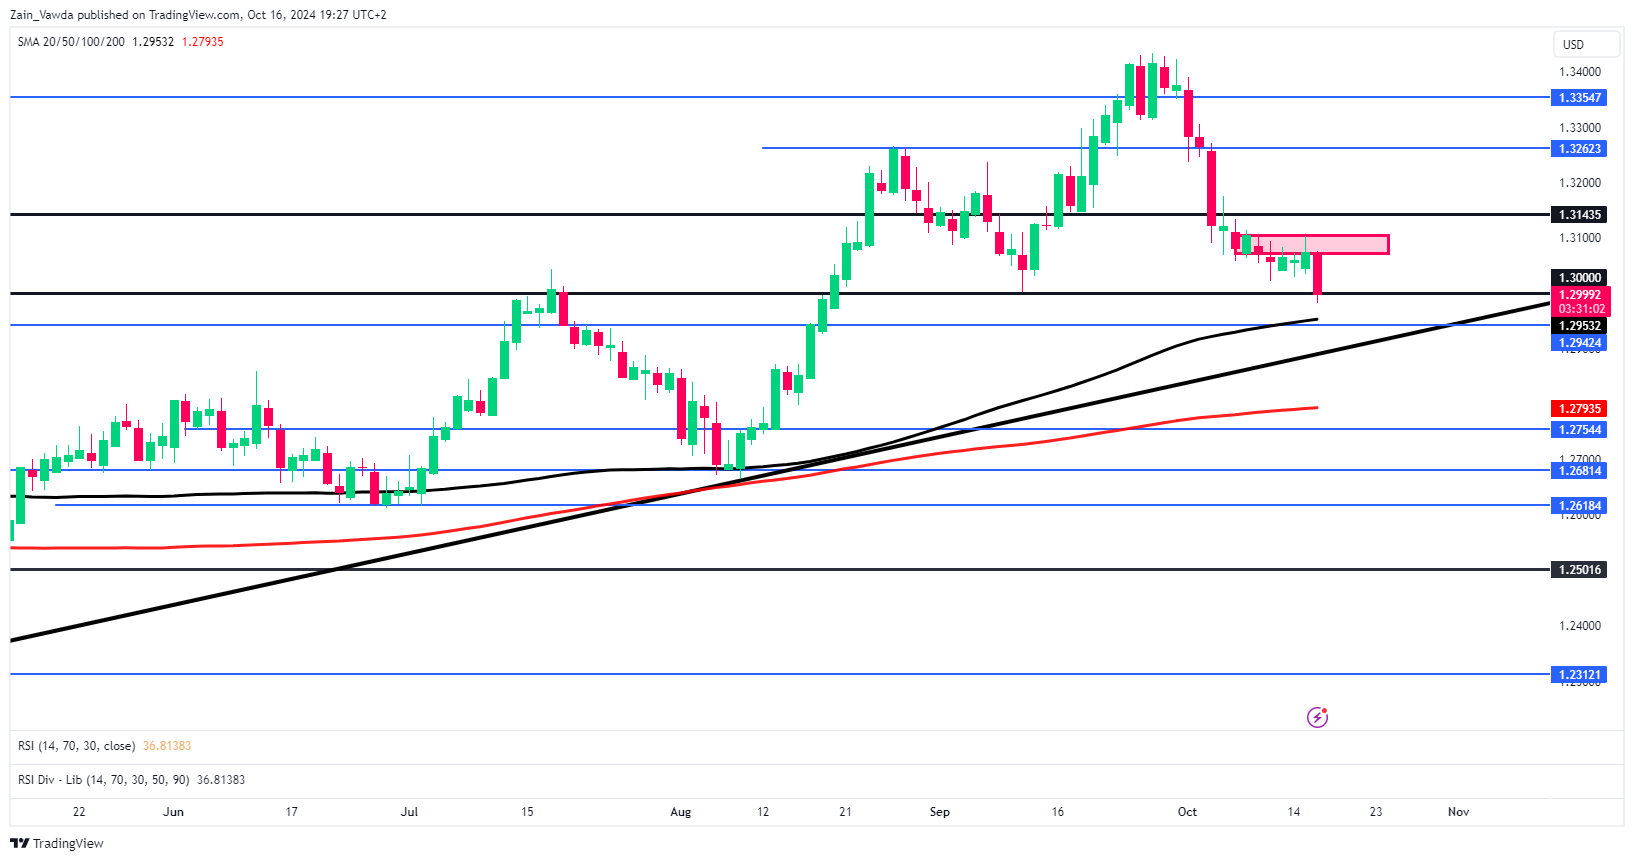
From a technical standpoint, GBP/USD is at a very important level with the 1.3000 psychological level in play. A daily candle close below this level could open up further downside for the pair.
A daily candle close below the 1.3000 will face support around the 1.2950 handle which an area of confluence which houses the 100-day MA. Below this we do have the long term ascending trendline as well which could come into play for the first time since the previous touch on August 8.
There are two scenarios that could develop in the day/days ahead. The first one being a bounce of the 100-day MA and a retest of the 1.3000 or potentially the 1.3100 handle (pink box on the chart) before the downtrend continues.
The second scenario, is a continued selloff until a touch of the trendline before a bounce occurs. At this stage both of these events are plausible as I do not see enough bearish pressure for a clean break of the ascending trendline at this stage. Now I could be wrong and we of course may break through the trendline as well, but I believe such a move may require a catalyst of sorts before it materializes.
Support
- 1.2950 (100-day MA)
- 1.2900
- 1.2793 (200-day MA)
Resistance
- 1.3040
- 1.3100
- 1.3143
GBP/USD Daily Chart, October 16, 2024
Source: TradingView.com (click to enlarge)
GBP/JPY
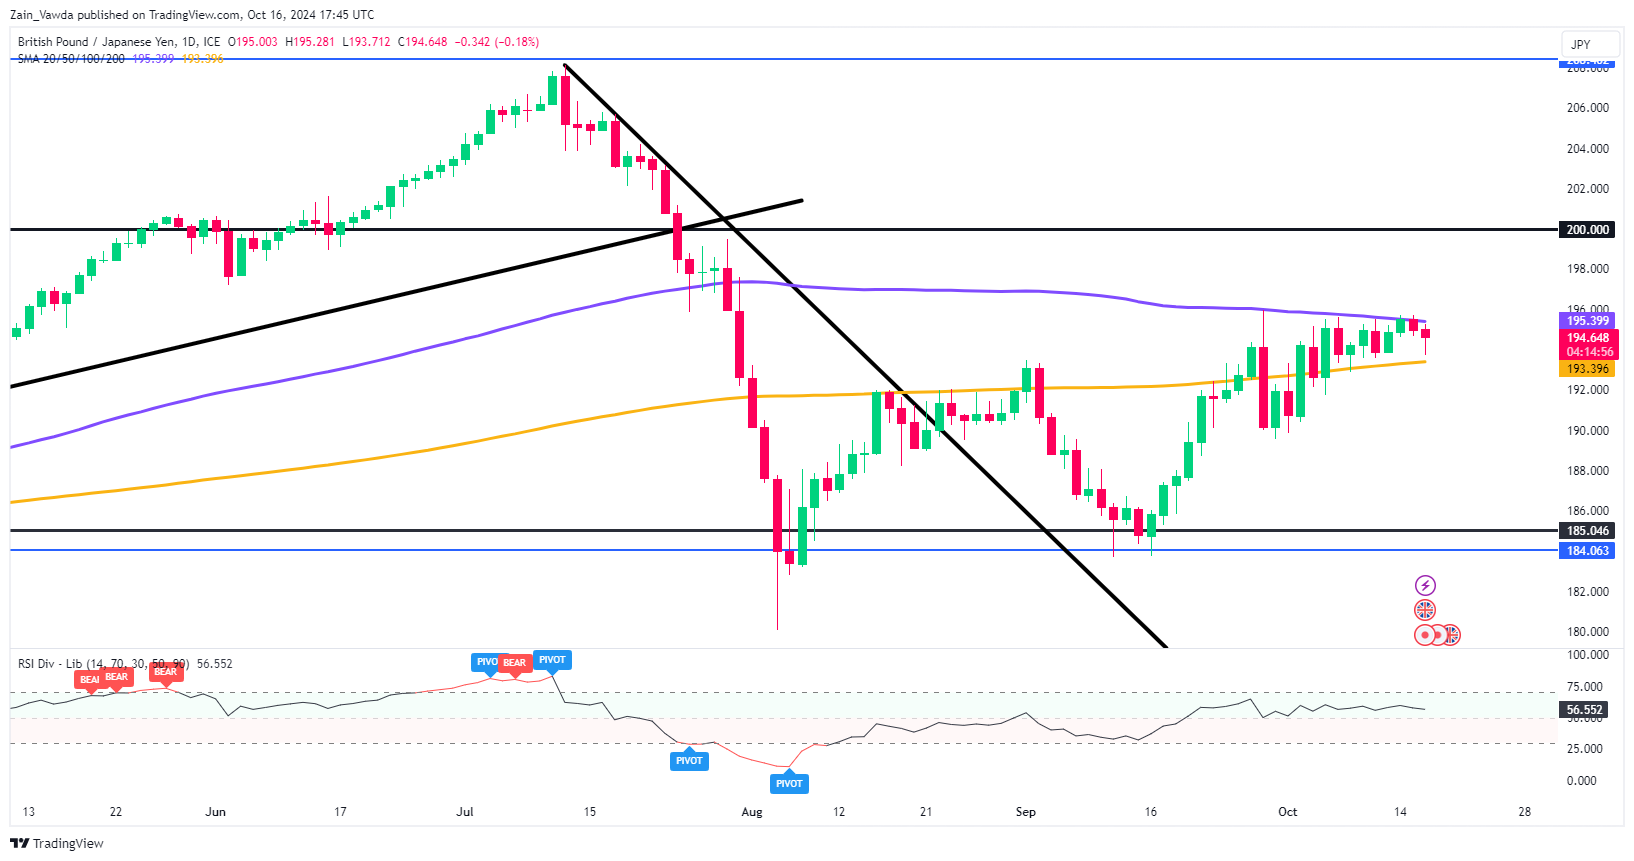
GBP/JPY has been inching its way higher since bottoming out on August 5. There was another push down to the mid 180s on September 16 before the move higher began once more.
GBP/JPY appears poised for a breakout after looking at recent price action. Price has been coiling between the 100 and 200-day MA since October 4. Usually when price is constricted in such a way, the longer the breakout takes the more aggressive it is.
On a daily timeframe a break and daily candle close below the 190.00 lower swing high would invalidate the bullish trend.
For now though a break to the upside seems more plausible based on price action and the overall trend.
GBP/JPY Daily Chart, October 16, 2024
Source: TradingView.com (click to enlarge)
Support
- 193.40 (200-day MA)
- 190.00
- 187.60
Resistance
- 195.40 (100-day MA)
- 198.00
- 200.00
EUR/GBP
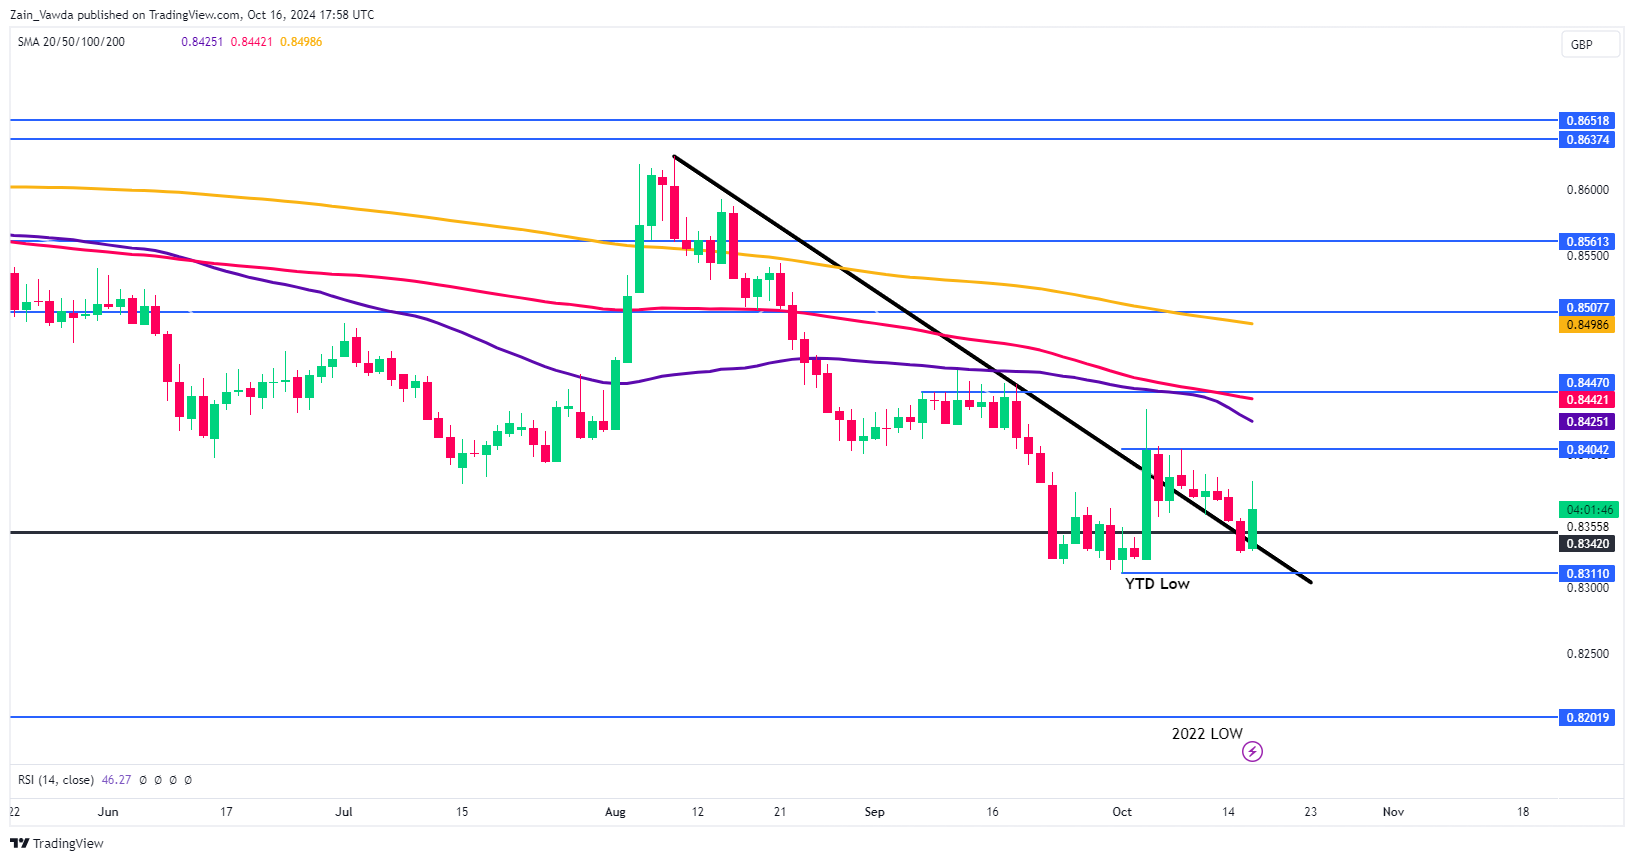
EUR/GBP remains near the YTD low around the 0.8300 handle. The pair is enjoying a bullish bounce today but there does appear to be significant technical hurdles if the GBP is to lose more ground to the Euro.
Immediate resistance rests at 0.8400 with a key area of confluence resting just above. The region between 0.8425-0.8450 plays host to the 50 and 100-day MAs as well as the most recent swing high.
Conversely, should the GBP strengthen in light of the ECB decision on Thursday then the 2022 lows around 0.8200 may become a real possibility.
EUR/GBP Daily Chart, October 16, 2024
Source: TradingView.com (click to enlarge)
Support
- 0.8311
- 0.8250
- 0.8200
Resistance
- 0.8400
- 0.8425
- 0.8447
US Dollar Index (DXY) Outlook: DXY Breaches the 100-day MA, Will Rally Continue?
- The US Dollar Index (DXY) continues to advance due to a lack of impactful US data and expectations of robust retail sales.
- Donald Trump’s comments on tariffs and the Federal Reserve’s independence.
- The DXY faces technical challenges, with the RSI in overbought territory, but the overall outlook remains bullish.
Most Read:
The US Dollar Index (DXY) continues its advance with the lack of high impact US data keeping the greenback on the front foot. A move lower in the DXY may need a batch of softer US data which thus far has not been forthcoming. US retail sales this week is expected to remain robust which will keep the Dollar supported.
Yesterday, Donald Trump addressed an event where he highlighted two key market issues: tariffs and the Federal Reserve’s independence. He took a notably hawkish stance on protectionism, specifically focusing on U.S. car imports from Europe and Mexico. Regarding the Fed, he stated he wouldn’t interfere with its independence, yet asserted that the president should have a voice in rate decisions.
As elections draw closer in the US we may see demand for the US Dollar increase. The uncertainty around the election could help the US Dollars safe haven appeal and thus keep the greenback advancing until after the election.
Markets are now expecting less aggressive Fed rate cuts in November and December which does bode well for the USD. Policymakers from the Federal Reserve continue to caution around the rate cut cycle, Governor Waller elaborated on this in a speech delivered at Stanford University.
Governor Waller elaborated further stating that the baseline expectation remains to gradually lower the policy rate over the coming year, regardless of short-term developments. When questioned about the job market’s current state, Waller noted, “The labor market is still robust, even though labor demand is easing.”
US Federal Reserve Rate Cut Probabilities, November Meeting
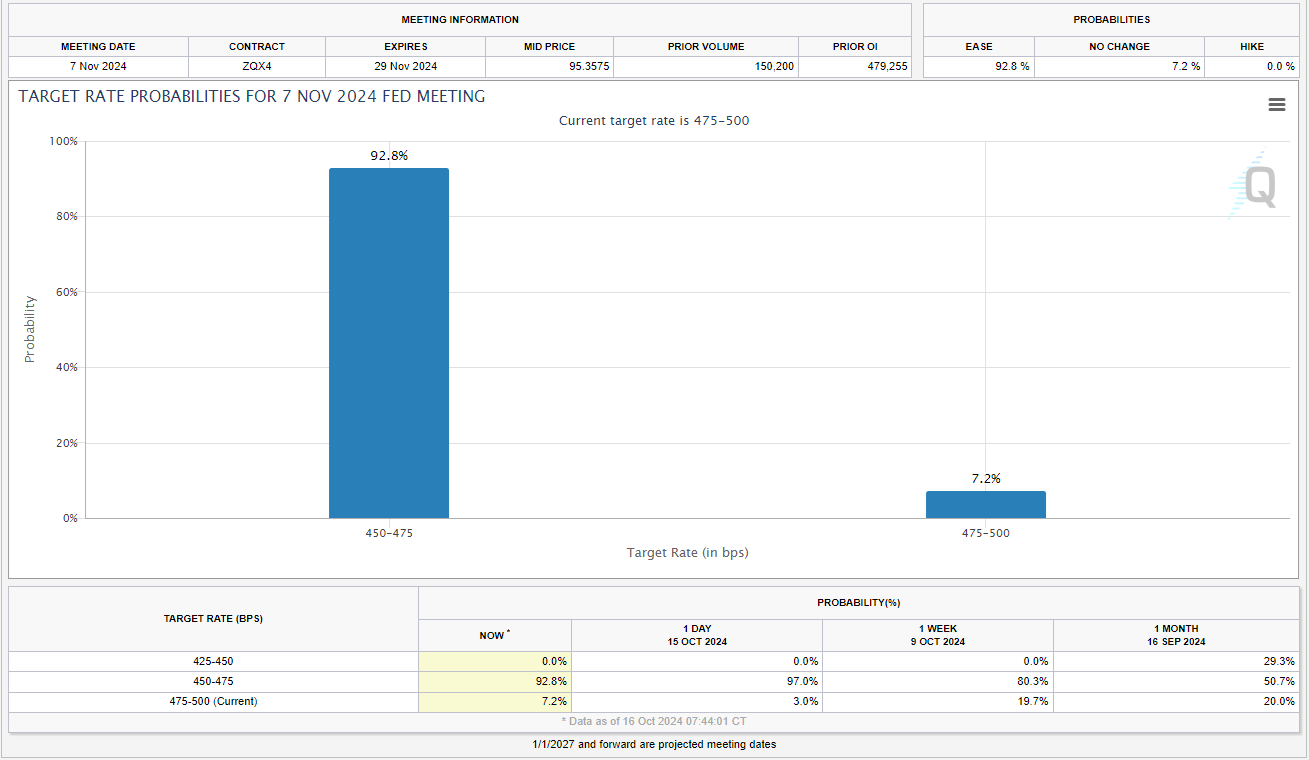
Source: CME FedWatch Tool
The outlook for the Dollar remains bullish despite some technical concerns. How much further can the rally go?
Economic Data Ahead
The week ahead is a relatively quiet one when it comes to high impact US data. The only notable event on the calendar this week is retail sales which market participants believe will come in better than expected.
Technical Analysis – US Dollar Index
The US dollar’s rally has been an impressive one, but there are a host of challenges that lie in wait from a technical perspective.
Firstly the RSI on the daily has finally crossed into overbought territory. Now, the issue with this is markets can oftentimes be in overbought on the RSI but continue to rise. Having broken above the 100-day MA for the first time since July with a daily candle close above this MA setting the tone for further gains.
Immediate resistance is at the confluence area which houses the 200-day MA around the 103.70 handle with further resistance areas resting at 104.00 and the psychological 105.00 handle.
Conversely a retracement here may find support at 103.00, 102.16 and 101.00
US Dollar Index Chart, October 16, 2024
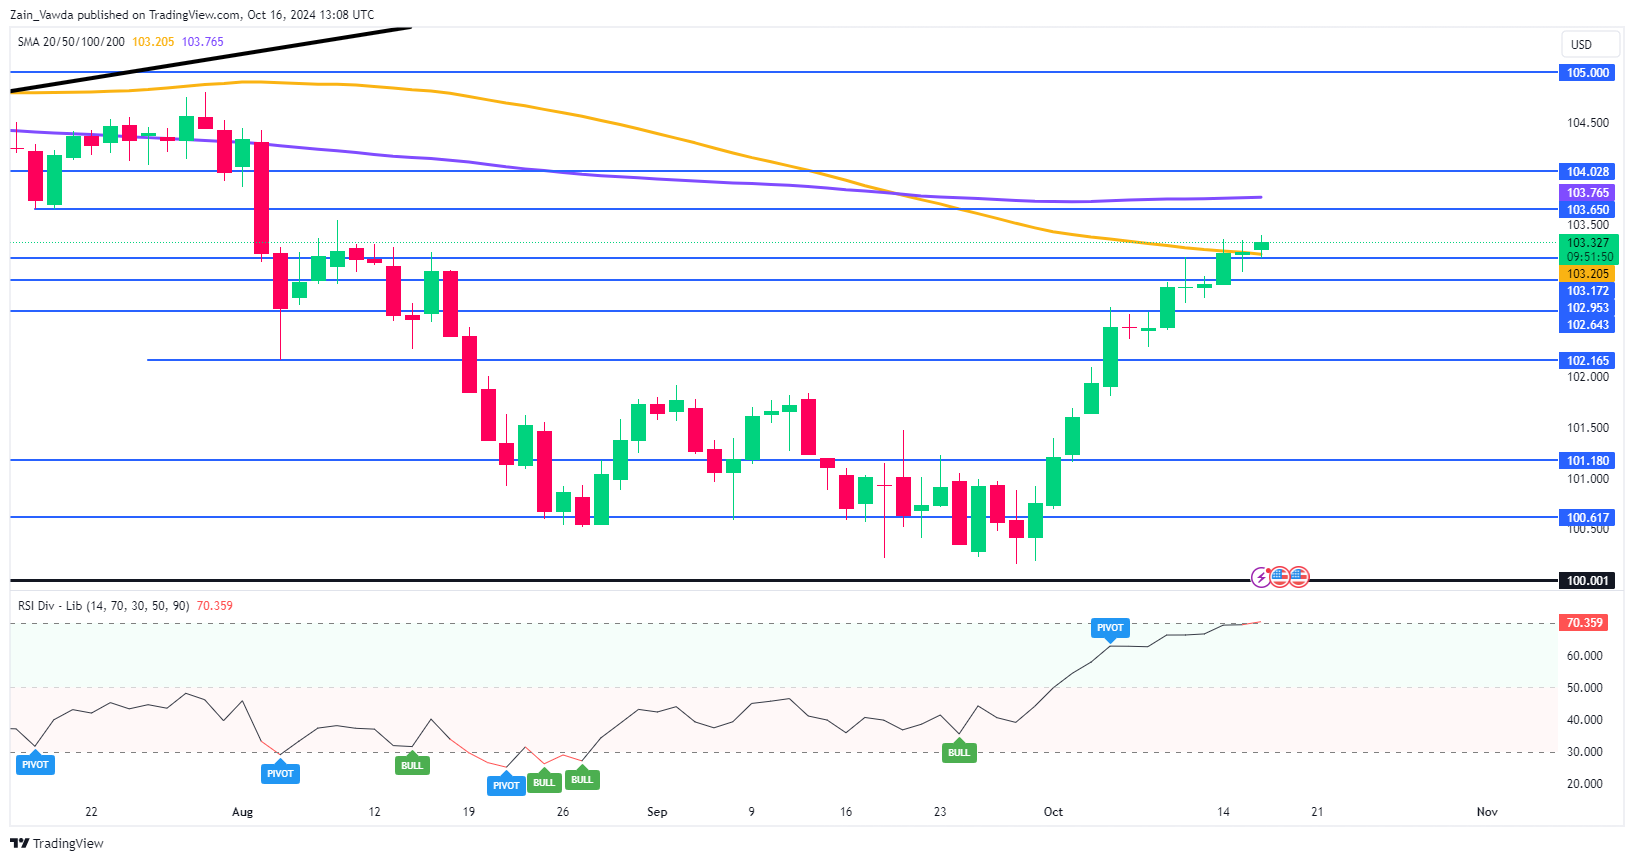
Source: TradingView (click to enlarge)
Support
- 103.00
- 102.16
- 101.00
Resistance
- 103.70
- 104.00
- 105.00
GBPCAD Wave Analysis
- GBPCAD reversed from resistance zone
- Likely to fall to support level 1.7750
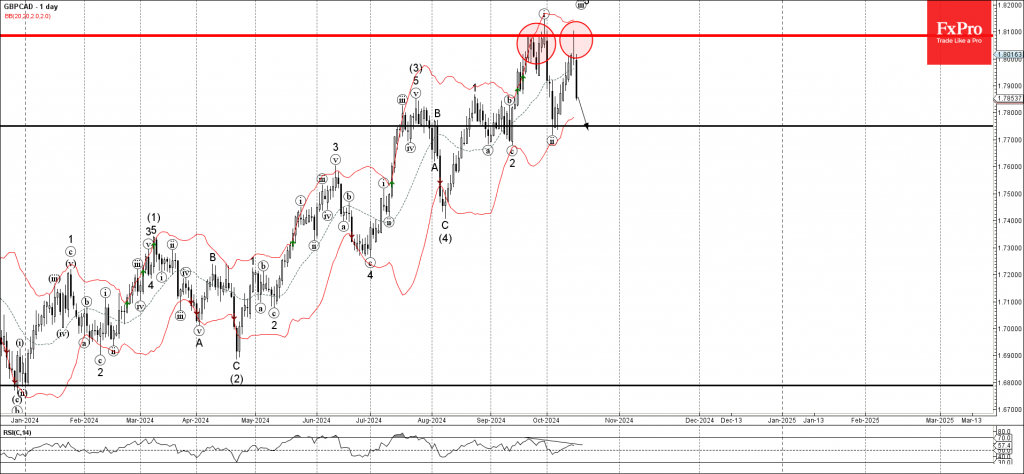
GBPCAD currency pair recently reversed down from the key resistance zone between the strong resistance level 1.8085 (which stopped the previous impulse wave i) and the upper daily Bollinger Band.
The downward reversal from this resistance zone created the well-formed daily Japanese candlesticks reversal pattern Shooting Star Doji.
Given the strength of the resistance level 1.8085 and the bearish divergence on the daily RSI, GBPCAD currency pair can be expected to fall further to the next support level 1.7750 (former low of wave ii from the start of this month).
USDCHF Wave Analysis
- USDCHF broke resistance zone
- Likely to rise to resistance level 0.8730
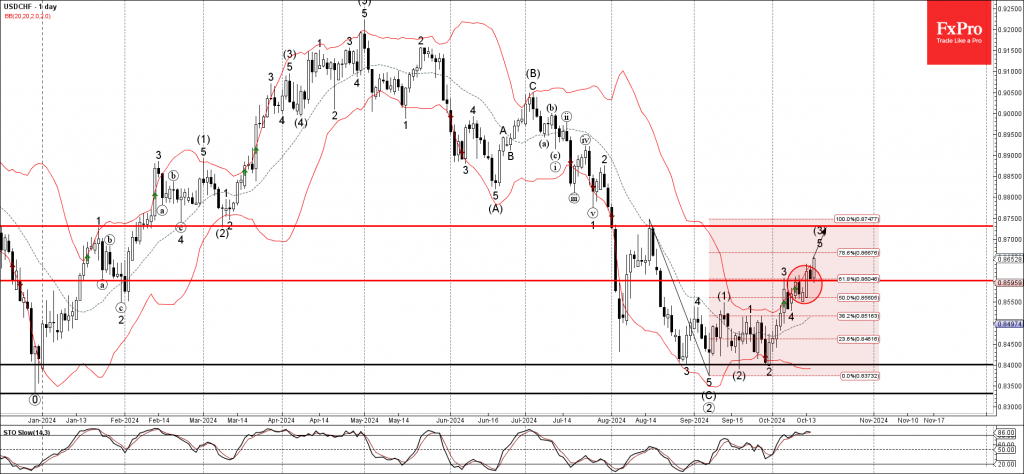
USDCHF currency pair recently broke the resistance zone between the resistance level 0.8600 (which stopped the previous impulse wave 3) and the 61.8% Fibonacci correction of the downward impulse from August.
The breakout of this resistance zone accelerated the minor impulse wave 5 of the higher order impulse wave (3) from September.
Given the continuation of the bullish US dollar sentiment, coupled with significant Swiss franc outflows, USDCHF currency pair can be expected to rise further to the next resistance level 0.8730 (former monthly high from August).
Sunset Market Commentary
Markets
EUR/GBP spiked from 0.8325 to 0.8375 following September UK inflation numbers, but the euro isn’t strong enough these days to profit from GBP-weakness. Even as UK yields drop 8 bps (30-yr) to 11 bps (2-yr) across the curve. Headline inflation was flat in M/M-terms, resulting in the first sub-2% inflation print since April 2021. As is for Europe and the ECB, inflation is expected to move back above the BoE’s 2% inflation target toward year-end as energy base effects switch signs. Transport-related prices (petrol prices,…) and services costs (-0.3% M/M; mainly airfares) were the main monthly negative contributors. Core CPI slowed to 0.1% M/M and 3.2% Y/Y (from 3.6% Y/Y; lowest since September 2021). Services inflation recorded a first below-5% Y/Y figure since May 2022 (4.9% from 5.6%), again mainly because of the volatile airfare component. Core services inflation likely slowed less, from 5.5% Y/Y to 5.3% Y/Y, warning against overinterpretation of today’s numbers. In combination with yesterday’s waning wage pressure, they nevertheless suffice for the Bank of England to pursuit governor Bailey’s more activist approach. The parallel with the ECB remains. The BoE started off with a 25 bps rate cut in August (albeit a close 5-4 call), next skipped a meeting in September, to make monetary policy again less restrictive in November (25 bps rate cut discounted). Backed by a new Monetary Policy Report, the market expects the BoE to prepare the road for more regular rate cuts from there on. The UK government’s 2025 budget (presented at the end of the month) is a wildcard, but we don’t expect it to derail the BoE’s plans.
Trading on main European and US markets is uneventful, counting down to tomorrow’s ECB policy meetings and US weekly jobless claims and retail sales. Core bonds regain some additional ground with German Bunds outperforming US Treasuries in the process. Brent crude prices hold near the recent sell-off lows around $74/b while EUR/USD treads water just below 1.09. European stock markets (-0.5%) fail to recover from yesterday’s ASML-triggered setback. Key US indices start the session fairly mixed.
News & Views
The Economic Experts survey, a quarterly study conducted by the Ifo Institute and the Swiss Economic Policy Institute, shows that experts from around the world expect inflation rates to remain above central banks’ targets. Ifo researcher Niklas Potrafke concludes that “due to these stagnating inflation expectations, central banks could hold back on further interest rate cuts.” Worldwide, inflation could reach 4% in 2024, 3.9 % next year and 3.6 % in 2027. Inflation expectations for 2024 in Western Europe (2.5%) and North America (2.7%) are well below the global average. For 2027, experts still expect 2.1% in Western Europe and 2.4% in North America. In other parts of Europe, inflation expectations for 2027 are higher: 2.7% for Northern Europe, 3% for Southern Europe, and 5.9% for Eastern Europe. Among the regions with particularly high inflation expectations of more than 20% are South America and large parts of Africa.
Czech National Bank (CNB) board member Holub explained why he dissented at the September 25 monetary policy meeting. At that meeting, the CNB decided to cut the policy rate by 25 bps to 4.25%. Holub voted for a 50 bps reduction. Holub’s risk assessment is slightly more anti-inflationary while the Board in general sees risks to meeting the inflation target as mainly balanced. Current inflation and the near target outlook combined with moderate downside risks, according to Holub allow a forward looking approach to monetary policy with the focus on the medium term. Finetuning on the basis of incoming data is less appropriate given lags in the transmission of policy. At the same time, the economy is developing below potential and is recovering slowly. Fiscal policy has been restrictive throughout the year, hampering the economic recovery, in particular household consumption. Fed and ECB cuts are reducing the risk of a significant weakening of the korona even as domestic demand is weak. In this context, Holub sees risks that the negative effects of an excessively tight monetary policy would result in lower growth and inflation easing below target. Holub still votes at the November 7 meeting, but leaves the board in December. KBC expects the CNB to cut rates at the 3 upcoming meetings to 3.5% in February when a longer pause might kick in or what even might be the’ low’ of the cycle.
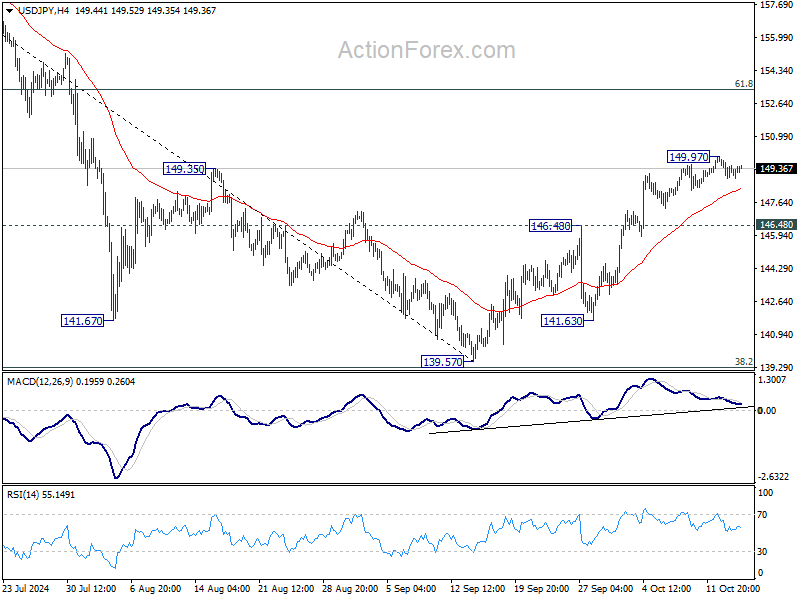
USD/JPY Mid-Day Outlook
Daily Pivots: (S1) 148.74; (P) 149.33; (R1) 149.80; More...
USD/JPY is staying in consolidation below 149.97 temporary top and intraday bias stays neutral. Further rally is expected with 146.48 resistance turned support intact. Above 149.97 will resume the rise from 139.57 to 61.8% retracement of 161.94 to 139.57 at 153.39 next. However, firm break of 146.48 will argue that such rebound has completed, and turn bias back to the downside for retesting 139.57 low.
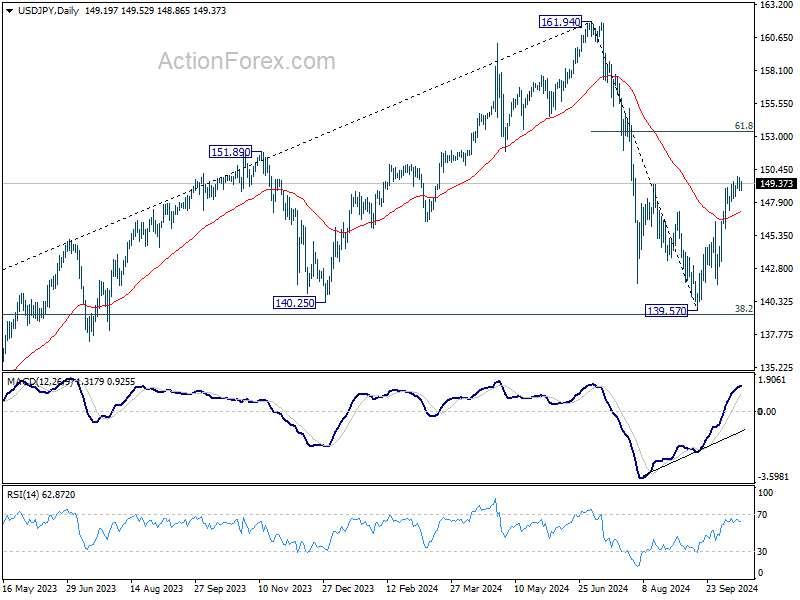
In the bigger picture, price actions from 161.94 are seen as a corrective pattern to rise from 102.58 (2021 low). The range of medium term consolidation should now be set between 38.2% retracement of 102.58 to 161.94 at 139.26 and 161.94. Nevertheless, sustained break of 139.26 would open up deeper medium term decline to 61.8% retracement at 125.25.
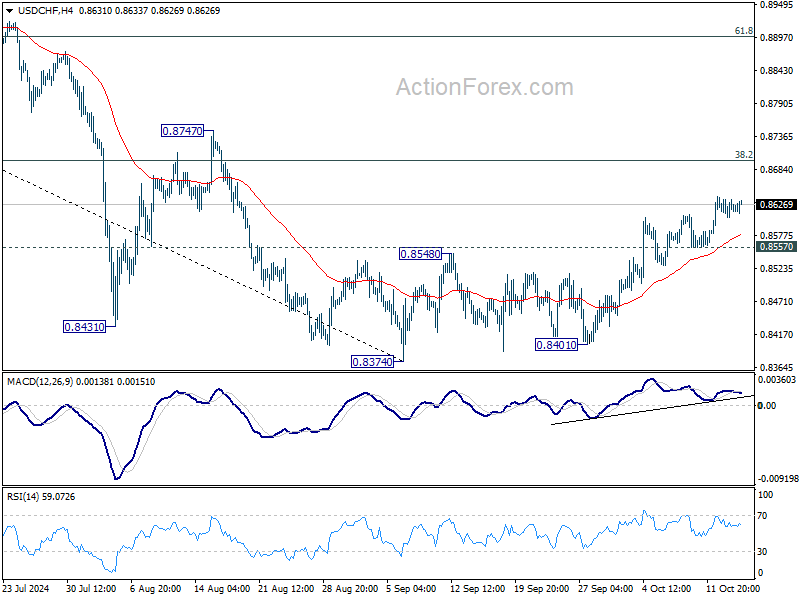
USD/CHF Mid-Day Outlook
Daily Pivots: (S1) 0.8606; (P) 0.8623; (R1) 0.8638; More…
USD/CHF's rise from 0.8374 is in progress and intraday bias stays on the upside for 38.2% retracement of 0.9223 to 0.8374 at 0.8698. Sustained break there will argue that fall from 0.9223 has completed after defending 0.8332 low. Further rally should be seen to 61.8% retracement at 0.8899 next. On the downside, below 0.8557 minor support will turn intraday bias neutral again first.
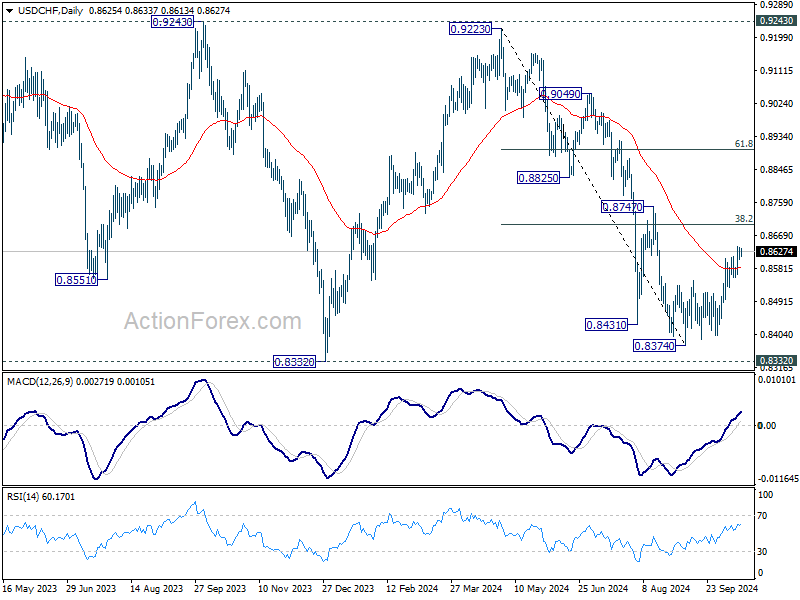
In the bigger picture, price actions from 0.8332 (2023 low) are currently seen as a medium term corrective pattern, with fall from 0.9223 as the second leg. Strong support could be seen from 0.8332 to bring rebound. Yet, overall outlook will continue to stay bearish as long as 0.9243 resistance holds. Firm break of 0.8332, however, will resume larger down trend from 1.0146 (2022 high).
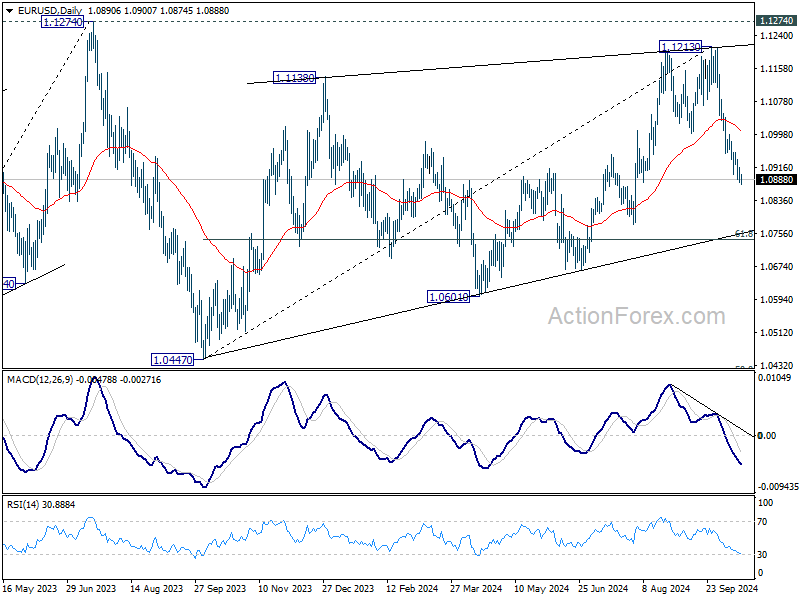
EUR/USD Mid-Day Outlook
Daily Pivots: (S1) 1.0876; (P) 1.0897; (R1) 1.0911; More....
EUR/USD's fall from 1.1213 is in progress and intraday bias remains on the downside. This decline is seen as the third leg of the corrective pattern from 1.1274. Deeper fall would be seen to 61.8% retracement of 1.0447 to 1.1213 at 1.0740 next. On the upside, above 1.0953 minor resistance will turn intraday bias neutral and bring consolidations first, before staging another decline.
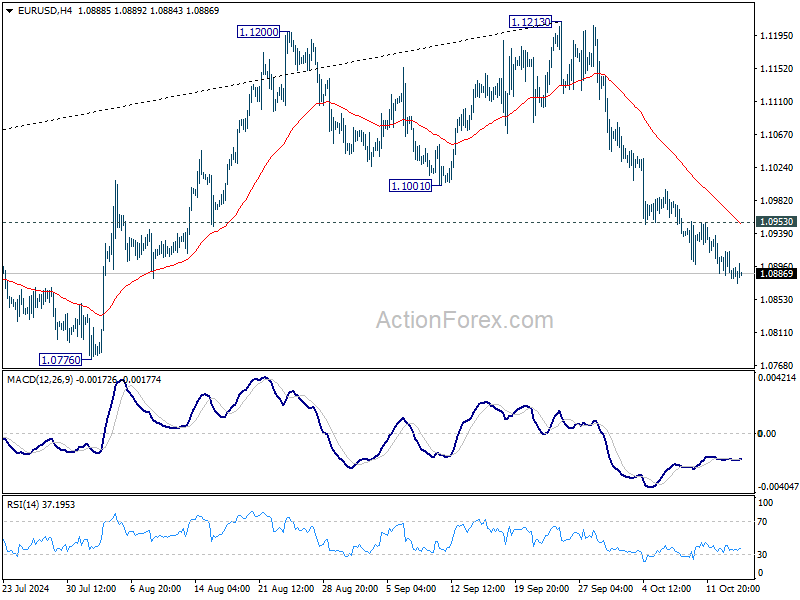
In the bigger picture, rejection by 1.1274 resistance suggests that corrective pattern from 1.1274 (2023 high) is not completed yet. Instead, decline from 1.1213 might be another falling leg. Sustained break of 55 W EMA (now at 1.0877) will validate this case, and bring deeper fall towards 1.0447 support again. But downside should be contained by 50% retracement of 0.9534 (2022 low) to 1.1274 at 1.0404.