Sample Category Title
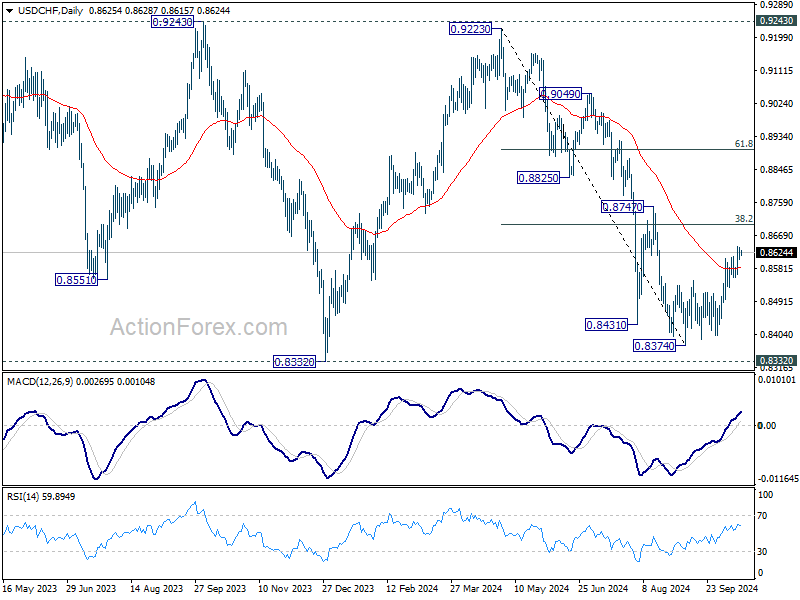
USD/CHF Daily Outlook
Daily Pivots: (S1) 0.8606; (P) 0.8623; (R1) 0.8638; More…
Intraday bias in USD/CHF remains on the upside at this point. Rise from 0.8374 short term bottom should target 38.2% retracement of 0.9223 to 0.8374 at 0.8698. Sustained break there will argue that fall from 0.9223 has completed after defending 0.8332 low. Further rally should be seen to 61.8% retracement at 0.8899 next. On the downside, below 0.8557 minor support will turn intraday bias neutral again first.
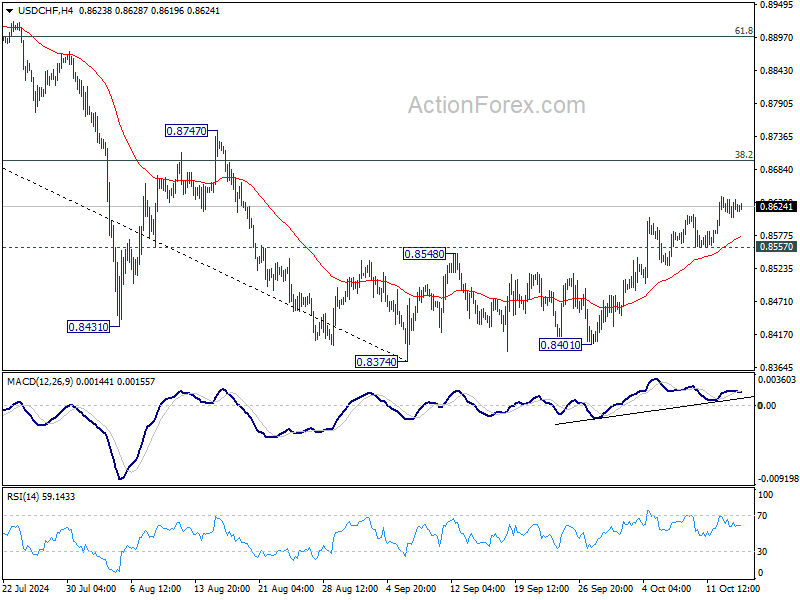
In the bigger picture, price actions from 0.8332 (2023 low) are currently seen as a medium term corrective pattern, with fall from 0.9223 as the second leg. Strong support could be seen from 0.8332 to bring rebound. Yet, overall outlook will continue to stay bearish as long as 0.9243 resistance holds. Firm break of 0.8332, however, will resume larger down trend from 1.0146 (2022 high).
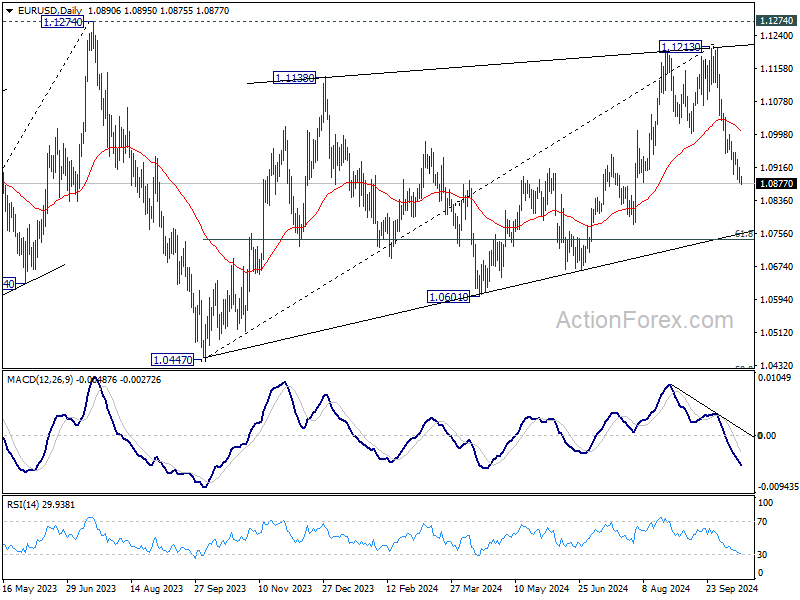
EUR/USD Daily Outlook
Daily Pivots: (S1) 1.0876; (P) 1.0897; (R1) 1.0911; More....
Intraday bias in EUR/USD stays on the downside at this point. Fall from 1.1213 is seen as the third leg of the corrective pattern from 1.1274. Deeper decline would be seen to 61.8% retracement of 1.0447 to 1.1213 at 1.0740 next. On the upside, above 1.0953 minor resistance will turn intraday bias neutral and bring consolidations first, before staging another decline.
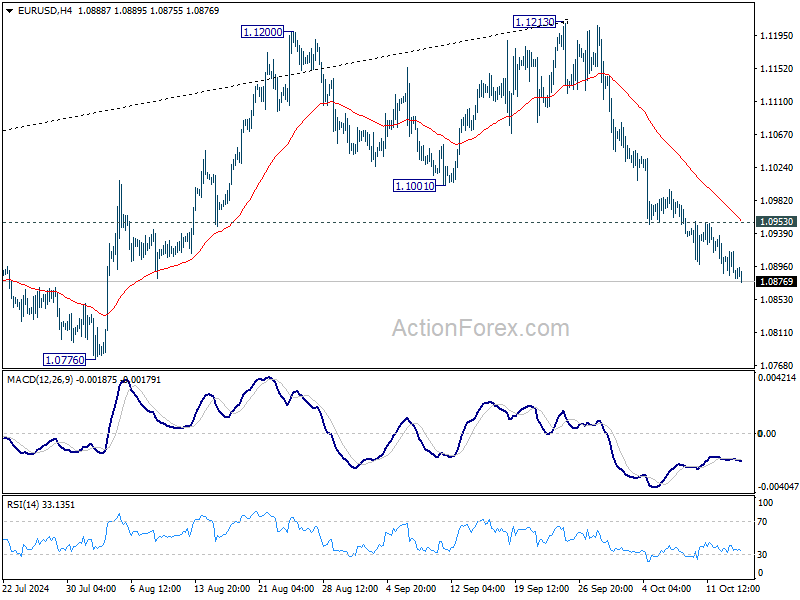
In the bigger picture, rejection by 1.1274 resistance suggests that corrective pattern from 1.1274 (2023 high) is not completed yet. Instead, decline from 1.1213 might be another falling leg. Sustained break of 55 W EMA (now at 1.0877) will validate this case, and bring deeper fall towards 1.0447 support again. But downside should be contained by 50% retracement of 0.9534 (2022 low) to 1.1274 at 1.0404.
A BoE 25 bps November Cut Priced In
Markets
Dutch chipmaker ASML sent shockwaves through the broader equity market yesterday. In its earnings report that it accidentally published one day ahead of schedule, Europe’s high-profile tech company cut the outlook for next year amid far less orders than investors expected. The EuroStoxx50 fell of a cliff after word from the economy-sensitive company got out, eventually tumbling about 2%. US stock markets ate the dust, the chip sector and broader tech in particular. The Nasdaq slipped around 1%. Asian stocks this morning lose territory in most cases but recovered from intraday lows. Chinese shares flirt with the green ahead of tomorrow’s news conference by the country’s housing minister. Long-term US yields were pressured as another sharp drop in oil prices capped the recent rise of inflation expectations. A disappointing NY manufacturing index (-11.9 vs +3.6 expected, from 11.5) and the risk-off resulted in losses of more than 9 bps (30-yr) eventually. The front end barely budged on any of the aforementioned triggers, suggesting markets are comfortable with current Fed pricing as we head into the November 5 US elections. German rates fell 4.7-5.4 bps across the curve. The USD eked out additional technical gains. EUR/USD broke below the 1.10 neckline of the double top formation earlier this month and slipped sub 1.0907 (50% retracement of the 2024 YtD low-high) yesterday. The 1.08 area still looks to be its short-term destination with the journey unhindered by today’s empty economic calendar. USD/JPY’s rally ran into resistance around the 150 lever. After a strong labour market report yesterday that pushed EUR/GBP back towards the YtD lows, UK inflation numbers this morning do the exact opposite. The pair jumps back higher (0.836) after the headline price level stabilized on a monthly basis to be 1.7% higher y/y. It’s the first sub 2% reading since April 2021 and fell short of a 1.9% consensus estimate. Underlying gauges such as core inflation (3.2%, down from 3.6%) and services inflation (4.9%, down from 5.6%) missed the bar for 3.4% and 5.2% respectively. Below-consensus PPIs topped it off. Bank of England governor recently called for a more activist approach in monetary easing, provided inflation continues to decelerate. Market importance of today’s numbers therefore outweigh that of yesterday’s. A 25 bps November cut is priced in.
News & Views
Inflation in New-Zealand dropped to 2.2% Y/Y in Q3 from 3.3% in Q2. It was the first time since March 2021 that annual inflation returned within the 1-3% target band of the Reserve Bank of New Zealand. ‘Prices are still rising, but not as much as previously recorded’, consumer prices manager Nicola Growden of Statistics New Zealand said. Consumer prices rose 0.6% from the previous quarter (was 0.4% in Q2), but this was still slightly below the 0.7% consensus estimate. Higher rent prices were the biggest contributor to annual inflation, up 4.5%. Price for local authority rates and payments increased by 12.2%. They were responsible for half of the quarterly 0.6% increase. Pharmaceutical prices increased 17% Q/Q. Tradables goods’ prices declined -0.2% Q/Q and -1.6% Y/Y. Non-tradeables rose 1.3% Q/Q and 4.9% Y/Y. RBNZ expected inflation at 2.3% in its August monetary policy statement. Inflation returning to target probably will convince the RBNZ that it can further reduce policy restrictiveness in order to support poor growth. Markets discount another 50 bps reduction at the November 27 meeting. Some even see a chance of a 75 bps step (35%). The kiwi dollar continues to trade in the defensive this morning at NZD/USD 0.606.
The Federal Reserve Bank of New York yesterday published its survey of consumer expectations. Consumers’ inflation expectations are mixed over the three horizons. Median inflation expectations remained unchanged at 3.0% at the one-year horizon, increased to 2.7% from 2.5% at the three-year horizon, and rose to 2.9% from 2.8% at the five-year horizon. Expectations on the labour market improved. The probability of leaving one’s job voluntarily in the next twelve months increased to 20.4% from 19.1% percent and the perceived probability of finding a job in the event of job loss increased to 52.7% from 52.3%. Year-ahead household income and spending growth expectations declined by 0.1 percentage point to 3.0% and 4.9% respectively. Perceptions and expectations of credit access improved compared to a year ago. However, the perceived probability of missing a minimum debt payment over the next three months increased to 14.2 % from 13.6%, the highest reading of the series since April 2020.
British Inflation Dips to 1.7% in September
Europe’s biggest company revealed its results a day earlier – by accident – and the results were not good at all. ASML booked about half of the orders pencilled in by analysts last quarter as demand outside AI continued to struggle. The company also cut its 2025 forecast and more details are to come, as the company wasn’t supposed to release earnings yesterday. Needless to say that ASML shares plunged 16% yesterday – the most in 26 years. The selloff dragged the Stoxx 50 down by 1.87%.
More bad news: stimulus measures that China announced by the end of September could’ve miraculously shown in the Q3 results of LVMH – which reported after the market close – but they did not. The Chinese didn’t rush to pop the champagne and to buy Vuitton bags as soon as they heard that China would be cutting the interest rates – among other measures – to reverse the fortunes of the country. LVMH results came as an early hint that the luxury item makers will have to wait longer before uncorking the champagne, on their side.
And the US’ advanced chipmakers didn’t have a good session, either, but for different reasons. The US announced yesterday that it will restrict the advanced chip exports from Nvidia to AMD to countries that do have connections to Gulf countries, for national security reasons as war in the Middle East is taking an uglier turn by the day. And well, the gulf countries are thirsty for AI and have deep pockets. The news resonated loudly across the chipmakers. Nvidia dived more than 4.50% from near record, AMD dropped more than 5%, and VanEck’s Semiconductor ETF took a 5% dive. Nasdaq 100 gave back 1.37%, as the S&P500 retreated 0.76% thanks to big US banks’ better-than-expected Q3 results.
Elsewhere, crude oil sold off heavily for the second session on relied that Israel is planning to hit Iran’s military rather than its energy structure. The barrel of US crude tipped a toe below the $70pb level and rebounded to close the session with a 2% loss. US crude trades a touch below the $71pb this morning, the MACD index on the daily chart just turned negative supporting the idea that oil is back to its bearish trend. Resistance is seen near $72pb, the major 38.2% Fibonacci retracement on summer retreat. The Chinese struggle and deteriorating global demand outlook are the major catalysts for potentially deeper losses. A move below the $70pb should pave the way to $65/67pb range.
Speaking of energy, Microsoft has announced – a few weeks earlier – that it would team up with Constellation energy to bring some nuclear reactors in the Three Mile Island back to life to satisfy its growing thirst for energy as AI is very, very energy-intensive, remember. Yesterday, Google announced that it’s investing in the development of next generation nuclear power by backing a company that’s building small modular reactors, from which it will buy energy when the sites start supplying energy. Capital inflows into nuclear have been stagnating for the past decade, but started gaining momentum since the war in Ukraine raised the urge of a rapid transition toward alternative energy sources that solar and wind alone can’t satisfy as our energy demands are rising very rapidly with AI. The investment world is turning toward the nuclear option: VanEck’s Uranium and Nuclear ETF is up by 73% since the war in Ukraine started and up by 62% since the beginning of 2023, when ChatGPT joined our lives. And the nuclear outlook is increasingly positive.
In the FX
The US dollar index consolidated gains yesterday near the 100-DMA and half-way on the summer selloff. The EURUSD extended losses below the 1.09 mark and the euro bears are eyeing a further retreat toward and below the 200-DMA, near 1.0875. The European Central Bank (ECB) meets tomorrow and is expected to announce another 25bp cut. The headline inflation in the Eurozone lately dipped below the 2% policy target and European economies are struggling with Germany thought to be in mild recession. The only thing that could hold the ECB back from a dovish cut would be sticky core and services inflation. If that’s the case, the ECB could deliver a hawkish cut. In that case, we could see a rebound in the EURUSD but given the deteriorating fundamentals of the Eurozone and the resilience of the US economy, the single currency could and should lose more ground against the greenback.
And speaking of inflation and Europe, inflation in Britain not only fell below 2% in September but came in significantly lower than expected (1.7%y-o-y vs 1.9% expected). Although core inflation remains sticky near 3.2%, that number also surprised to the downside. British inflation’s downward trajectory, combined with slowing wages growth, emphasizes Bank of England (BoE) Governor Andrew Bailey’s latest comments that the bank will get ‘more aggressive’ on its rate policy. That meaningful dovish shift in BoE stance, backed by inflation data, will likely send Cable back below the 1.30 level.
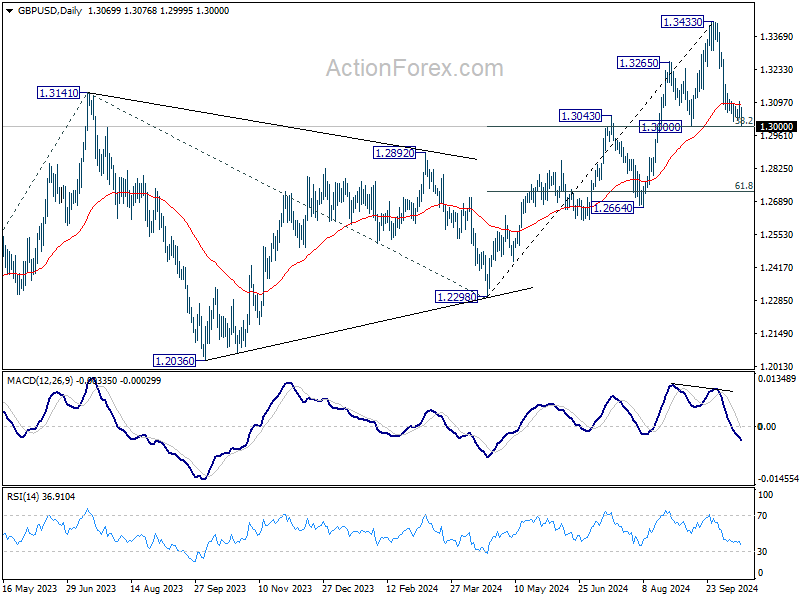
GBP/USD Daily Outlook
Daily Pivots: (S1) 1.3039; (P) 1.3071; (R1) 1.3106; More...
Immediate focus is now on 1.3000 cluster support (38.2% retracement of 1.2298 to 1.3433 at 1.2999) in GBP/USD as fall from 1.3433 short term top extends. Decisive break there will argue that whole rise from 1.2298 has complete,d and bring deeper fall to 61.8% retracement at 1.2732. On the upside, above 1.3102 minor resistance will turn bias back to the upside for rebound.
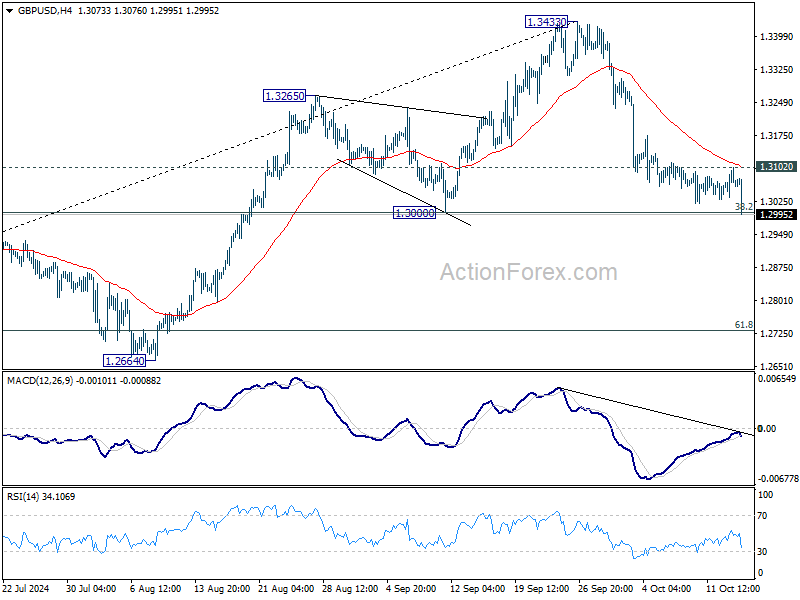
In the bigger picture, as long as 1.3000 support holds, the up trend from 1.0351 (2022 low) is still in progress. Next target is 61.8% projection of 1.0351 to 1.3141 from 1.2298 at 1.4022. However, considering mild bearish divergence condition in D MACD, decisive break of 1.3000 will argue that a medium term top is already in place, and bring deeper fall back to 1.2664 support next.
Sterling Drops as UK Inflation Falls More Than Expected, BoE Rate Cut Likely in Nov
Sterling has taken a significant hit after UK inflation data for September showed sharper-than-expected decline, falling below BoE's 2% target again, and hit the lowest level in over three years. Core CPI also fell more than forecasted, indicating a stronger pace of disinflation. Services prices, a key inflation driver, showed a marked slowdown, reinforcing the view that inflationary pressures in the UK are easing at a quicker pace than anticipated.
This latest data bolsters the case for BoE to resume monetary easing, with market expectations now favoring a 25bps rate cut at the next meeting on November 8. The clear signs of weakening inflation give BoE room to act more decisively in its removing monetary restrictions to support growth.
Meanwhile, the New Zealand Dollar also faced downward pressure following data that confirmed a sharp decline in inflation during Q3, reaching its lowest level since early 2021. This data supports RBNZ's earlier 50bps rate cut, and reinforces expectations that another large cut could follow on November 27. RBNZ’s aggressive stance is likely to continue as inflation in New Zealand continues to cool more quickly than it expected.
In the broader currency market, Australian Dollar is currently the weakest performer, struggling under the weight of uncertainties surrounding China's fiscal stimulus. New Zealand Dollar follows close behind, while Swiss Franc is under pressure as well. On the other side, Dollar is strengthening, supported by comments from Fed officials that they foresee two, or even just one, more rate cuts this year. Canadian Dollar and Japanese Yen are also holding slightly stronger positions,. Euro and Sterling are in the middle of the pack. However, Sterling could see further declines if market sentiment continues to sour.
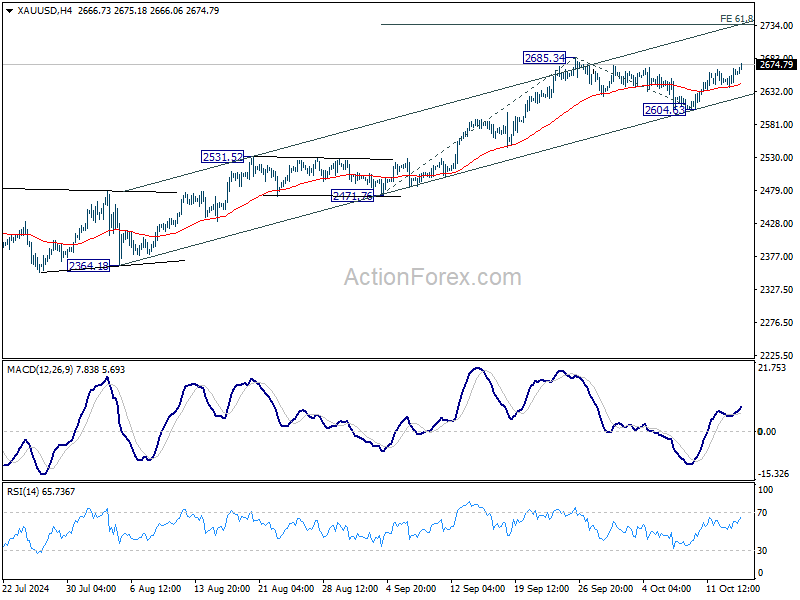
Technically, Gold's extended bounce from 2604.63 suggests that correction from 2685.32 has completed after drawing support from the near term rising channel. Firm break of 2685.34 would target 61.8% projection of 2471.76 to 2685.34 from 2604.63 at 2736.32. However, this time, Gold’s rally might occur in tandem with Euro weakness, rather than a decline in the US Dollar.
In Asia, Nikkei fell -1.83%. Hong Kong HSI is flat. China Shanghai SSE is down -0.24%. Singapore Strait Times is up 0.33%. Japan 10-year JGB yield fell -0.0151 to 0.961. Overnight, DOW fell -0.75%. S&P 500 fell -0.76%. NASDAQ fell -1.01%. 10-year yield fell -0.060 to 4.038.
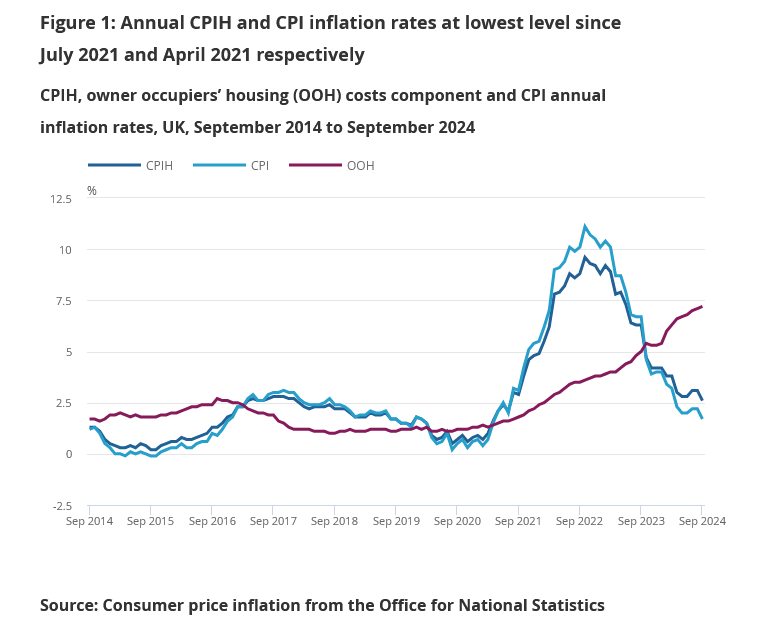
UK CPI falls to 1.7% in Sep, core CPI down to 3.2%
UK CPI slowed more than expected from 2.2% yoy to 1.7% yoy in September, below expectation of 1.9% yoy.Core CPI (excluding energy, food, alcohol and tobacco) slowed from 3.6% yoy to 3.2% yoy, below expectation of 3.4% yoy. CPI goods fell from -0.9% yoy to -1.4% yoy. CPI services also slowed from 5.6% yoy to 4.9% yoy.
ONS Chief Economist Grant Fitzner said: “Inflation eased in September to its lowest annual rate in over three years. Lower airfares and petrol prices were the biggest driver for this month’s fall. These were partially offset by increases for food and non-alcoholic drinks, the first time that food price inflation has strengthened since early last year. “Meanwhile the cost of raw materials for businesses fell again, driven by lower crude oil prices.”
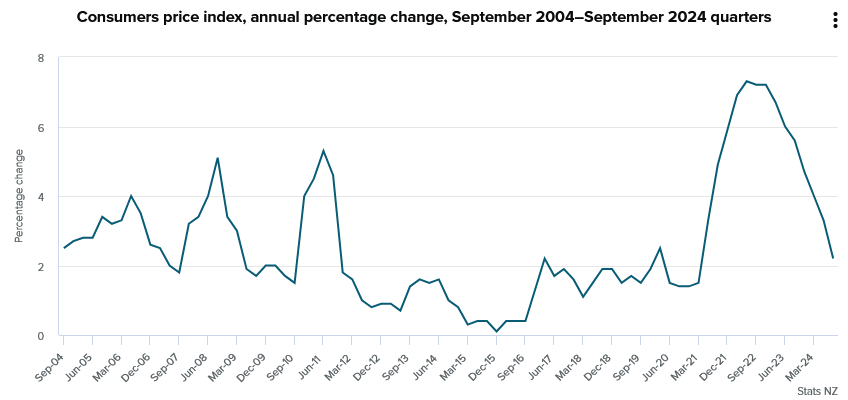
NZ CPI falls to 2.2% in Q3, back in RBNZ's target band
New Zealand's CPI rose 0.6% qoq in Q3, slightly below market expectations of 0.7% qoq. Annually, inflation slowed sharply from 3.3% yoy to 2.2% yoy, in line with forecasts.
This marks the first time since March 2021 that annual inflation has returned within RBNZ’s target range of 1 to 3%. The result was also softer than RBNZ’s own forecast of 0.8% quarterly and 2.3% annual inflation.
Rent prices were the largest contributor to the annual inflation figure, rising by 4.5%. Nearly 20% of the overall inflation increase came from rent.
On the other hand, lower fuel costs, with petrol prices dropping -8.0%, helped balance rising costs, alongside a notable -17.9% drop in vegetable prices following last year’s spike in potato, kūmara, and onion prices.
RBA’s Hunter: Monitoring China’s stimulus and inflation expectations closely
RBA Assistant Governor Sarah Hunter emphasized today the importance of China’s economic stimulus measures for Australia, noting that the central bank is actively assessing their local implications.
In a Bloomberg interview, Hunter explained, “We are factoring it into our forecasts going into November," as China remains a key player in Australia’s economy. "China’s still very important, and we put a lot of our time and attention into thinking through what’s happening there and what it means for the economy here."
In a separate speech, Hunter also addressed the importance of keeping inflation expectations anchored within RBA’s 2-3% target range.
She noted that “the fact that expectations feed into actual inflation outcomes means de-anchored expectations typically lead to greater inflation volatility.”
RBA remains vigilant to ensure inflation expectations remain steady, as de-anchoring could cause significant economic disruption. Hunter stressed the need to constantly track and understand how inflation expectations are evolving to mitigate any risks to the broader economy.
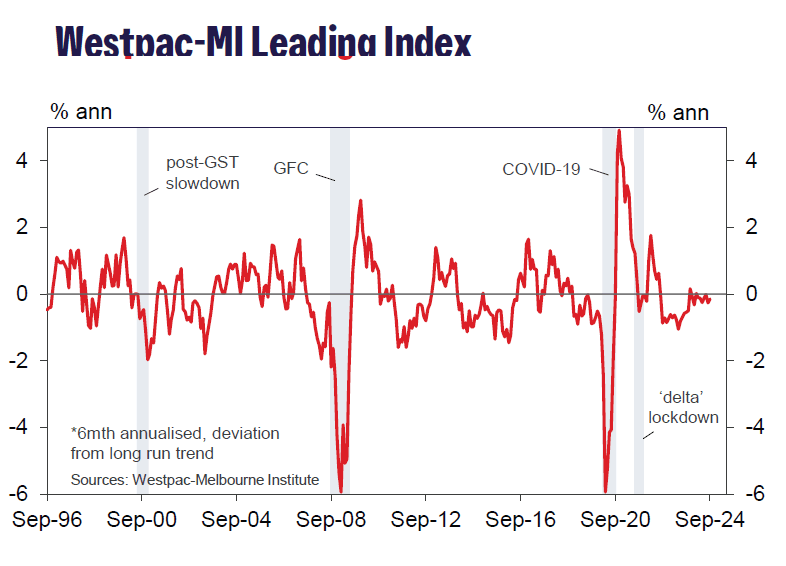
Australia’s Westpac leading index ticks up to -0.15%, growth outlook remains subdued
Australia’s Westpac Leading Index showed a slight improvement, rising from -0.26% to -0.15% in September. However, the index remains in negative territory, indicating "below-trend momentum" that is expected to carry into 2025.
Westpac maintains that while growth will improve next year, it will remain "relatively subdued," with GDP growth forecasted to gradually rise from annualized 1% currently to 1.5% by the end of 2024, reaching 2.4% by the end of 2025—still below the long-term trend of slightly above 2.5%.
As for monetary policy, RBA is not expected to change its cash rate target at the upcoming meetings in November and December.
However, Westpac anticipates a shift in RBA's messages, moving away from its 2024 focus on "inflation vigilance."
Key data releases, including Q3 CPI on October 30 and national accounts on December 4, are likely to confirm a subdued growth environment and provide RBA with enough confidence to start considering less restrictive policies in 2025.
BoJ's Adachi warns against premature rate hikes, urges most conservative approach
In a speech today, BoJ Board Member Seiji Adachi suggested that Japan's economy has met the conditions for beginning to normalize its ultra-loose monetary policy. He pointed to the firm economic outlook and broadening price increases as positive signs.
However, Adachi emphasized the need for caution, stating that until underlying inflation sustainably reaches the 2% target, Japan must maintain an "accommodative" financial environment. He added that any interest rate increases should be at a "very moderate pace."
Adachi also stressed the importance to "avoid raising rates prematurely", suggesting that BoJ should use the "most conservative estimate" when considering policy adjustments.
"Given high uncertainty surrounding global developments, there is significant uncertainty over next year's wage developments in Japan. We must carefully monitor the situation," Adachi added.
Fed's Daly: One or two more rate cuts reasonable this year
San Francisco Fed President Mary Daly signaled in a speech overnight that additional rate cuts are in the pipeline for this year, suggesting that "one or two" further reductions would be a "reasonable thing to do."
Daly emphasized that the primary focus now is on determining "how quickly to adjust," rather than where the ultimate destination of the easing cycle will be.
She also acknowledged that “the economy is clearly in a better place,” pointing to significant progress in reducing inflation pressures. She also highlighted that the labor market is now on a more sustainable path, which was a key concern earlier this year. With both inflation and employment showing healthier trends, Daly noted, “the risks to our goals are now balanced.”
Fed's Bostic sees one more 25bps rate cut in 2024
In a moderated discussion, Atlanta Fed President Raphael Bostic addressed the key question on investors' minds: "how fast" will the Fed proceed with further rate cuts?
According to Bostic, Fed's median projection suggests an additional 50bps of rate cuts this year, following 50bps cut in September. However, for Bostic, "My dot was 25 basis points more".
Nevertheless, he emphasized that his stance is not set in stone. "I'm keeping my options open," Bostic said, indicating that he would reassess based on incoming data on inflation and the labor market.
He also projected GDP growth of around 2.6% for 2024 and expects it to moderate to 2% in 2025 as household savings dwindle.
Looking ahead
Canada will release housing starts and manufacturing sales. US will release import price index.
GBP/USD Daily Outlook
Daily Pivots: (S1) 1.3039; (P) 1.3071; (R1) 1.3106; More...
Immediate focus is now on 1.3000 cluster support (38.2% retracement of 1.2298 to 1.3433 at 1.2999) in GBP/USD as fall from 1.3433 short term top extends. Decisive break there will argue that whole rise from 1.2298 has complete,d and bring deeper fall to 61.8% retracement at 1.2732. On the upside, above 1.3102 minor resistance will turn bias back to the upside for rebound.
In the bigger picture, as long as 1.3000 support holds, the up trend from 1.0351 (2022 low) is still in progress. Next target is 61.8% projection of 1.0351 to 1.3141 from 1.2298 at 1.4022. However, considering mild bearish divergence condition in D MACD, decisive break of 1.3000 will argue that a medium term top is already in place, and bring deeper fall back to 1.2664 support next.
UK CPI falls to 1.7% in Sep, core CPI down to 3.2%
UK CPI slowed more than expected from 2.2% yoy to 1.7% yoy in September, below expectation of 1.9% yoy.
Core CPI (excluding energy, food, alcohol and tobacco) slowed from 3.6% yoy to 3.2% yoy, below expectation of 3.4% yoy.
CPI goods fell from -0.9% yoy to -1.4% yoy. CPI services also slowed from 5.6% yoy to 4.9% yoy.
ONS Chief Economist Grant Fitzner says:
“Inflation eased in September to its lowest annual rate in over three years. Lower airfares and petrol prices were the biggest driver for this month’s fall.
“These were partially offset by increases for food and non-alcoholic drinks, the first time that food price inflation has strengthened since early last year.
“Meanwhile the cost of raw materials for businesses fell again, driven by lower crude oil prices.”
BoJ’s Adachi warns against premature rate hikes, urges most conservative approach
In a speech today, BoJ Board Member Seiji Adachi suggested that Japan's economy has met the conditions for beginning to normalize its ultra-loose monetary policy. He pointed to the firm economic outlook and broadening price increases as positive signs.
However, Adachi emphasized the need for caution, stating that until underlying inflation sustainably reaches the 2% target, Japan must maintain an "accommodative" financial environment. He added that any interest rate increases should be at a "very moderate pace."
Adachi also stressed the importance to "avoid raising rates prematurely", suggesting that BoJ should use the "most conservative estimate" when considering policy adjustments.
"Given high uncertainty surrounding global developments, there is significant uncertainty over next year's wage developments in Japan. We must carefully monitor the situation," Adachi added.
NZ CPI falls to 2.2% in Q3, back in RBNZ’s target band
New Zealand's CPI rose 0.6% qoq in Q3, slightly below market expectations of 0.7% qoq. Annually, inflation slowed sharply from 3.3% yoy to 2.2% yoy, in line with forecasts.
This marks the first time since March 2021 that annual inflation has returned within RBNZ’s target range of 1 to 3%. The result was also softer than RBNZ’s own forecast of 0.8% quarterly and 2.3% annual inflation.
Rent prices were the largest contributor to the annual inflation figure, rising by 4.5%. Nearly 20% of the overall inflation increase came from rent.
On the other hand, lower fuel costs, with petrol prices dropping -8.0%, helped balance rising costs, alongside a notable -17.9% drop in vegetable prices following last year’s spike in potato, kūmara, and onion prices.
Australia’s Westpac leading index ticks up to -0.15%, growth outlook remains subdued
Australia’s Westpac Leading Index showed a slight improvement, rising from -0.26% to -0.15% in September. However, the index remains in negative territory, indicating "below-trend momentum" that is expected to carry into 2025.
Westpac maintains that while growth will improve next year, it will remain "relatively subdued," with GDP growth forecasted to gradually rise from annualized 1% currently to 1.5% by the end of 2024, reaching 2.4% by the end of 2025—still below the long-term trend of slightly above 2.5%.
As for monetary policy, RBA is not expected to change its cash rate target at the upcoming meetings in November and December.
However, Westpac anticipates a shift in RBA's messages, moving away from its 2024 focus on "inflation vigilance."
Key data releases, including Q3 CPI on October 30 and national accounts on December 4, are likely to confirm a subdued growth environment and provide RBA with enough confidence to start considering less restrictive policies in 2025.