Sample Category Title
Fall in Unemployment Supports Pound, But Concerns Grow
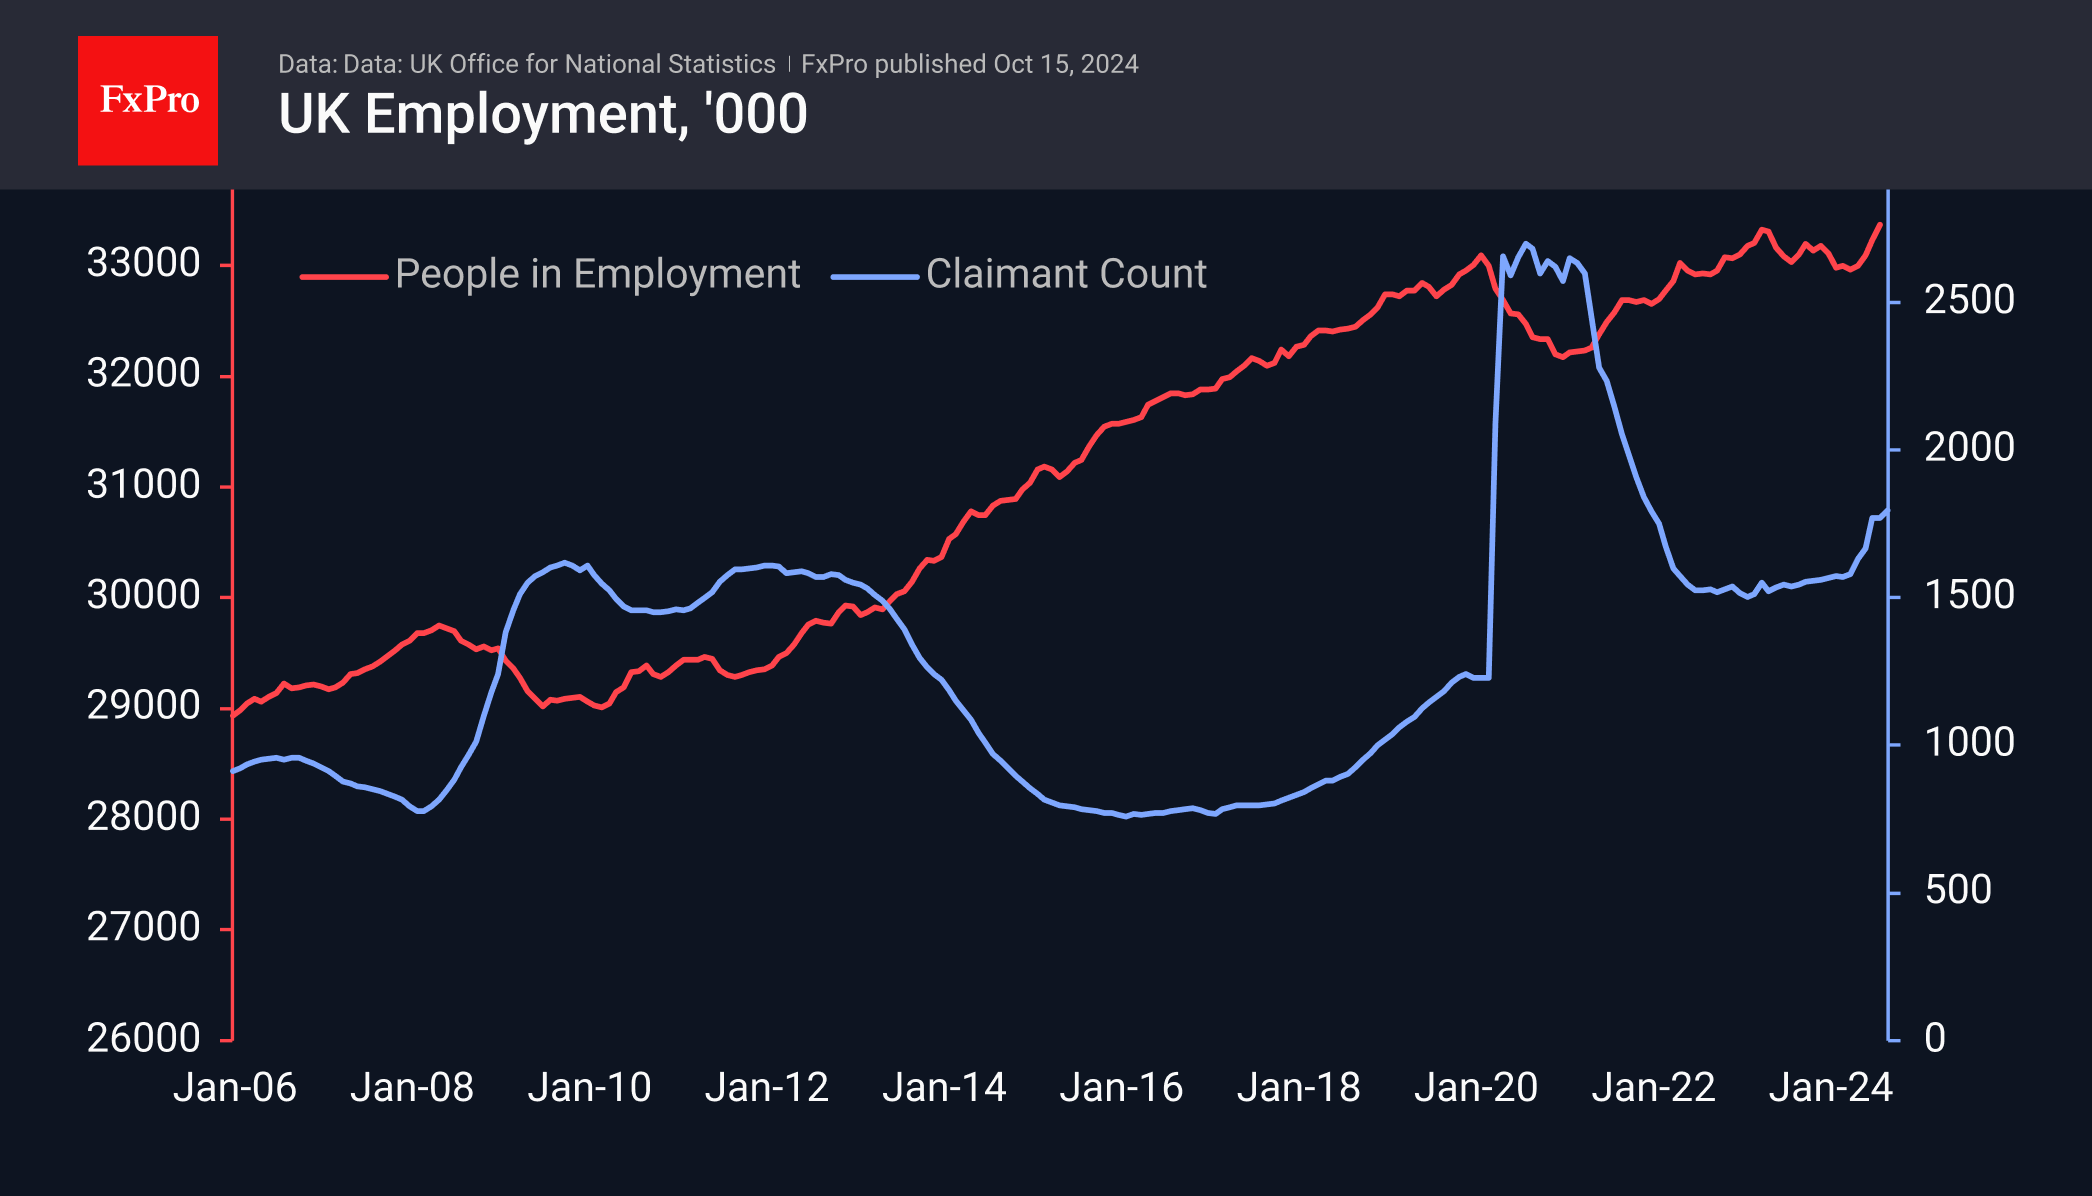
The UK unemployment rate fell to 4.0% in August, the lowest since January, and went down from a peak of 4.4% in April and May. The data beat expectations and supported Sterling buying from intraday lows below 1.3040. Employment figures have been gaining momentum in recent months, with 373K more jobs created in July and August than in the previous three months.
However, the situation is not so rosy when looking at the figures in a broader context. Firstly, the ONS publishes its preliminary estimates for September, which show a fall of 15k in the number of people in work. Second, the number of people claiming unemployment benefits rose by 27.9K in September, bringing the total over the past six months to almost 225K. Thirdly, job vacancies fell by 34K in the three months to September, confirming the cooling of the labour market.
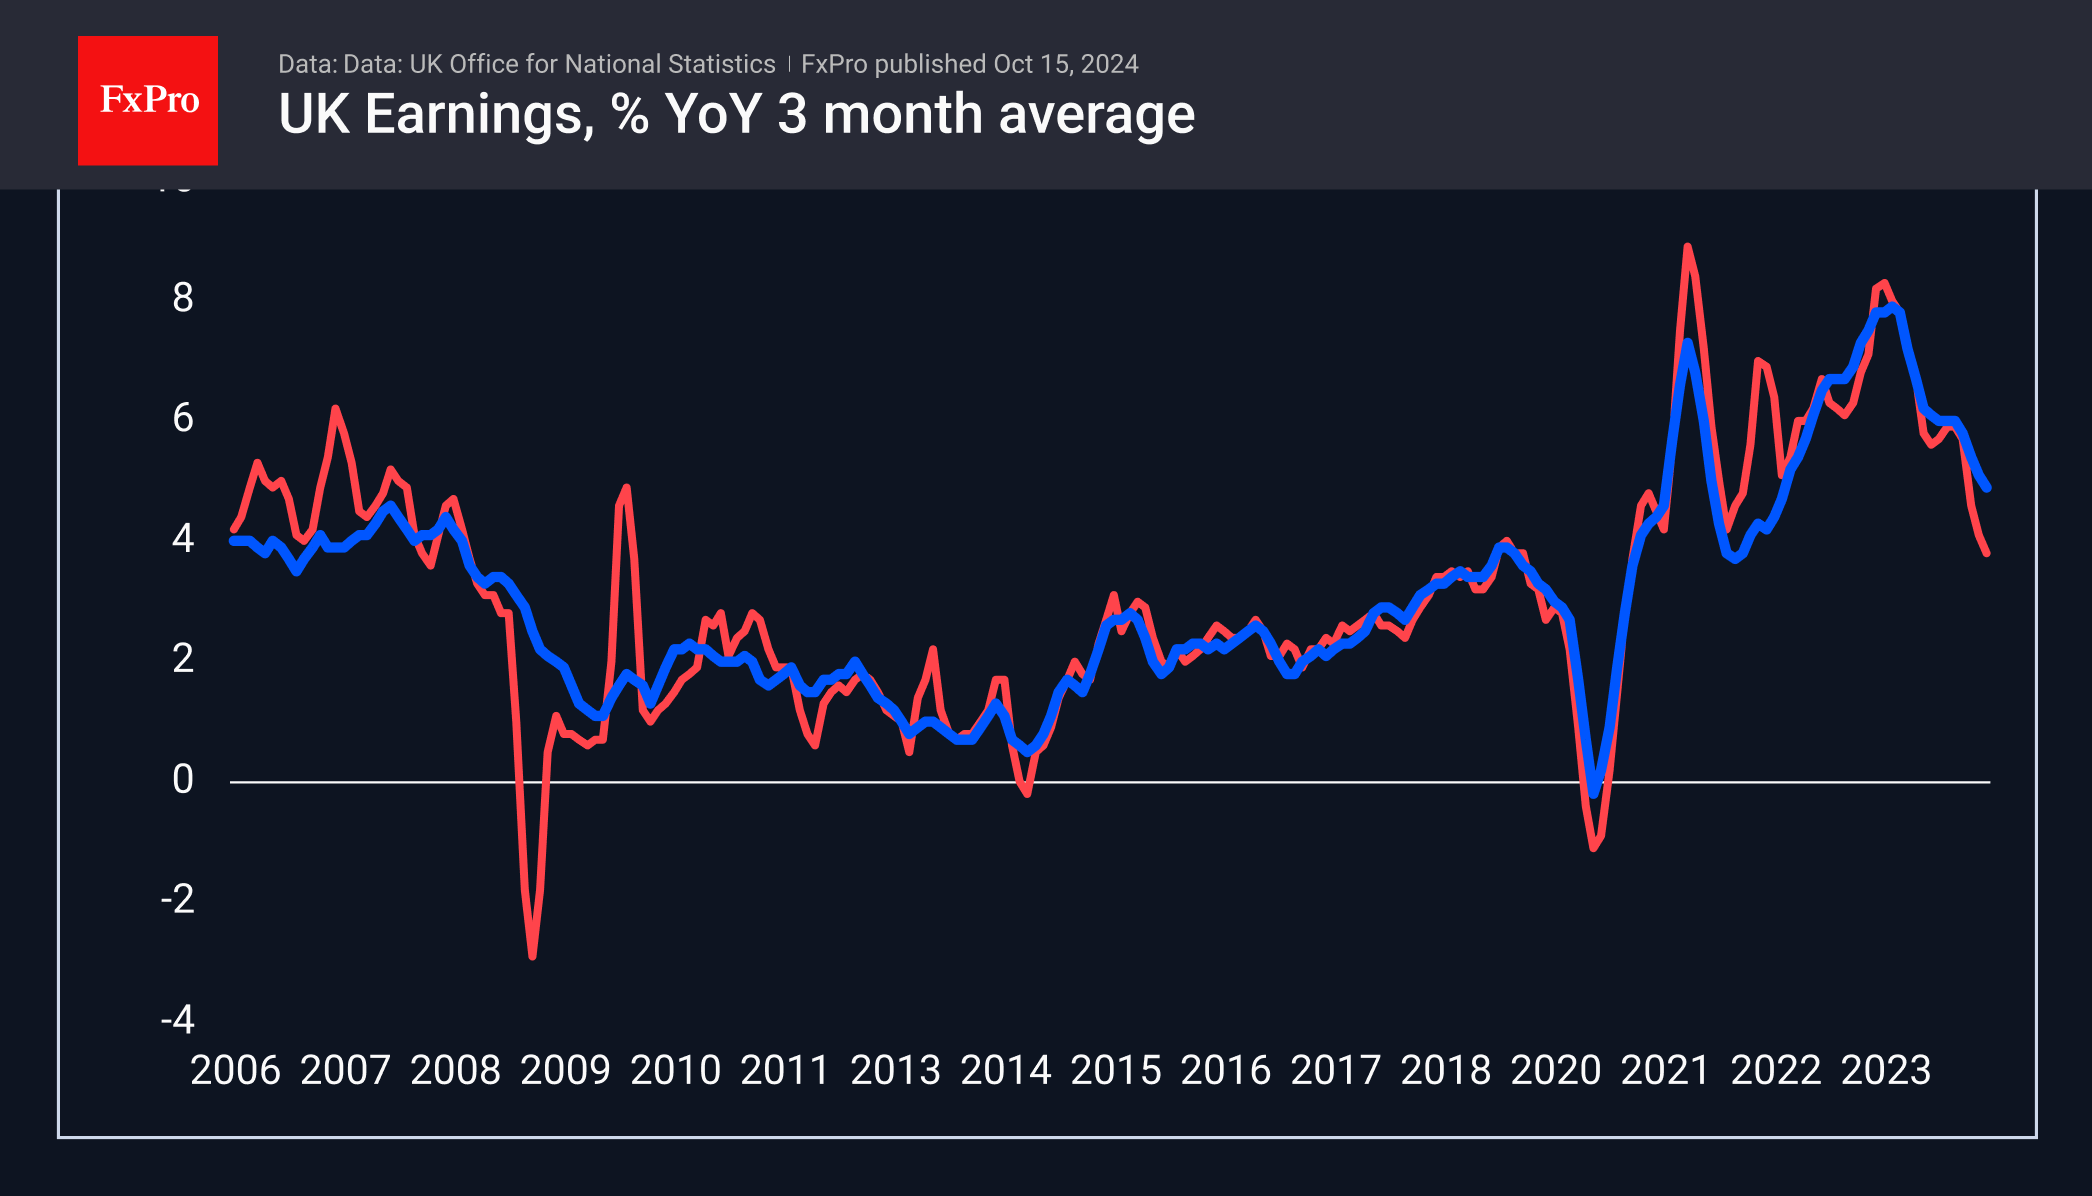
The continued slowdown in wage growth is also worrying. They were 3.8% higher in the three months to August than in the same period a year earlier. Excluding bonuses, the increase was 4.9%. This is above the 2.2% inflation rate but builds on a slowing trend that has been in place since the middle of last year.
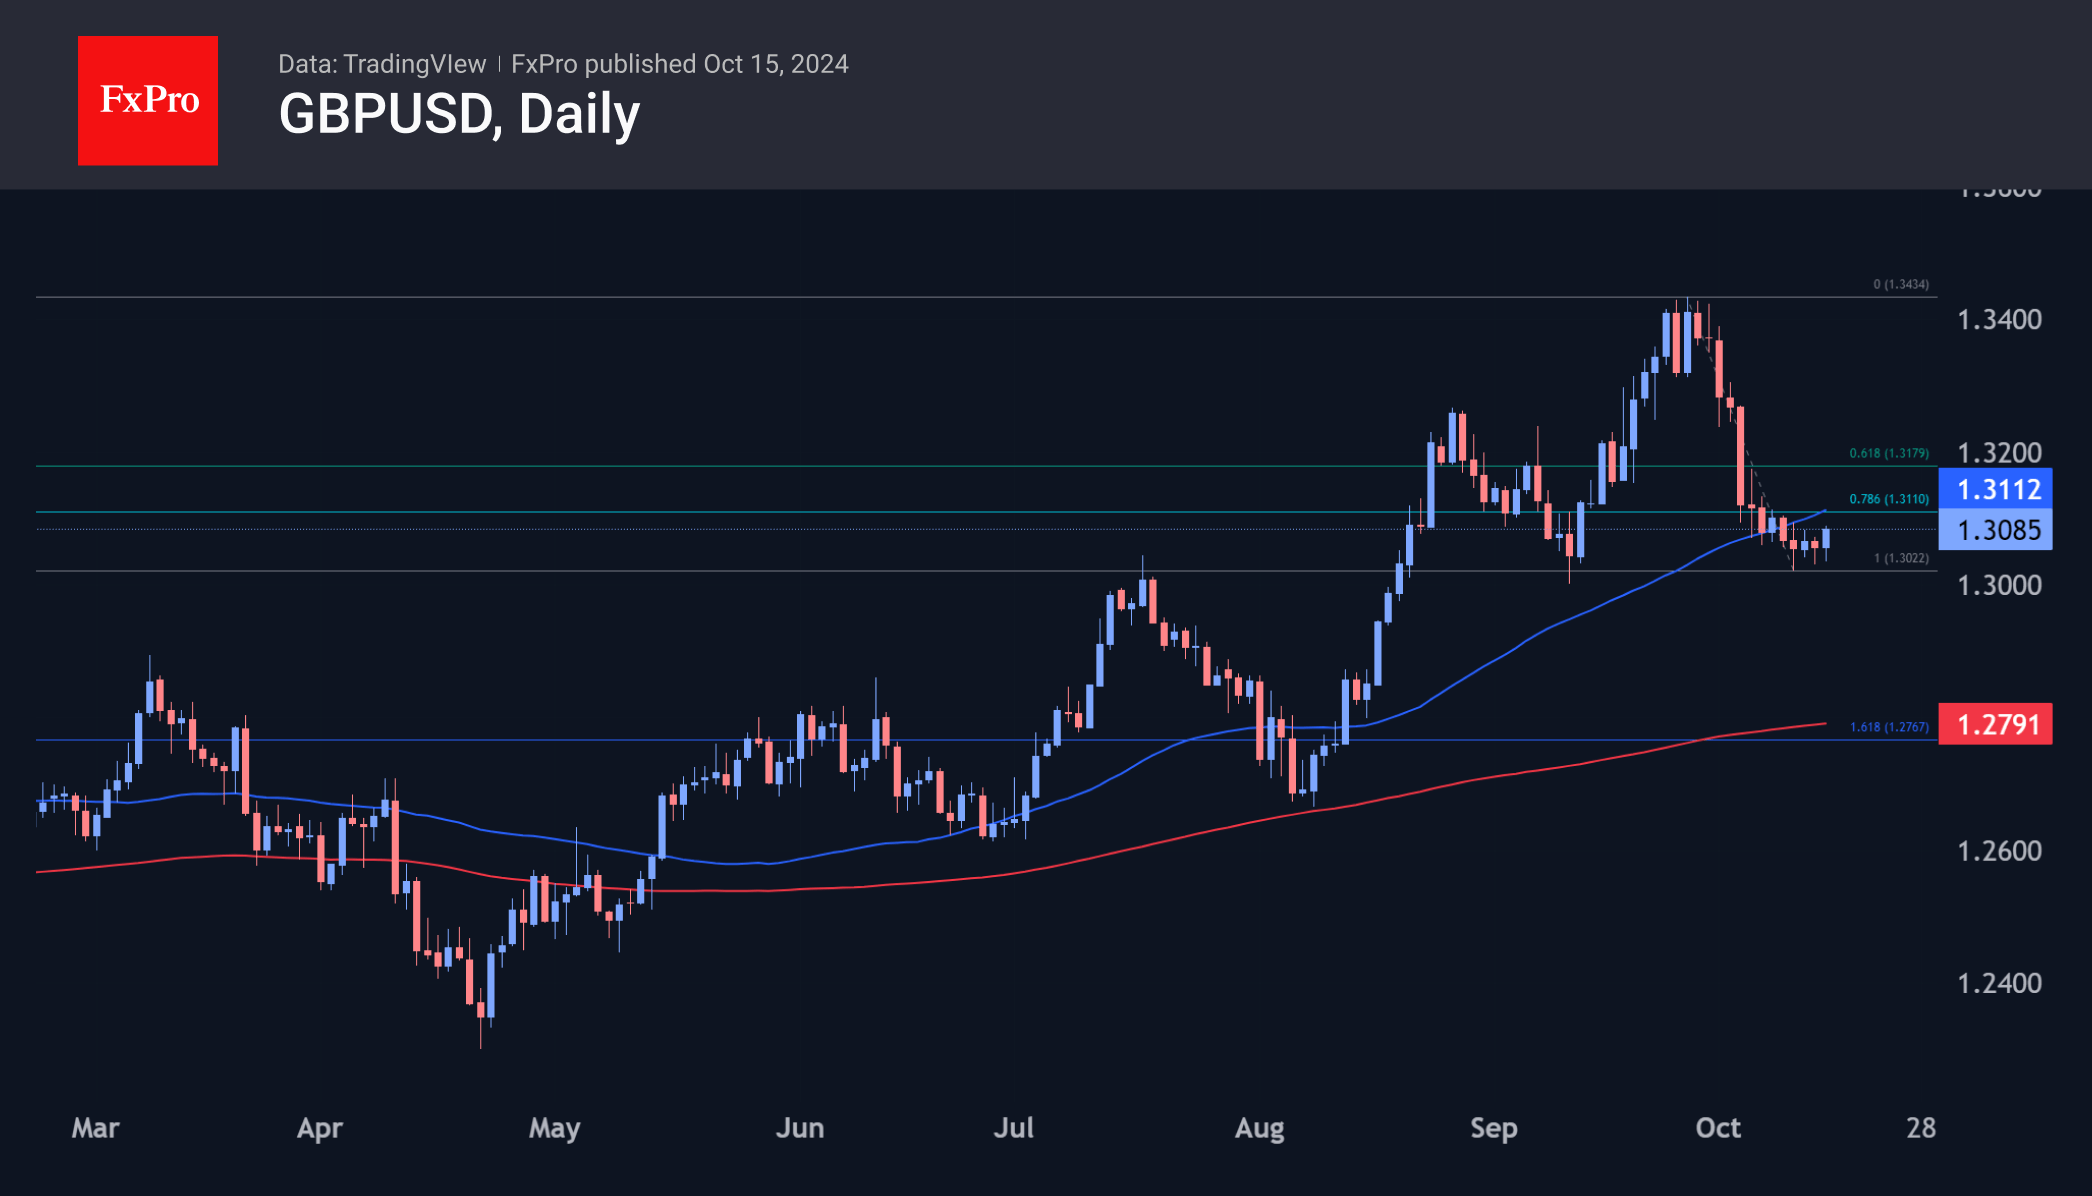
The markets seem to have used the new data to take profits from the previous decline in the GBPUSD. The pair has gained 0.2% since the start of the day and has climbed to the 1.3080 level, last Thursday’s high. Technically, there are no significant obstacles to the upside until the 1.3115 area, which is the 50-day moving average and the area of the previous consolidation in early October.
In a more bullish scenario for the Pound, a full-blown corrective bounce could develop into the 1.3120-1.3180 area, but further gains will require more than a portfolio shake-up—a more global shift in sentiment is needed.
.
Canadian Dollar Can’t Find Its Footing, Can. CPI Next
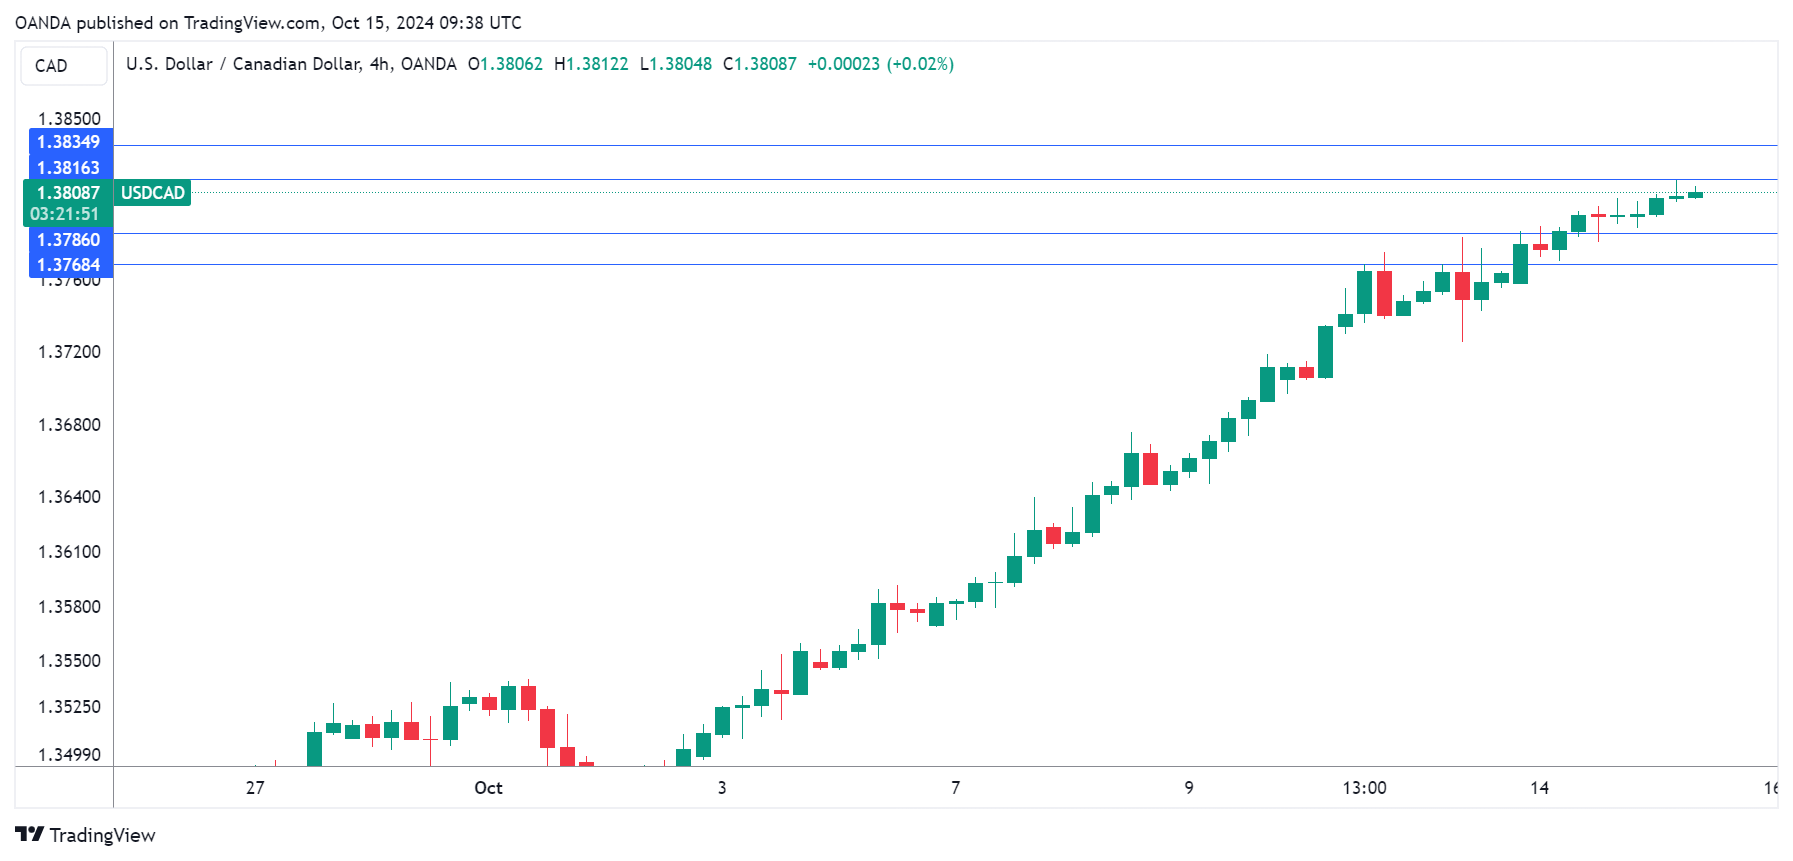
The Canadian dollar has declined against the US dollar for a tenth consecutive trading day and has fallen 2.1% in October. In Tuesday’s session, USD/CAD is trading at 1.3811 at the time of writing, up 0.11%.
Canada’s inflation rate expected to fall below 2%
Is the tough battle against inflation finally over? Inflation has been falling and the August CPI was a milestone as inflation dropped from 2.5% to 2%, the Bank of Canada’s target. This was the lowest level since February 2021.
The downward trend is expected to continue in September, with a market estimate of 1.8%. Two key core measures are expected to remain around 2.4%. Monthly, inflation is projected to ease to -0.1%, compared to 0.1% in August. Gasoline prices have been falling and are expected to push September CPI’s below 2%.
Today’s CPI release is the last key economic report before the Bank of Canada announces its next rate decision on October 23. With inflation under control, the BoC has shifted its primary focus away from inflation to the labor market. The BoC has been aggressive and has lowered rates three times this year, as inflation has fallen and the labour market has weakened.
However, the September employment report was stronger than expected, which supports the case for a modest 25-basis point cut rather than a jumbo 50-bps move in October. The BoC would prefer to trim rates gradually at a 25-bps clip, but if key economic data is softer than expected, the BoC could respond with a 50-bps cut.
USD/CAD Technical
- USD/CAD is putting pressure on resistance at 1.3816. Above, there is resistance at 1.3834
- 1.3786 and 1.3768 are the next support levels
WTI Outlook: Oil Prices Fall Further on Demand Concerns, But Geopolitics Remain Supportive
Oil price extends steep decline into the second consecutive day and hit two week low in early Tuesday, after the price fell nearly 4% on Monday.
Oil was deflated by weaker demand outlook and signals that Israel will not strike Iranian oil infrastructure.
OPEC cut its forecast for global oil demand in 2024, which increased pressure on oil prices, but negative impact is likely to be partially offset by heated geopolitical situation and permanent threats of further escalation.
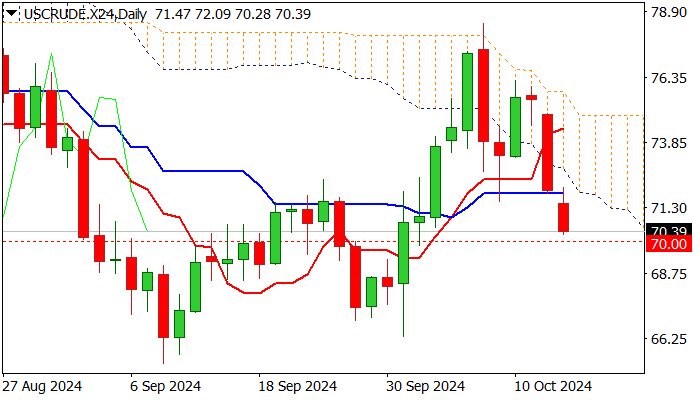
Oil price fell near psychological $70 support, where bears may face increased headwinds, as 14-d momentum is attempting to reverse north just above the centreline and stochastic is about to probe into negative territory.
Pause at $70 level looks like possible scenario, although near-term bears will remain in play while potential upticks hold below (daily cloud base / Kijun-sen ($71.89) and offer better selling opportunities.
On the other hand, firm break through $70 pivot would signal bearish continuation and expose targets at $66.33 (Oct 1 low) and $65.26 (2024 low posted on Sep 9).
Res: 70.74; 71.89; 72.69; 73.70.
Sup: 70.00; 69.30; 68.37; 66.33.
Natural Gas Price Drops Over 8% Since the Start of the Month
On 26 September, when analysing the XNG/USD natural gas price chart, we noted that:
→ Bulls might be "gathering strength" for a potential attempt to break the psychological level of 3.00.
→ If successful, this would pave the way towards the yearly high around 3.20.
Since then, the price of natural gas:
→ Broke above the 3.00 level on 27 September;
→ Reached 3.20 on 4 October, after which it reversed downward.
Bearish sentiment was driven by:
→ News that Hurricane Helen had minimal impact on natural gas processing facilities along the U.S. Gulf Coast;
→ Adequate gas reserves ensuring sufficient supply;→ Weather forecasts indicating short-term gas demand at the end of September.
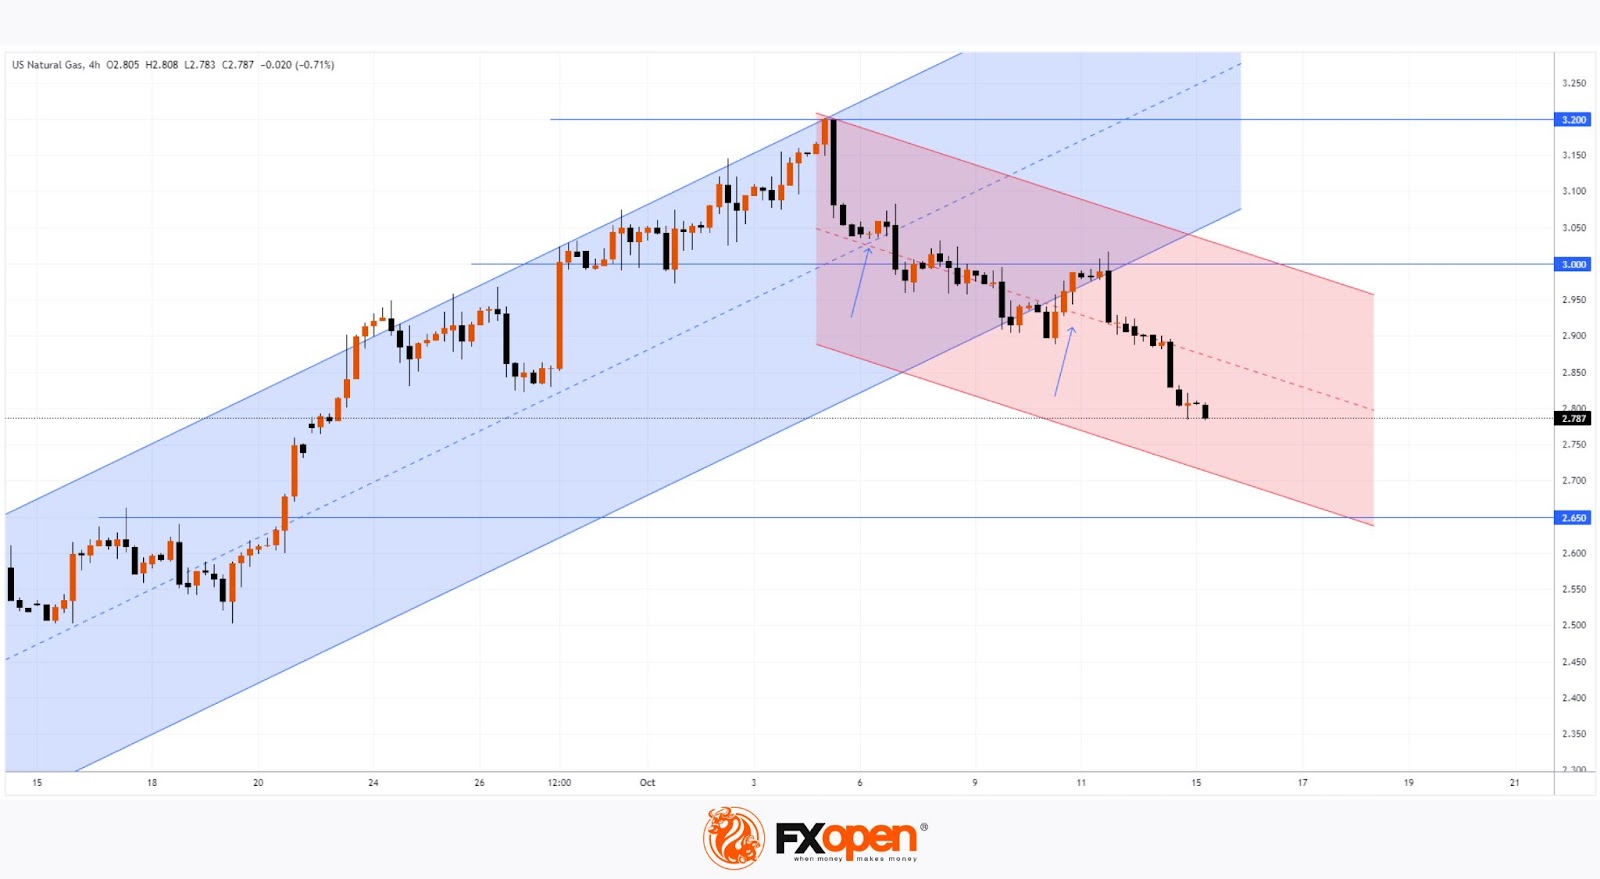
Technical analysis of the XNG/USD chart shows the upward channel (marked in blue) has lost relevance. It’s evident that:
→ The bounce from the median line (shown by the first arrow) was weak;
→ The attempt to re-enter the channel from its lower boundary (as shown by the second arrow) led to a test of the 3.00 psychological level, which acted as resistance.
There are no signs yet of bulls trying to regain control on the XNG/USD chart. If the supply and demand balance remains unchanged, the natural gas price may continue its decline within the red downward channel, possibly towards its lower boundary, reinforced by the former resistance at 2.65.
Start trading commodity CFDs with tight spreads. Open your trading account now or learn more about trading commodity CFDs with FXOpen.
This article represents the opinion of the Companies operating under the FXOpen brand only. It is not to be construed as an offer, solicitation, or recommendation with respect to products and services provided by the Companies operating under the FXOpen brand, nor is it to be considered financial advice.
Germany’s ZEW jumps to 13.1 in Oct, driven by optimism on inflation and ECB rate cuts
Germany's ZEW Economic Sentiment index surged significantly to from 3.6 to 13.1 in October, surpassing market expectations of 10.2. However, Current Situation Index dropped further into negative territory, falling from -84.5 to -86.9, slightly worse than forecast of -85.0.
For the Eurozone, ZEW Economic Sentiment rose from 9.3 to 20.1, beating expectations of 16.9. Current Situation Index, however, saw a small decline, edging lower by -0.4 points to -40.8.
ZEW President Achim Wambach highlighted the mixed signals, noting that despite a very weak current economic situation in Germany, optimism is growing. He cited "stable inflation" expectations and the prospect of "further interest rate cuts" by ECB as key contributors to this improved outlook.
Wambach added that positive signals from key export markets such as the US, China, and the Eurozone also played a role in improving the outlook for Germany’s economy. China's recent economic stimulus measures have contributed to this optimism too, boosting expectations for Germany's exports.
Eurozone industrial production rises 1.8% mom in Aug, driven by capital goods
Eurozone industrial production increased by 1.8% mom in August, meeting market expectations. This growth was supported primarily by a significant 3.7% rise in capital goods production. Durable consumer goods also saw a notable rise of 1.7%, while energy production edged up by 0.4%. However, intermediate goods saw a contraction of -0.3%, and non-durable consumer goods posted a modest gain of 0.2%.
Across the broader European Union, industrial production rose by 1.3% mom. Ireland led the gains with a robust 4.5% rise, followed by Germany and Lithuania, which both saw increases of 3.3%. Malta also posted solid growth of 2.7%. On the downside, Luxembourg experienced a sharp decline of -9.2%, while Croatia and Denmark saw drops of -4.6% and -4.5%, respectively.
EUR/USD: Increased Downside Pressure Below Daily Cloud
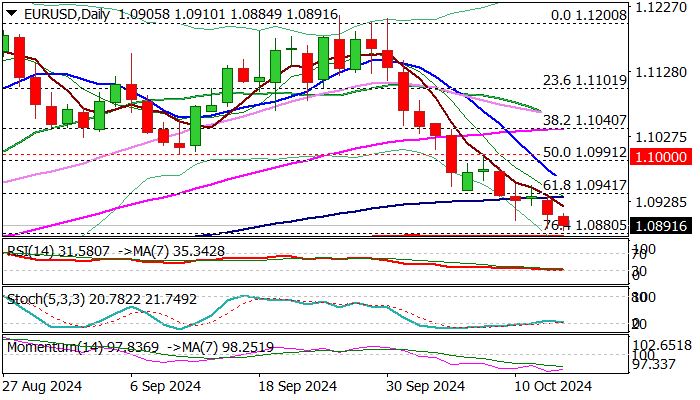
EURUSD dipped to new two month low early Tuesday, remaining under pressure from risk aversion on China’s latest stimulus news and wide expectations of ECB rate cut by 25 basis points on Thursday.
After registering a daily close below 1.0944/35 (Fibo 61.8% of 1.0775/1.1214 / daily cloud base / 100DMA) bears now pressure pivots at 1.0880/73 (Fibo 76.4% / 200DMA).
Technical picture on daily chart remains weak as negative momentum is strong and MA’s created a number of bear crosses however, stretched momentum studies and stochastic entering oversold territory, may slow the pace of current price action and make attempts through 200DMA more difficult.
Bears are expected to remain in play while holding below daily cloud base / 100DMA, with firm break of 1.0880/73 to open way towards early Aug higher base at 1.0781.
Economic data released today showed that inflation in Spain and France remains in a downward trajectory, while focus shifts on German / EU ZEW economic sentiment, with quite optimistic forecasts for October (German ZEW Oct 10.2 f/c vs Sep 3.6 / EU Oct 16.9 f/c vs Sep 9.3) which may ease bearish pressure on the single currency, if data come at or above expectations.
Res: 1.0910; 1.0944; 1.0980; 1.1000.
Sup: 1.0873; 1.0781; 1.0710; 1.0666.
GBPUSD Holds Near September’s Support Zone After Mixed Jobs Data
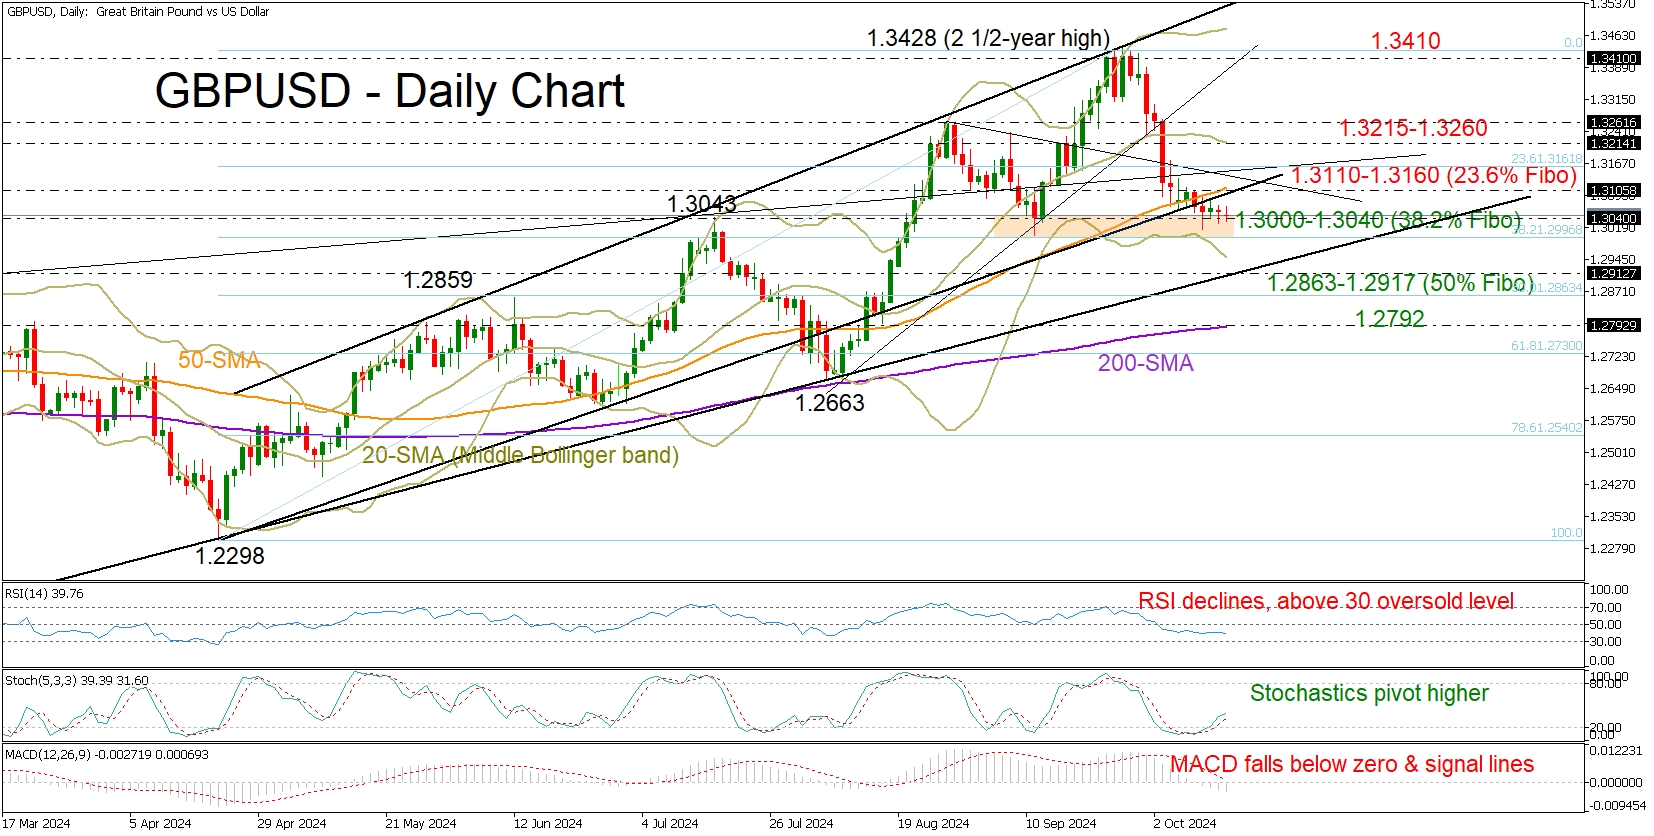
- GBPUSD stays directionless near September’s base
- Technical signals cannot warrant an upside reversal
GBPUSD faced mild selling pressure but held its footing above September’s floor of 1.3000-1.3040 after the UK employment survey showed better-than-expected jobs data in August and an increase in the number of unemployed people in September.
The bears may have luck on their side as the technical indicators are not confirming oversold conditions yet. While the stochastic oscillator has dropped below 20, the RSI is still above its 30 oversold level. Likewise, the price itself has not touched the lower Bollinger band.
In the case the pair signals a bearish trend reversal below 1.3000-1.3040, it may seek shelter near the critical 2022 support trendline at 1.2917. Slightly lower, the 50% Fibonacci retracement of the April-September upleg at 1.2863 might encounter downside pressures too. If not, the decline may gain new legs towards the 200-day simple moving average (SMA), which successfully boosted the price back above the 1.3000 level in August.
The path could be rough if there’s an upside reversal. The bulls could initially experience congestion within the 1.3110-1.3160 zone. Then, the recovery could stall somewhere between 1.3215 and 1.3260. Breaking this range might be necessary for an advance back to the September ceiling of 1.3410.
Summing up, GBPUSD has not overcome downside risks despite approaching an important protective area. A step below 1.3000 could renew selling interest, whilst a bounce above 1.3260 could shift the bias back to positive.
EURJPY Posts Strong Fight With 163.45-164.00 Barrier
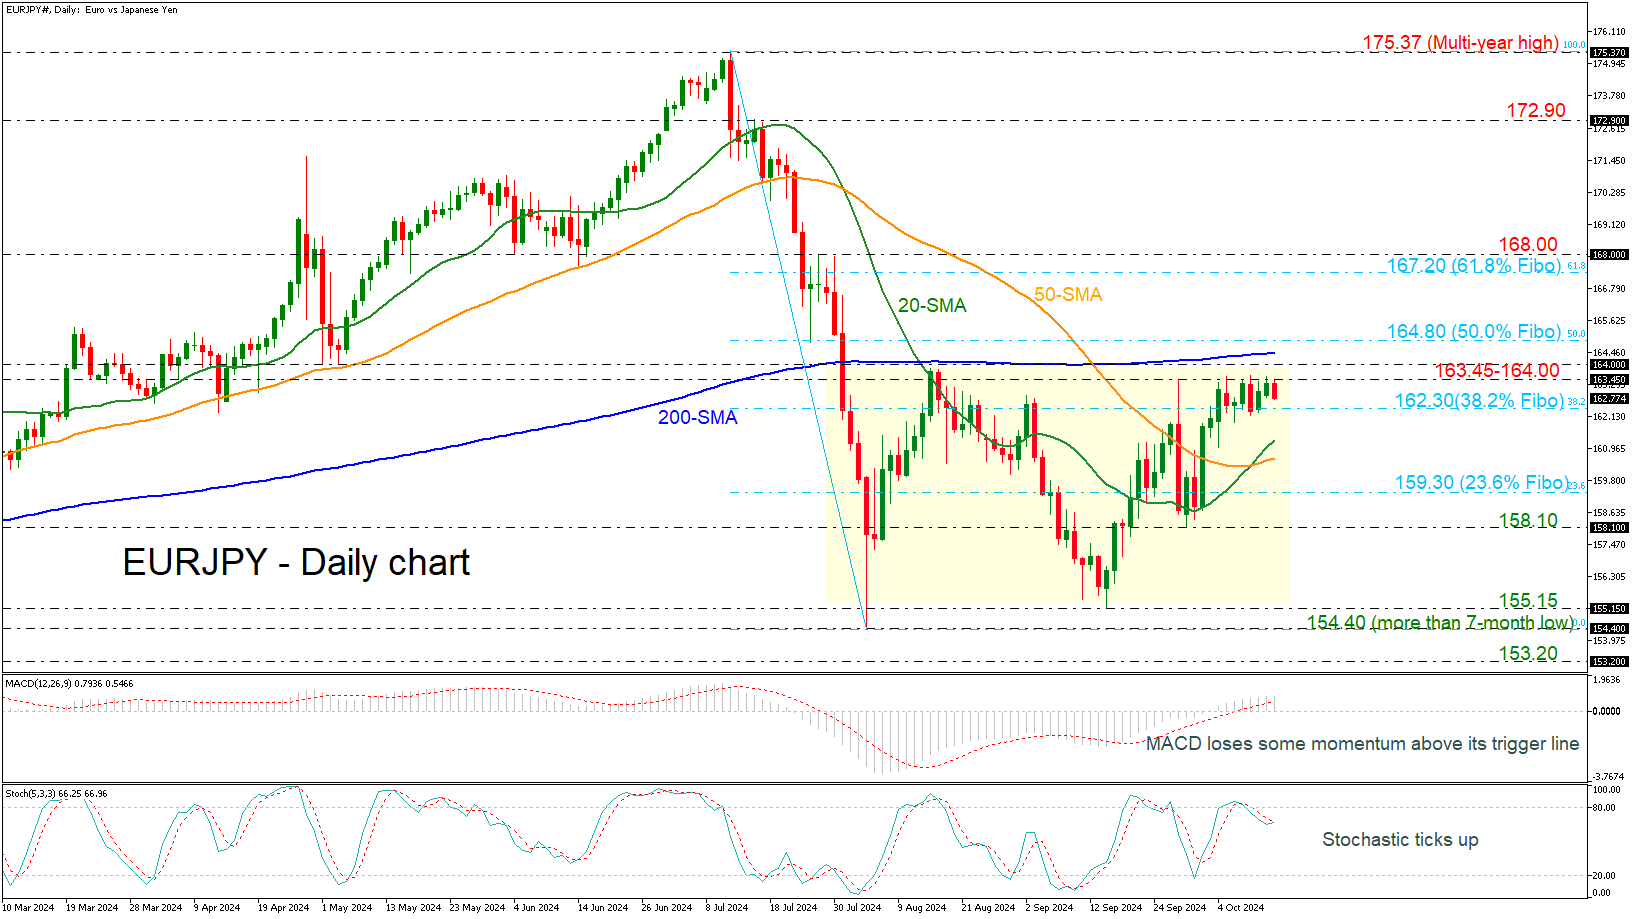
- EURJPY looks neutral in short-term view
- 200-day SMA seems to be another real struggle for bulls
- MACD and stochastics weaken their momentum
EURJPPY has been stuck within a tight range of 162.30 and 163.45, remaining in a broader sideways channel of 155.15-164.00. The pair has been consolidating over the last seven days and needs a further boost for a successful rally above the range, as well as the significant 200-day simple moving average (SMA) at 164.40.
According to the technical oscillators, the MACD is losing some momentum above its trigger and zero lines, while the stochastic turned slightly higher after the drop from the overbought territory.
If the pair manages to climb beyond the restrictive resistance region of 163.45-164.00, then the strong battle would come from the 200-day SMA at 164.40 and the 50.0% Fibonacci retracement level of the down leg from 175.37 to 154.40 at 164.80. Rising further, the bulls could take the lead in the short term, meeting the 61.8% Fibonacci at 167.20.
On the other hand, a dive beneath the 38.2% Fibonacci of 162.30 could drive traders lower to the bullish crossover within the 20- and 50-day SMAs around 160.60. Switching the view back to neutral, the pair could test the next lines in the channel, such as 159.30 and 158.10.
All in all, EURJPY would have a clearer picture only if there is a break above 164.00 or below 155.15 in the short-term outlook.
GBP/JPY Daily Outlook
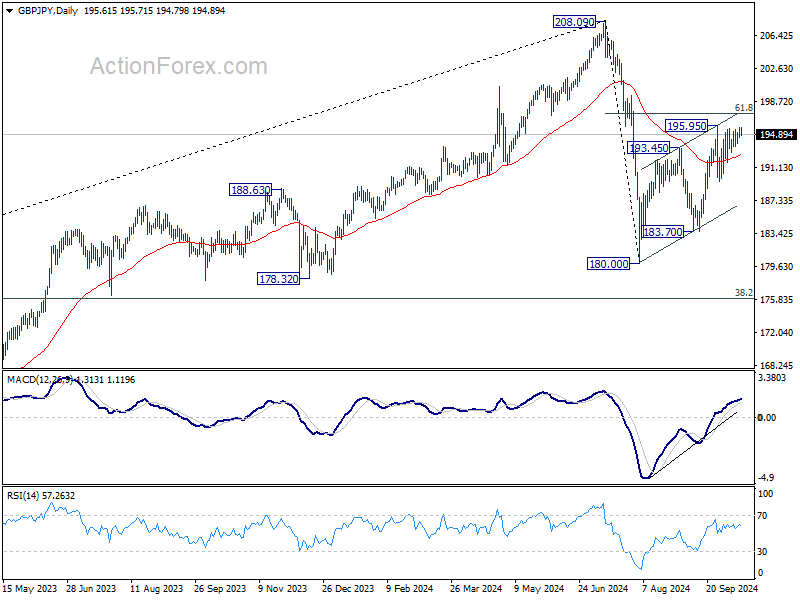
Daily Pivots: (S1) 194.91; (P) 195.31; (R1) 195.99; More...
Intraday bias in GBP/JPY remains neutral and outlook is unchanged. On the upside break of 195.95 will resume whole rise from 180.00 to 61.8% retracement of 208.09 to 180.00 at 197.35 next. Sustained break there will target 208.09 high. On the downside, break of 189.54 will turn bias back to the downside for 183.70 support instead.
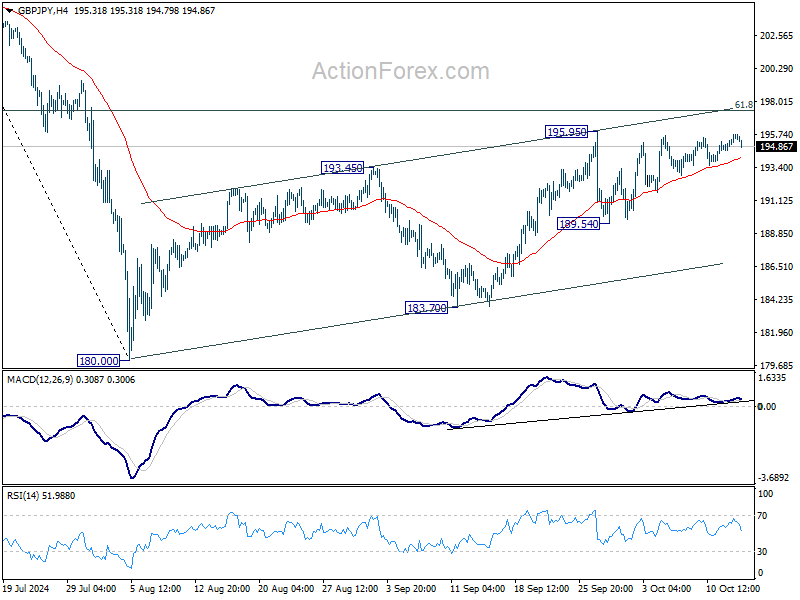
In the bigger picture, price actions from 208.09 are seen as a correction to whole rally from 123.94 (2020 low). The range of consolidation should be set between 38.2% retracement of 123.94 to 208.09 at 175.94 and 208.09. However, decisive break of 175.94 will argue that deeper correction is underway.