Sample Category Title
Fed’s Waller advocates for caution in policy easing amid solid economic conditions
In a speech overnight, Fed Governor Christopher Waller provided noted that recent economic data has been "uneven," with both positive signals and areas of concern, but emphasized that the US economy remains on "solid footing." Employment is near the Fed’s maximum objective, and inflation is approaching the target, despite some disappointing recent inflation figures.
In light of this, Waller expressed caution about the pace of monetary easing, noting that while the September 50bps cut was necessary, the Fed should now proceed with "more caution on the pace of rate cuts." He reaffirmed his view that the Fed would reduce the policy rate "gradually over the next year."
Looking ahead, Waller's baseline forecast still calls for a gradual reduction in the policy rate over the next year. However, he acknowledged uncertainty about the "final destination" for interest rates, with projections for the long-run federal funds rate varying significantly among Fed officials. The range extends from 2.4% to 3.8%, with the median estimate sitting at 2.9%.
While much of the market focus is on the size of rate cuts in the near term, Waller pointed out that the "larger message" from Fed’s economic projections is the extent of policy tightening that still needs to be reversed. If the economy continues its current stable performance, Waller expects that easing will occur gradually over time.
S&P 500 Index Wave Analysis
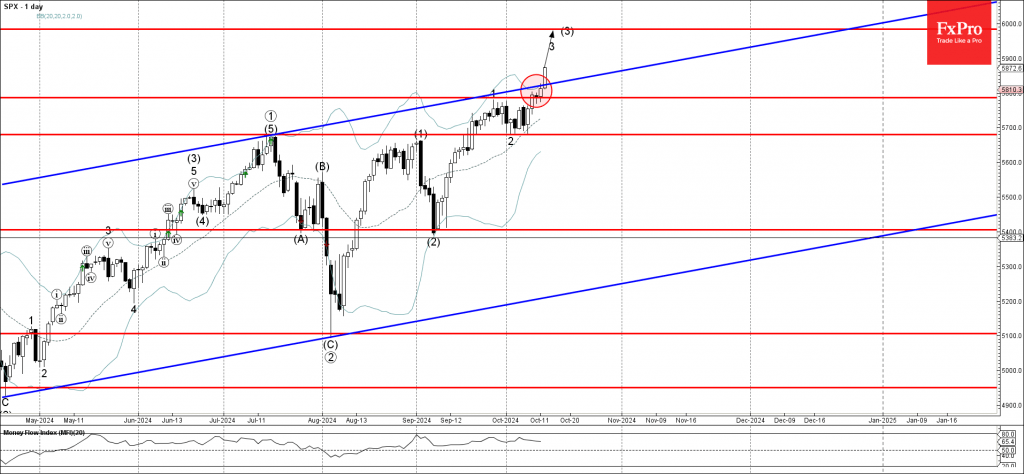
- S&P 500 index broke resistance level 5785.00
- Likely to rise to resistance level 5985.00
S&P 500 index under the bullish pressure after the price broke resistance zone located between the pivotal resistance level 5785.00 (which stopped wave 1 last month) and the resistance trendline of the daily up channel from last year.
The breakout of this resistance zone accelerated the active short-term impulse wave 3 of the higher extended impulse wave (3) from the start of September.
Given the clear daily uptrend, S&P 500 index can be expected to rise further to the next resistance level 5985.00 (target for the completion of the active impulse wave (3)).
USDJPY Wave Analysis
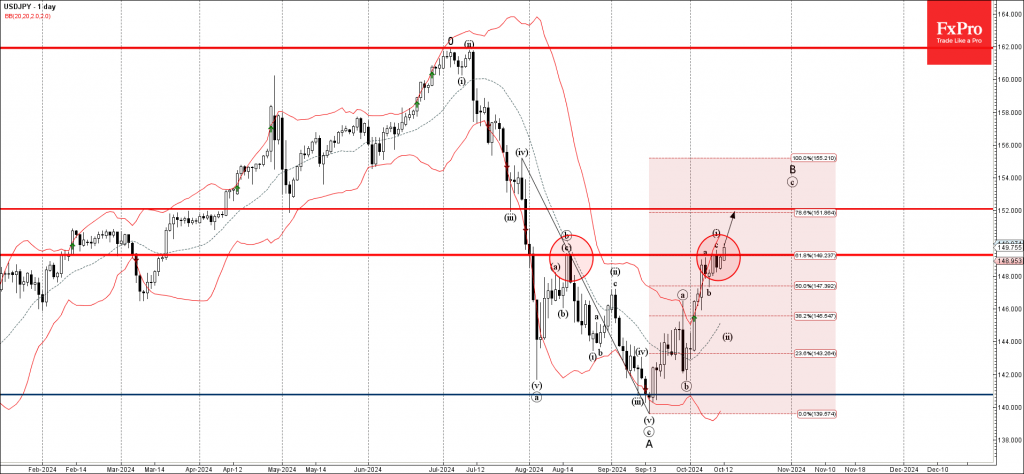
- USDJPY broke resistance zone
- Likely to rise to resistance level 152.00
USDJPY currency pair recently broke through resistance zone located between the key resistance level 149.30 (former top of wave b from the middle of August) and the 61.8% Fibonacci correction of the downward impulse wave from July.
The breakout of this resistance zone continues the active short-term impulse sequence (c) of the B-wave from the middle of September.
Given the rising bullish US dollar sentiment, USDJPY currency pair be expected to rise further to the next resistance level 152.00 (which is the former minor support from July).
China’s Data Remains Weak, But There Are Signs of a Turnaround
The past few days have been packed with economic news from China, from inflation figures to a press conference on stimulus measures. While market reaction to the data has been relatively mixed, there is a lingering sense of disappointment that may well build over the coming days.
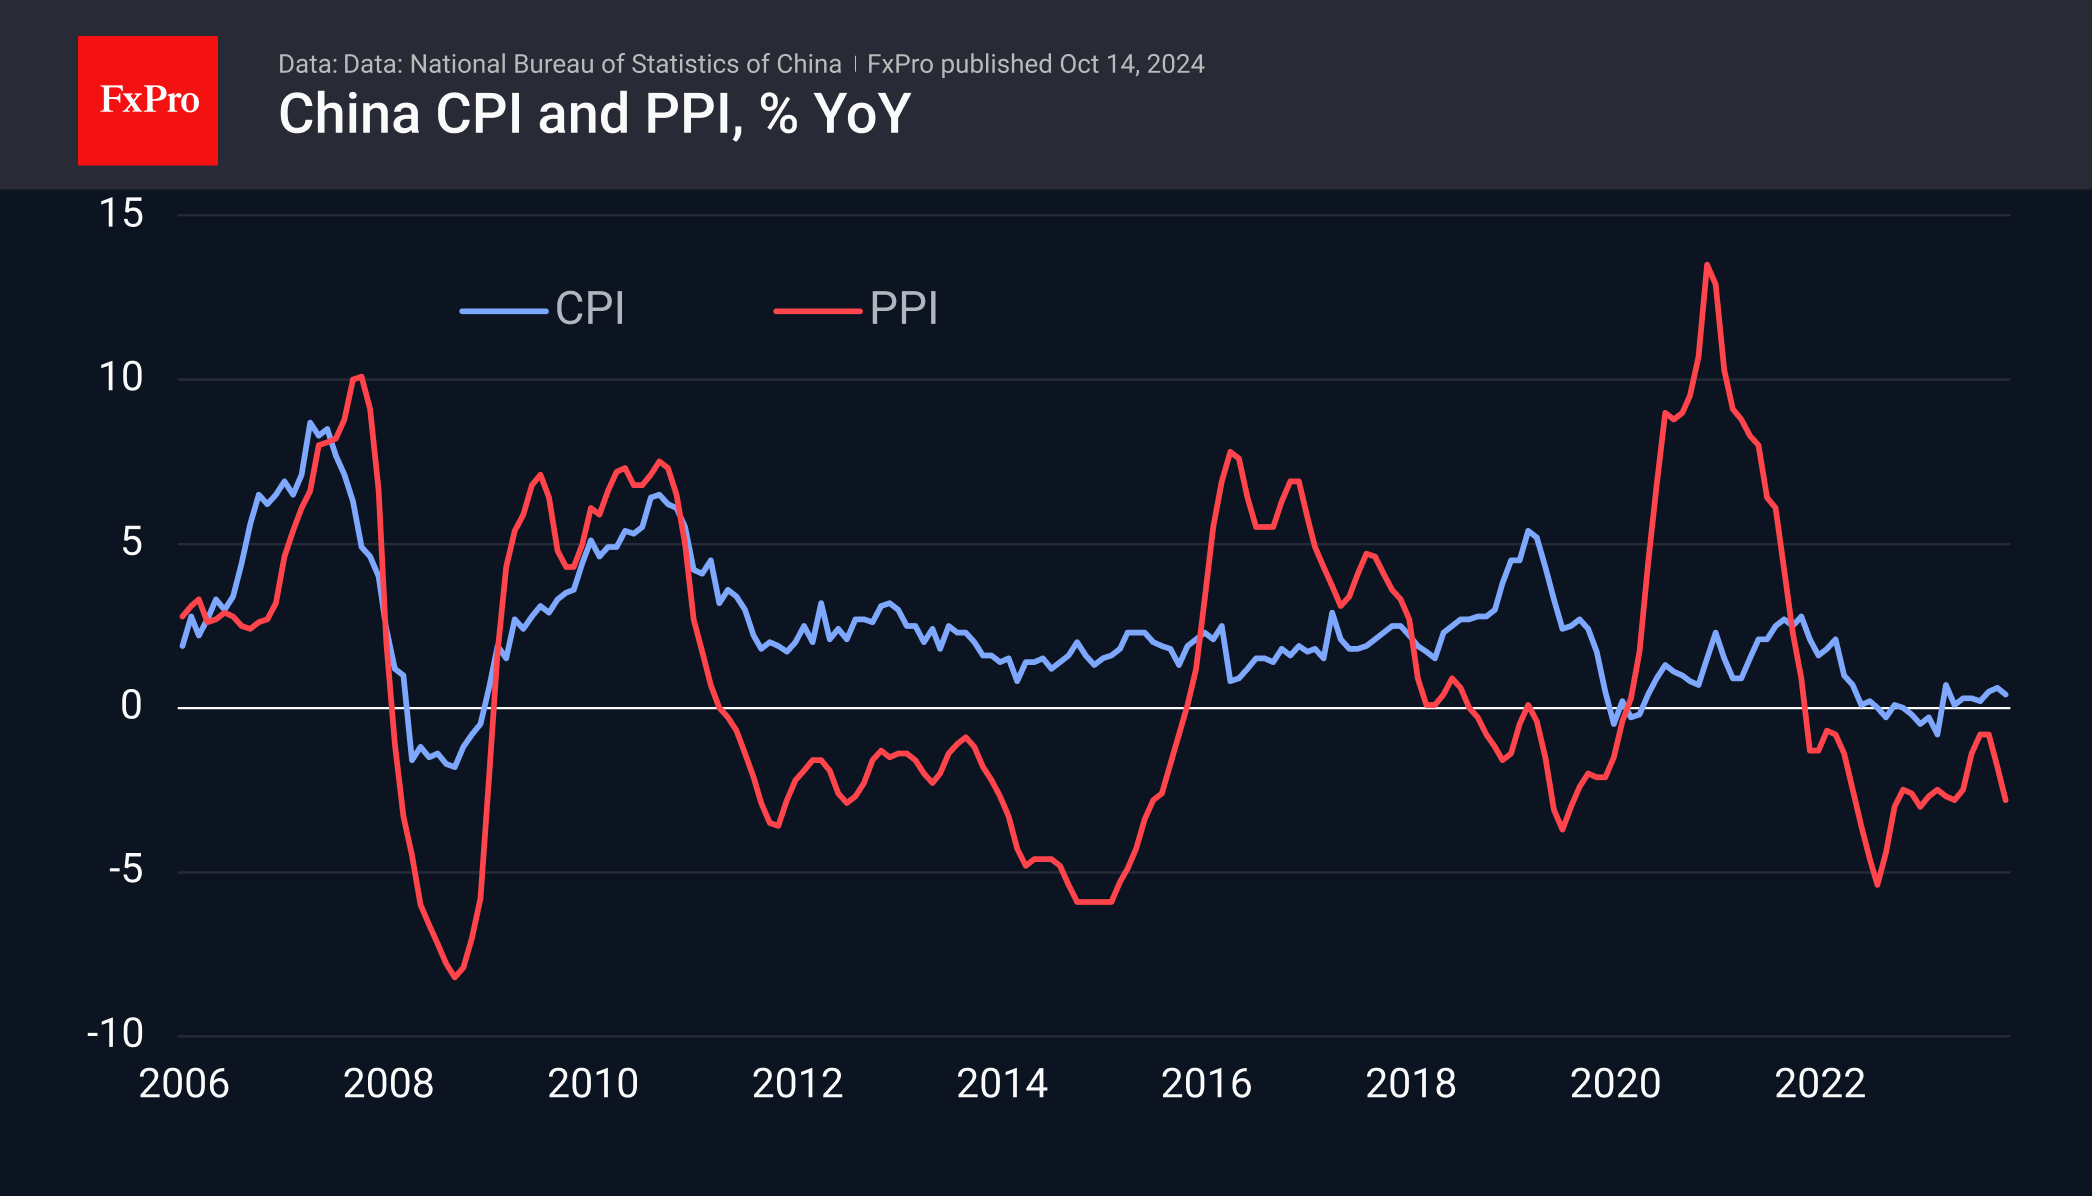
The CPI slowed to 0.4% y/y versus the expected previous 0.6%. While prices have risen year-on-year for the past seven months, the pace has been very close to zero. CPI growth has not exceeded 2% for almost two years.
The calm in the CPI broke with the start of the trade wars, when prices spiked initially, notwithstanding the fall in producer prices. The pandemic and further isolation have pushed final prices down in China and up in the US.
Producer price dynamics suggest that this trend will continue. PPI in September was 2.8% lower than a year earlier, remaining in contractionary territory since October 2022 and accelerating losses in the last two months. The latter is a clear signal of the need to increase the economy’s stimulus.
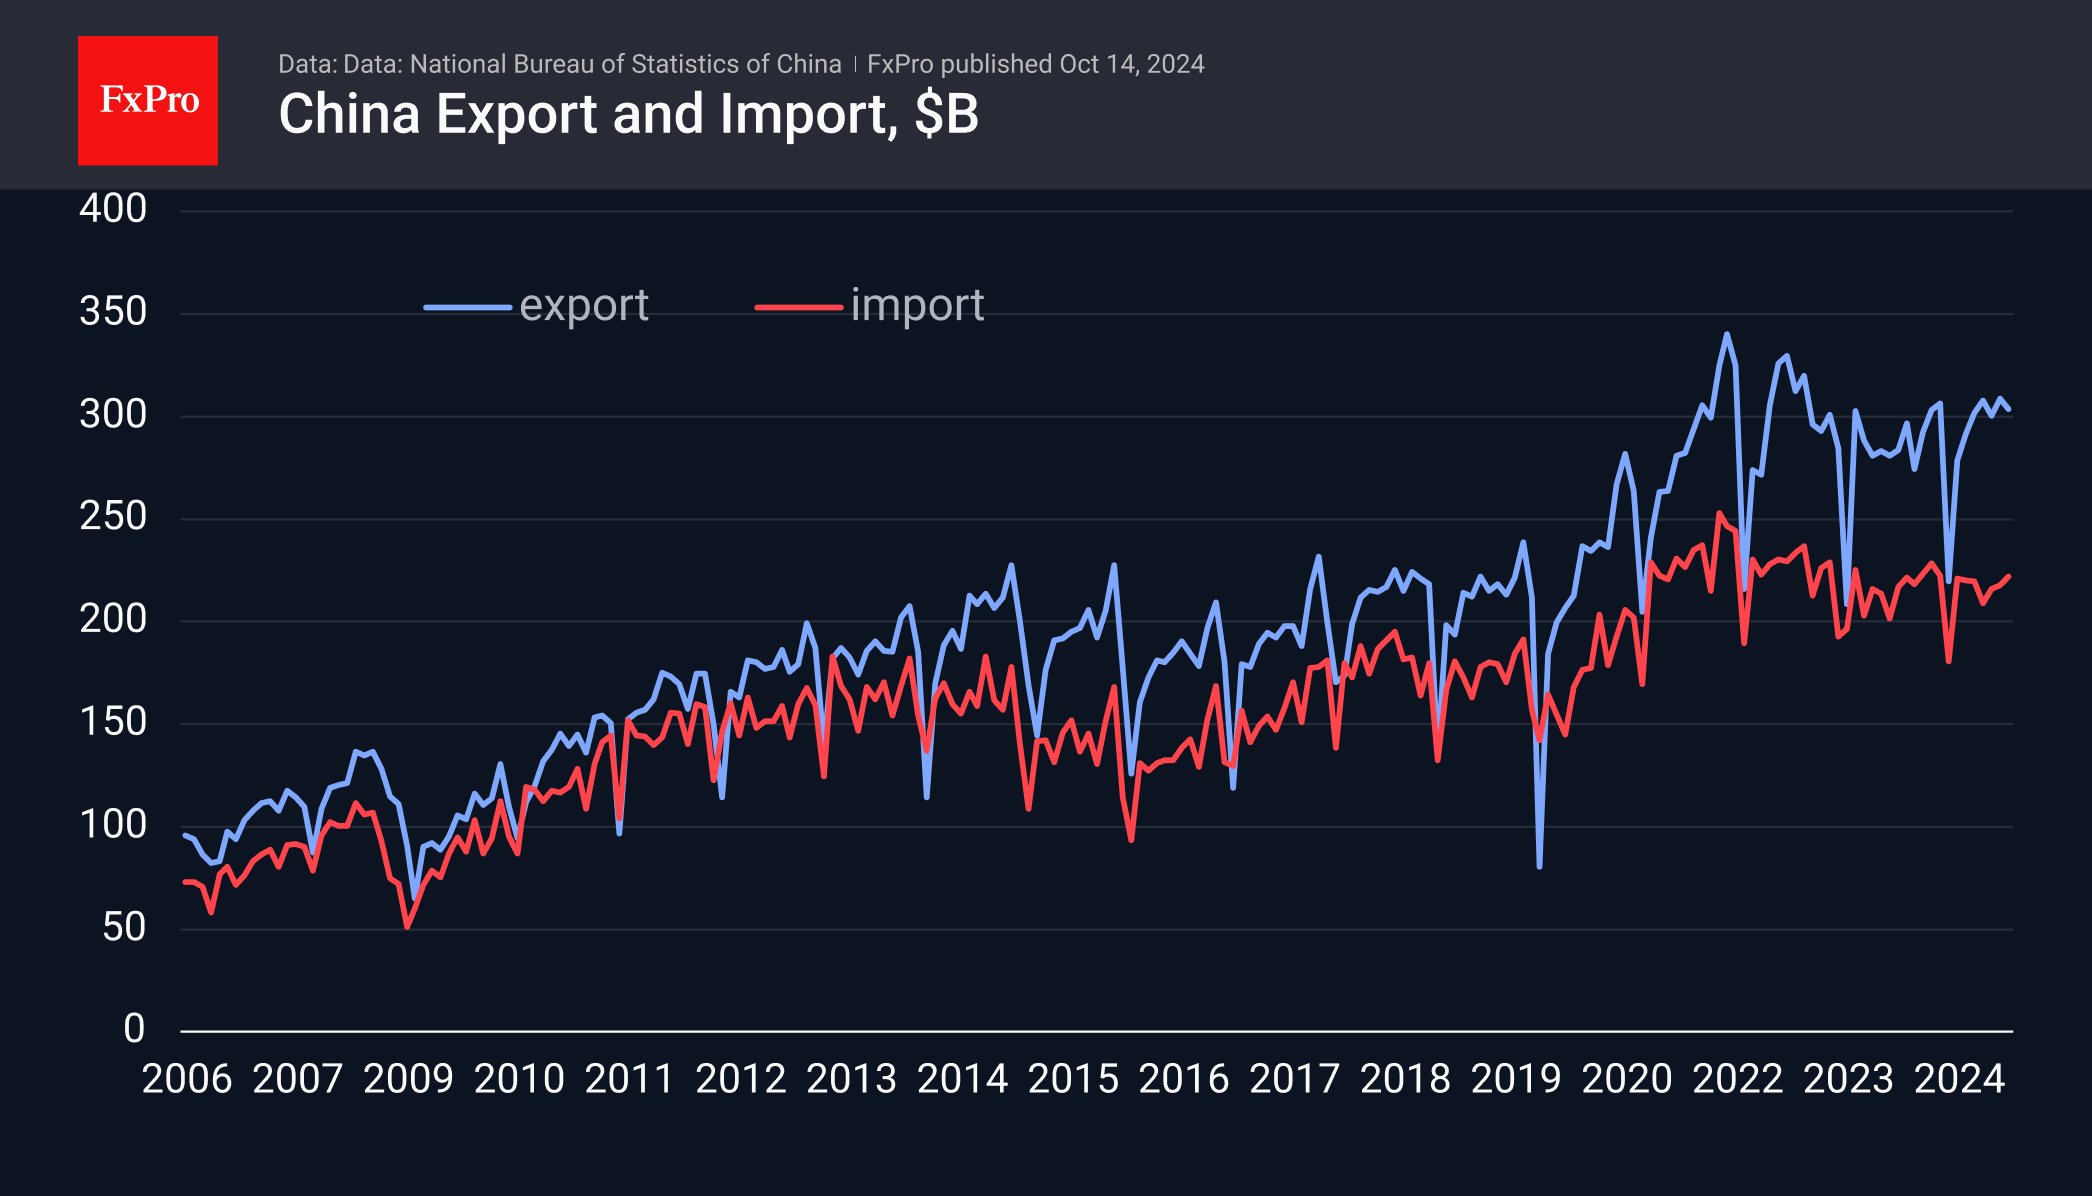
A similar conclusion can be drawn from the external trade data, where the surplus fell to $81.7bn, compared with $91.0bn a month earlier and $91.5bn expected. This is the smallest surplus since April but is the result of a rebound in imports. The trade data may be providing early signals of a recovery in Chinese economic activity. However, it will only be possible to talk about a change in market sentiment if there are reliable signs of stronger final demand in the form of retail sales or higher exports.
Monetary dynamics data released on Monday already showed that money is still flowing into the economy. The M2 growth rate stopped declining in July and reached 6.8% y/y in September.
The data is mostly negative for the Chinese currency. Weak inflation creates room for monetary or fiscal easing, while the shrinking trade surplus points to a slowdown in money inflows.
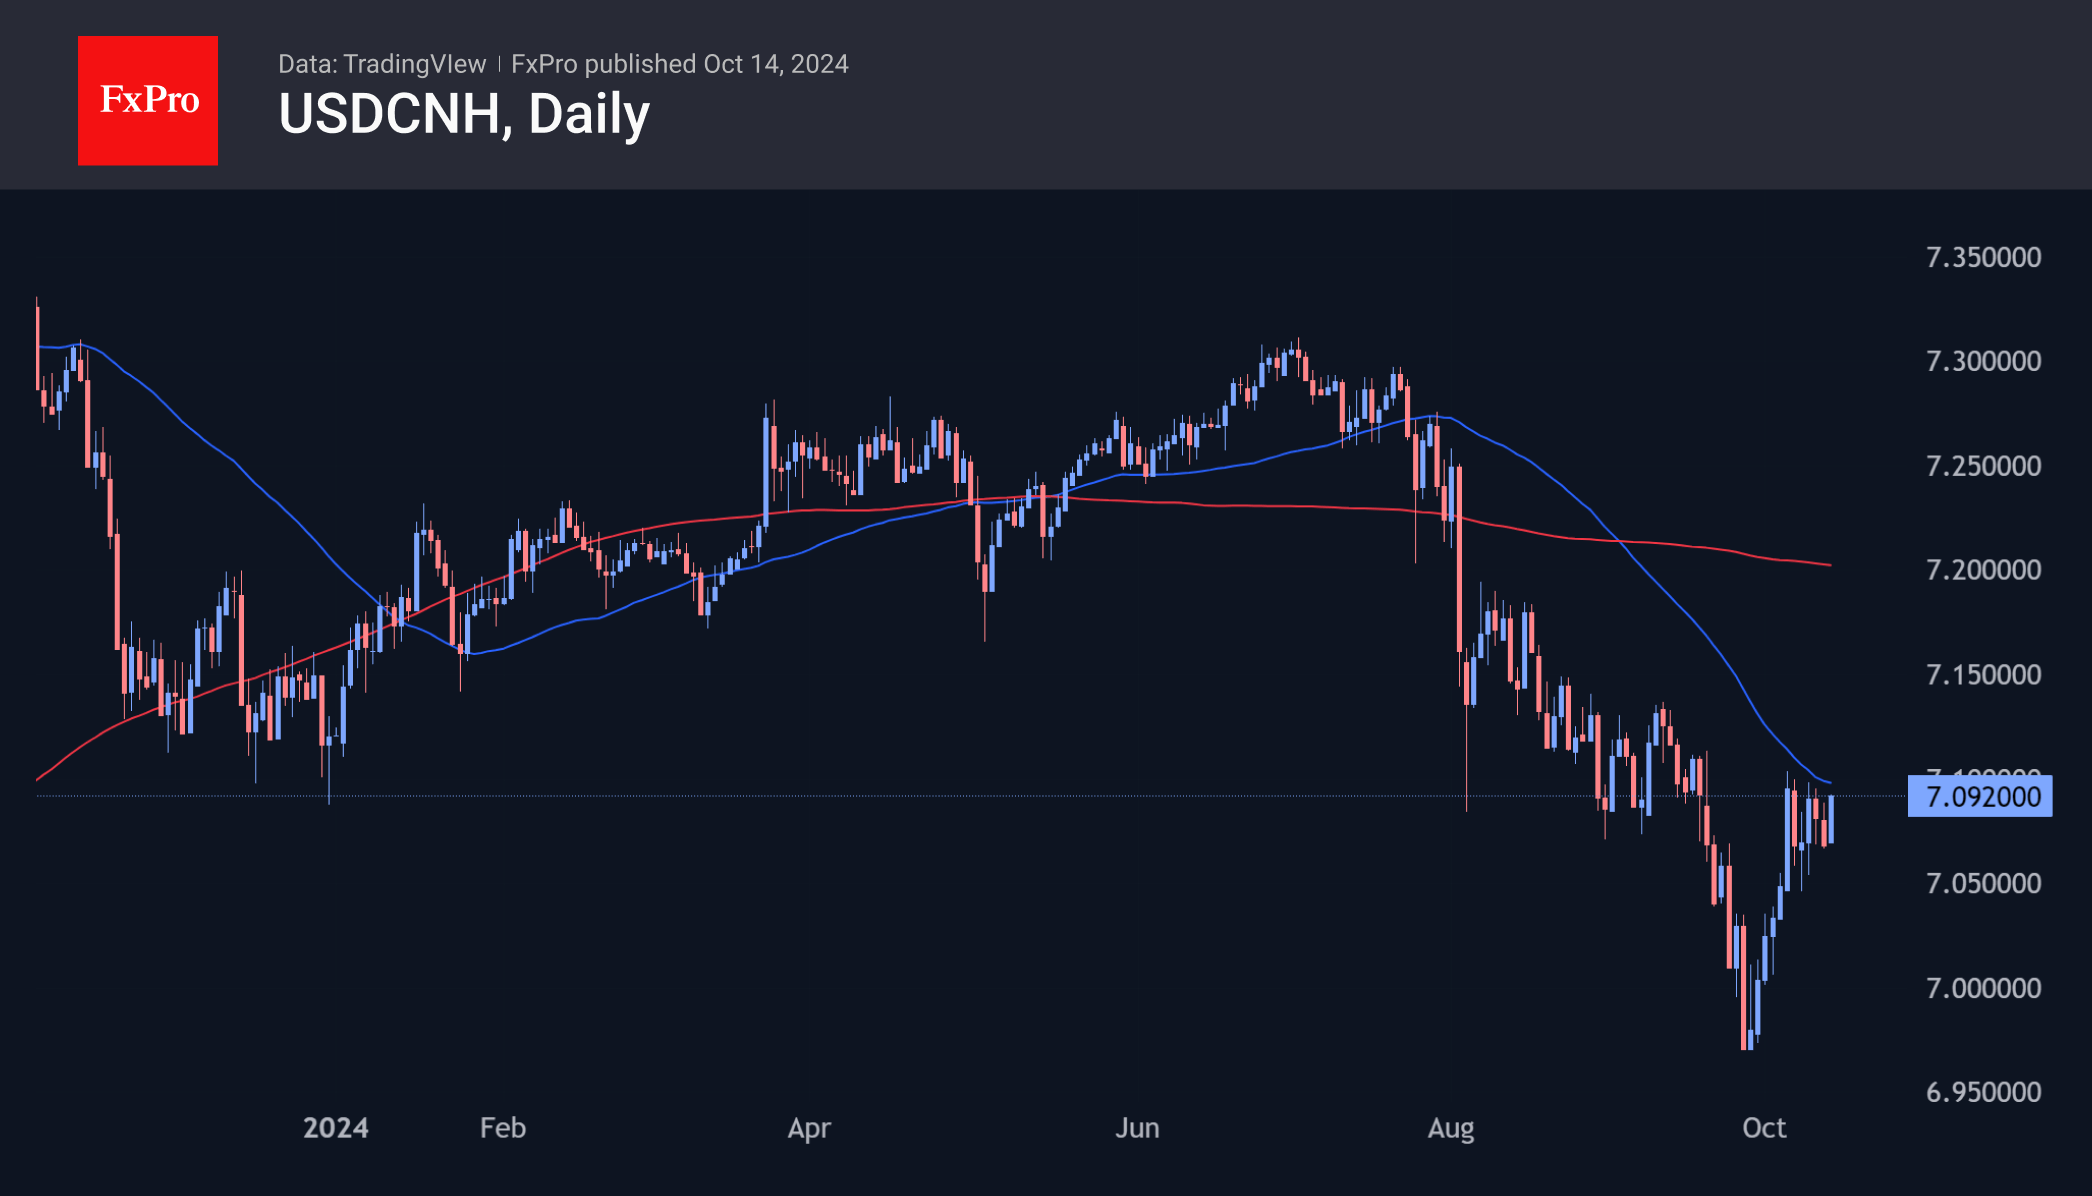
The USDCNH is trading at 7.09, up 1.75% from its late September lows—almost half the rise in the Dollar Index over the same period. Technically, the pair’s advance could accelerate as it enters the area above 7.10, close to the 50-day MA, and has few obstacles until 7.20, the next round-trip level, and the 200-day MA.
XAUUSD Perfectly Reacting Higher From The Blue Box Area
In this technical blog, we will look at the past performance of the 1-hour Elliott Wave Charts of the XAUUSD. The rally from the 25 July 2024 low showed a higher high sequence & provided a short-term opportunity at the blue box area. In this case, the pullback managed to reach the blue box area & provided a perfect reaction higher. So, we advised members not to sell Gold but to buy the blue box area for a minimum reaction higher to happen. We will explain the structure & forecast below:
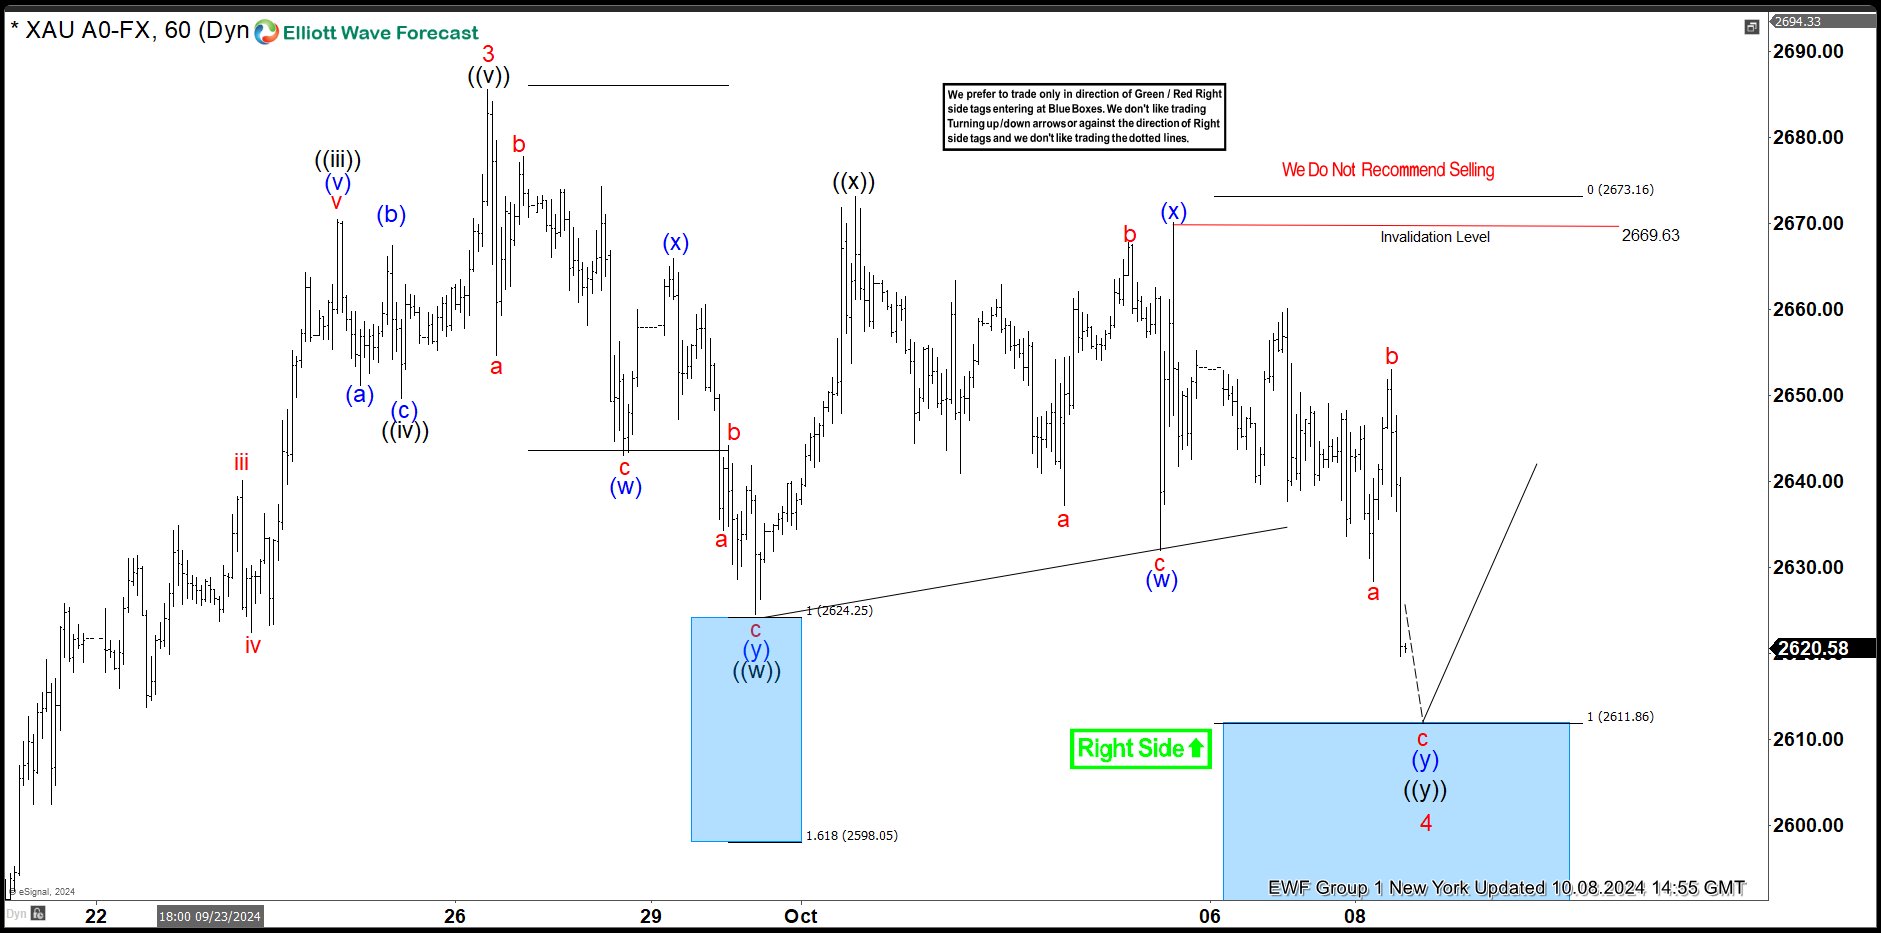
XAUUSD 1-Hour Chart From 10.08.2024 NY Update
Here’s the 1-hour Elliott wave Chart from the 10.08.2024 NY update. In which, the rally to $2685.58 high ended wave 3 & made a pullback in wave 4. The internals of that pullback unfolded as Elliott wave double three structure where wave ((w)) ended at $2624.54 low. Then a short-term bounce to $2673.14 high-ended wave ((x)) & started the next leg lower in wave ((y)) towards $2611.86- $2573.73 equal legs area. From there, buyers were expected to appear looking for new highs ideally or for a 3-wave bounce minimum.
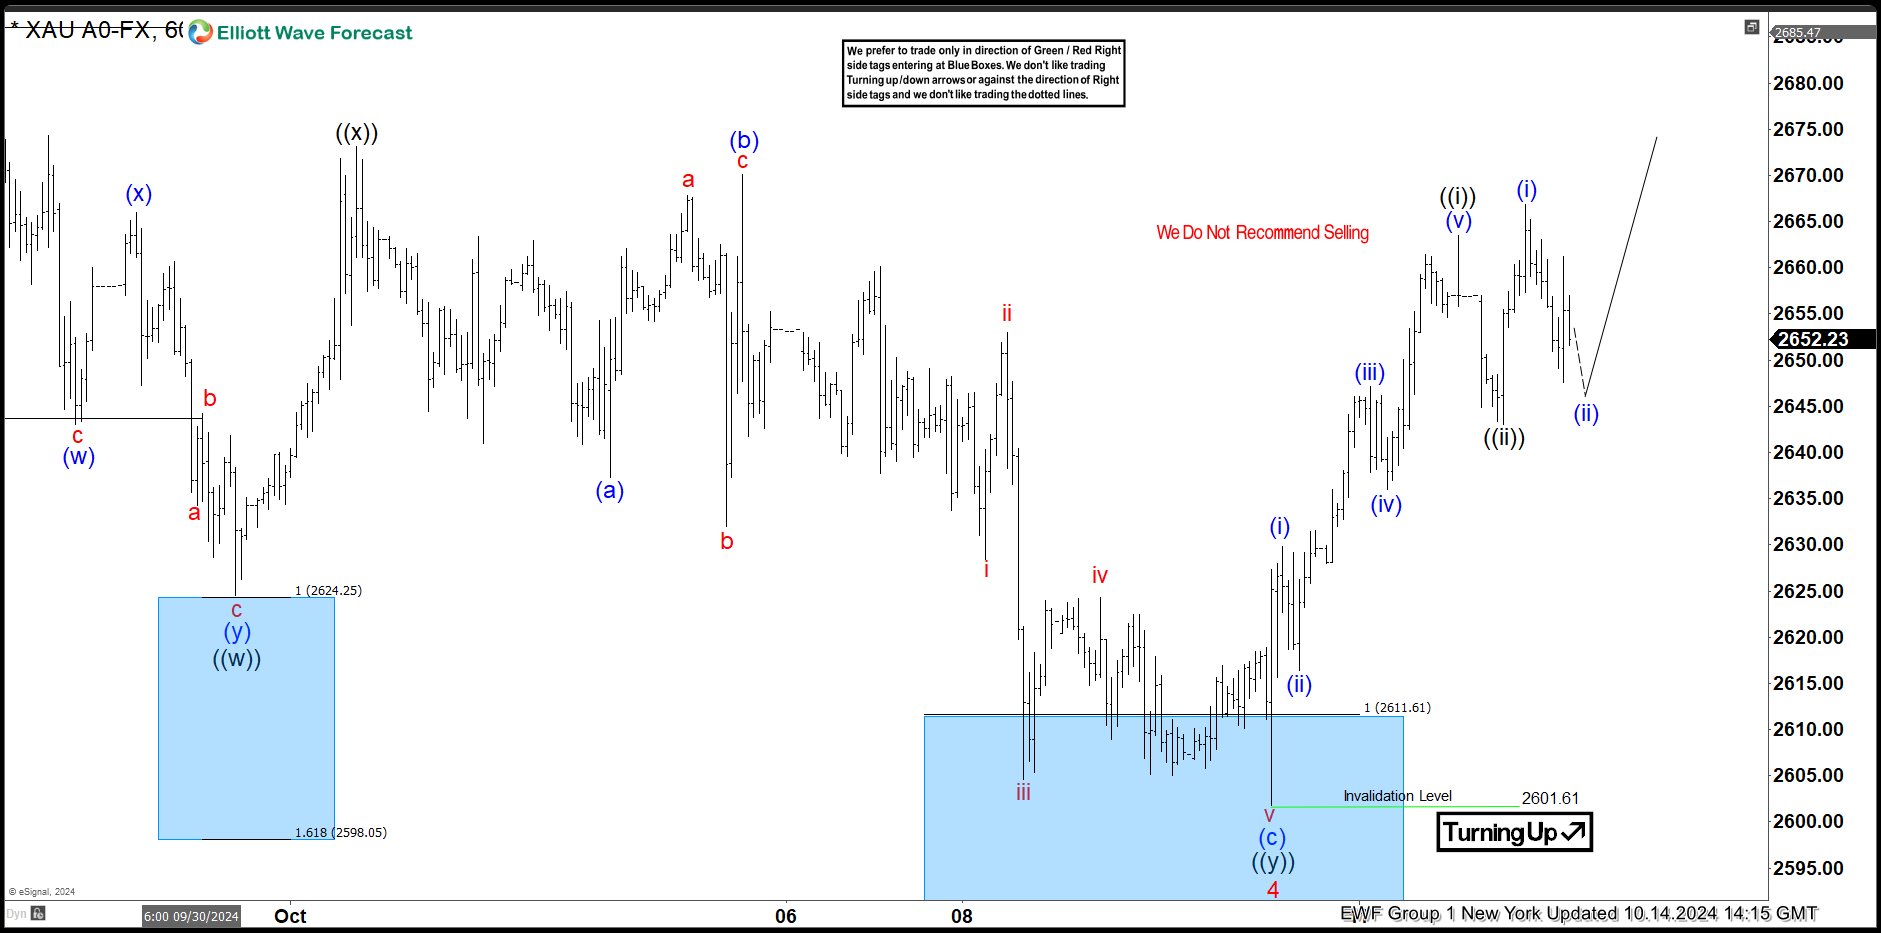
XAUUSD Latest 1-Hour Chart From 10.14.2024 NY Update
Above is the Latest 1-hour Elliott Wave Chart from the 10.14.2024 NY update. In which the metal is showing a perfect reaction higher taking place from the equal legs area. Right after ending the double correction. Allowed members to create a risk-free position shortly after taking a long position. But a break above $2685.58 high would still be needed to confirm the next leg higher minimum towards the $2705.22- $2737.27 area & avoid double correction lower.
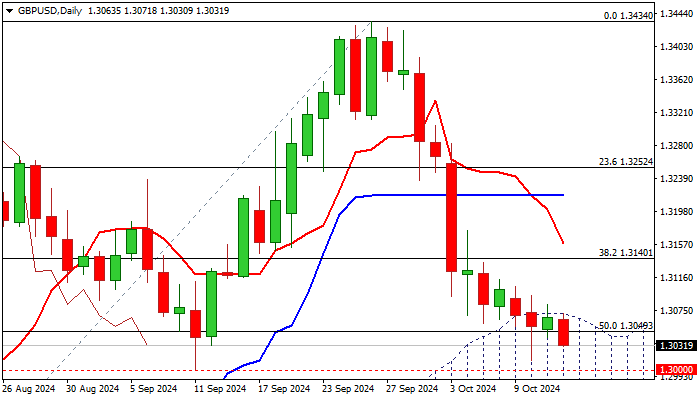
GBP/USD: Bearish Bias Under Daily Cloud Top
Bears hold grip and keep the price within daily cloud for the third straight day, with cloud top acting as solid resistance and limits upticks.
Renewed probe through 1.3049 (50% retracement of 1.2664/1.3434) looks for eventual firm break here to signal bearish continuation for attack at psychological support at 1.30 (also Sep 11 higher low), which guards more significant levels at 1.2958 (Fibo 61.8%) and 1.2940 (daily cloud base).
Daily studies are weakening as negative momentum continues to strengthen and south heading daily Tenkan-sen diverges from Kijun-sen after formation of bear cross, however bears may face headwinds as stochastic emerged from oversold territory.
Near term bias is expected to remain with bears while the action stays capped by cloud top (1.3071).
Res: 1.3049; 1.3071; 1.3113; 1.3140.
Sup: 1.3000; 1.2958; 1.2945; 1.2870.
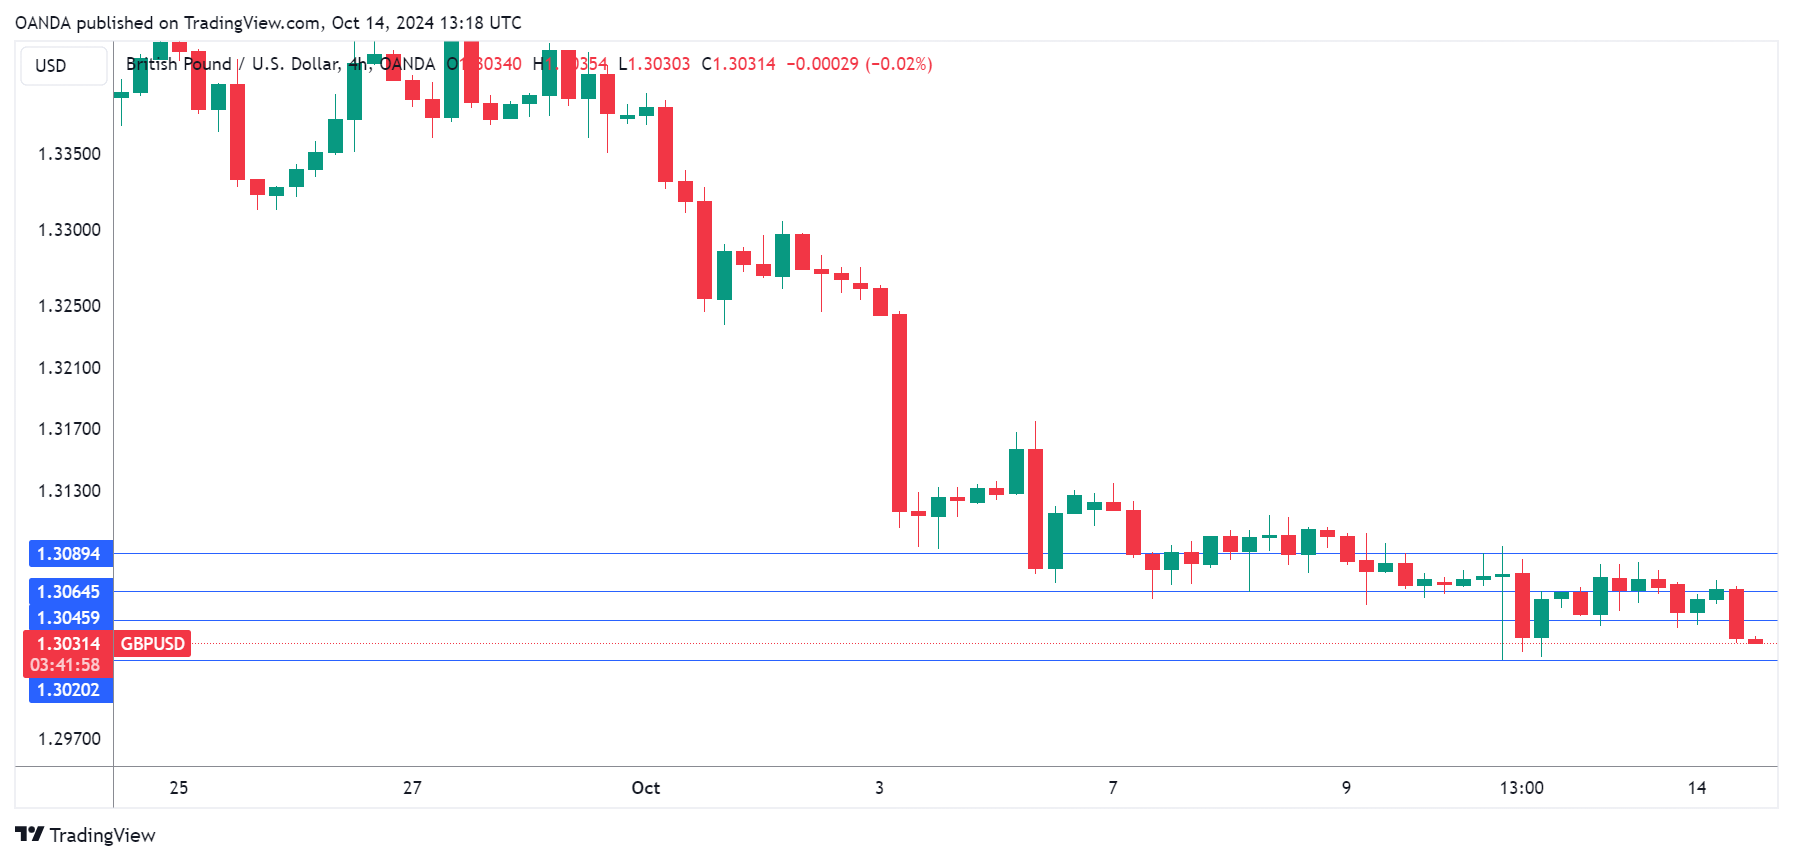
Pound Eyes UK Employment Data
The British pound is coming off a quiet week and the lack of activity has continued on Monday. Early in the North American session, GBP/USD is trading at 1.3040, down 0.14% on the day.
It’s a busy week in the UK, with the release of employment, inflation and retail sales. These key reports will be key factors in determining whether the BoE cuts or maintains rates at the November 9 meeting. The central bank has lowered rates only once this year but is expected to cut by 25 basis points at each of the November and December meetings, followed by cuts of 125 basis points in 2025.
The UK releases the September employment report on Tuesday. Job growth is expected to ease slightly to 250 thousand, compared to 265 thousand in August. The unemployment rate is expected to remain unchanged 4.1%. Wage growth, which has been high and putting upward pressure on inflation, is expected to ease, with average earnings excluding bonuses projected to drop from 5.1% to 4.9%.
The BoE delivered its first rate cut in over four years in August but stayed on the sidelines in September. Governor Bailey said at the September meeting that the BoE had to be “careful not to cut too fast or by too much”. The BoE wants to trim rates gradually but there is growing pressure to get on with it – with inflation contained and running close to the BoE’s 2% target, interest rates are far too high at 5%. The new government has made economic growth a priority and lower interest rates will help kick-start the economy.
The Federal Reserve has also lowered rates only once in the new cycle of rate-cutting, but its jumbo 50-basis point cut showed that markets that the Fed means business and can be aggressive. The Fed is expected to cut another 50 or 75 basis points before year’s end. With only two more rate meetings this year, the most likely scenario is rate cuts of 25 bps in November and December. The Fed could, however, deliver one more 50 bps cut if employment or inflation numbers are lower than expected.
GBP/USD Technical
- GBP/USD is testing resistance at 1.3958. Above, there is resistance at 1.3095
- 1.3023 and 1.2986 are the next support levels
Fed’s Kashkari: Further modest rate reduction appropriate in coming quarters
In a speech today, Minneapolis Fed President Neel Kashkari indicated that " further modest reductions in our policy rate will be appropriate in the coming quarters to achieve both sides of our mandate."
Kashkari stressed that future decisions will be data-driven, stating that "ultimately, the path ahead for policy will be driven by the actual economic, inflation, and labor market data."
While acknowledging that the current federal funds rate, set between 4.75% and 5%, remains restrictive, Kashkari noted that it is still unclear exactly how much this restrictiveness is weighing on economic growth.
However, he expressed confidence in the Fed’s progress toward its inflation goals, saying the central bank is in the "final stages of bringing inflation down to our 2% target."
Sunset Market Commentary
Markets
Chinese stock markets eventually closed 2% to 3% higher, giving the benefit of the doubt to further steps to support the property sector and hints at greater borrowing announced by Finance Minister Lan Fo’an on Saturday. Beijing didn’t disclose a headline figure, but measures got the thumbs up for now. The Chinese yuan failed to profit with USD/CNY at 7.0850 reaching its highest level since mid-September. Chinese trade data (reported after Asian close) showed exports only rising by 2.4% Y/Y (in USD terms vs +6% expected) with imports (+0.3% Y/Y) barely higher than a year ago. The trades surplus shrank from $91.02bn to $81.71bn. Weakness in both external and domestic demand motivate Chinese stimulus measures. More Chinese September/Q3 figures are scheduled for Friday with retail sales, production numbers and GDP data. European stock markets didn’t copy the Chinese gains, trading sideways amid an empty EMU eco calendar. Belgian OLO’s and French OAT’s slightly underperformed after rating agency’s Moody’s and Fitch respectively changed the outlook on the nation’s Aa3 and AA- credit ratings from stable to negative over a combination of political uncertainty and unsustainable public finances. The Belgian 10y swapspread increased from 40 bps to 42 bps. The underperformance could last with October 25 being the next possible pitfall when rating agency S&P gives its update on the Belgian AA rating (positive). That’s one notch above both Moody’s and Fitch for now. Belgium risks an effective downgrade by Fitch early next year. By that time, Fitch applied a negative outlook for two years, traditionally the time frame within they decide over a downgrade yes or no. German yields are up to 1 bp higher across the curve amid thin trading conditions. US markets remain closed in celebration of Columbus Day, but a speech by Fed president Waller on the economic outlook could still prove to be interesting. EUR/USD is dragged lower in the run-up to the ECB meeting later this week which is expected to deliver another 25 bps rate cut. The pair changes hands at 1.0910 from a start at 1.0938. EUR/GBP (0.8370) treads water. UK eco data can from tomorrow (labour market report) justify BoE president Bailey’s call to become more activist. CPI (Wednesday) and retail sales (Friday) follow later on this week.
News & Views
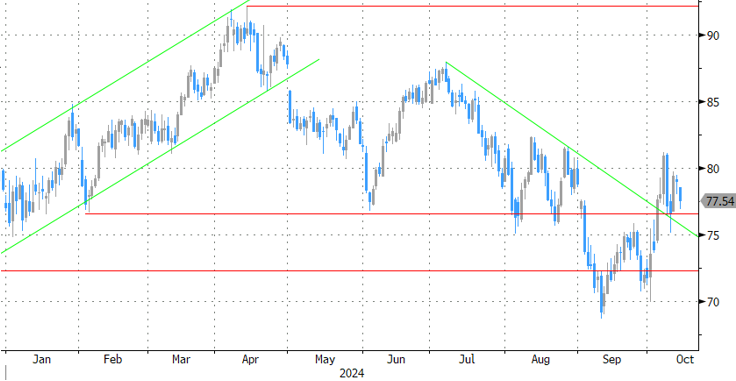
OPEC trimmed its forecast for oil-demand growth for a third consecutive time. The oil cartel now expects demand to grow by 1.93mn barrels a day in 2024 and by 1.64mn in 2025. This compares to 2.03mn and 1.74mn respectively in its previous forecast. Both remain well above the historical average of 1.4mn seen just before the pandemic struck though. The 100k 2024 revision came almost exclusively on the account of China, where demand is projected to grow by 580k instead of the 650k earlier. OPEC estimates total global demand to hit 104.1mn this year before reaching 105.8mn in the next. The forecast adjustment comes as the oil production group is considering to bring back some of the withheld output from December, two months later than originally planned. Oil prices have rebounded from their September multi-year lows but lingering demand concerns continue to dominate over potential supply disruptions related to the Middle East conflict. After a short adventure north of $80, a barrel of Brent is currently trading around $77.45 with opening losses this morning being the result of China’s keeping the specifics (price tag) on fiscal stimulus measures announced on Saturday unclear.
The Hungarian economy ministry today proposed plans to allow savers to tap into their private pension funds tax free to buy or renovate property in 2025. The cost of housing and/or renovation has soared in the wake of the inflation surge (which went as high as 25% on a headline basis). The Orban administration is also looking for ways to prop up the economy as the country is headed for elections in 2026. The ruling party and main opposition group are polling neck-and-neck currently. But stretched budgets – deficits have averaged 7% since the pandemic – mean there’s little scope to do so. Whether this will make a material difference to the economy is highly uncertain. The ministry said more than 1mn private pension fund members had savings worth HUF 2mn which could now be tapped tax-free for housing purposes. The news barely impacted the forint. EUR/HUF continues to hover north of the symbolically important 400 barrier.
Graphs
Brent oil ($/b) slips at the open, unable to shake off demand-driven worries
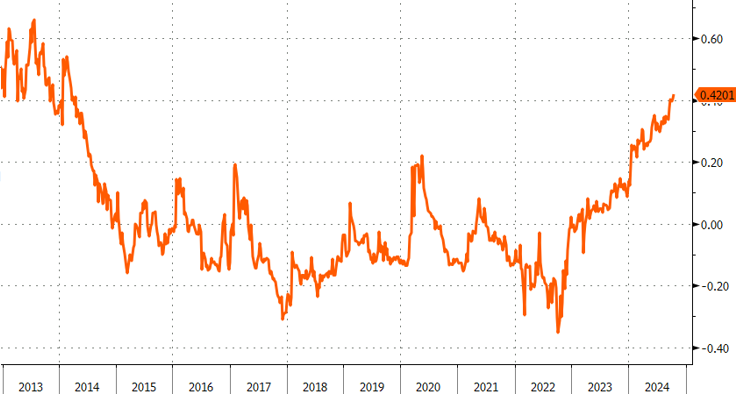
Belgian 10-yr swapsspread (weekly) at highest in a decade amid semi-core underperformance following rating outlook downgrades
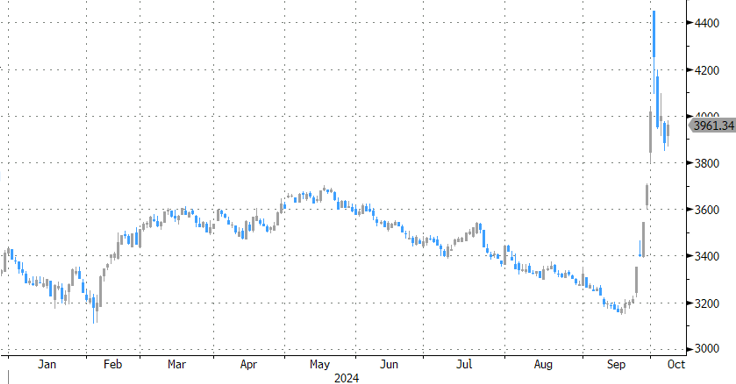
CSI300: Chinese stocks give government’s stimulus plans benefit of the doubt
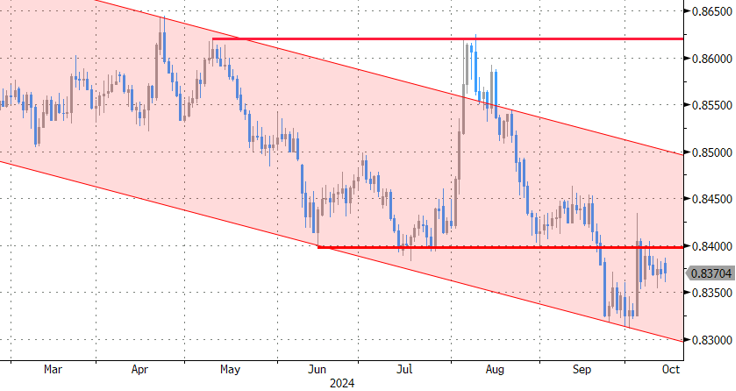
EUR/GBP: sterling trades sideways ahead of important eco update that either validates or nullifies Bailey’s call for activism