Sample Category Title
EUR/USD Mid-Day Outlook
Daily Pivots: (S1) 1.0923; (P) 1.0938; (R1) 1.0954; More....
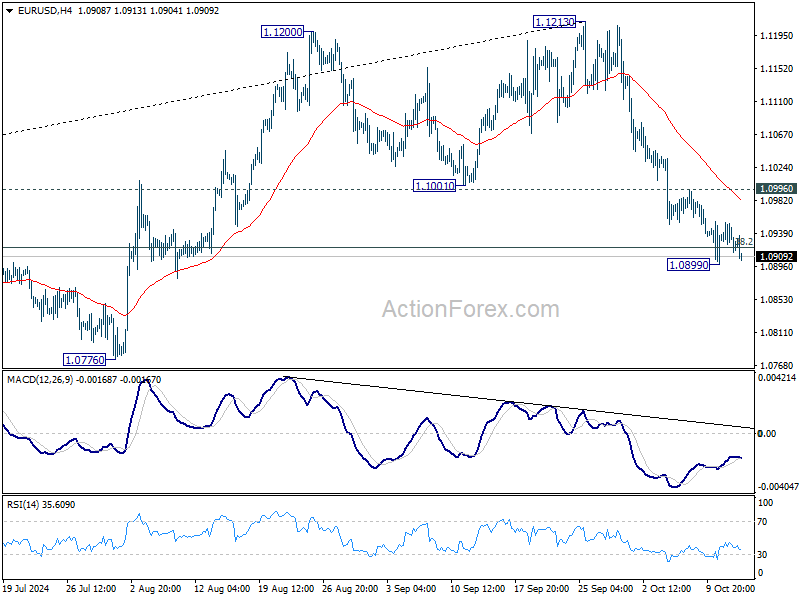
EUR/USD is staying above 1.0899 temporary low and intraday bias stays neutral first. Further decline is expected as long as 1.0996 resistance holds. On the downside, sustained break of 38.2% retracement of 1.0447 to 1.1213 at 1.0920 will argue that fall from 1.1213 is the third leg of the corrective pattern from 1.1274. In this case, deeper decline would be seen to 61.8% retracement at 1.0740 next.
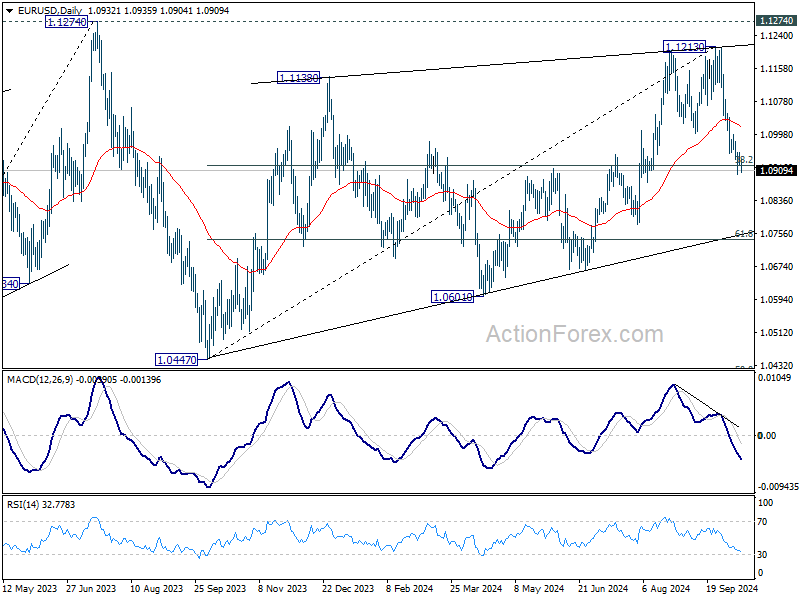
In the bigger picture, rejection by 1.1274 resistance suggests that corrective pattern from 1.1274 (2023 high) is not completed yet. Instead, decline from 1.1213 might be another falling leg. Sustained break of 55 W EMA (now at 1.0877) will validate this case, and bring deeper fall towards 1.0447 support again.
GBP/USD Mid-Day Outlook
Daily Pivots: (S1) 1.3045; (P) 1.3064; (R1) 1.3089; More...
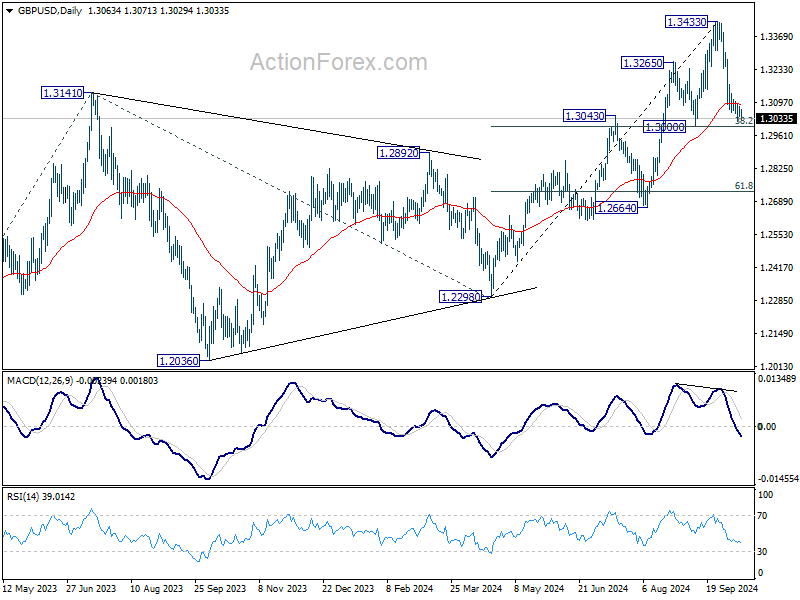
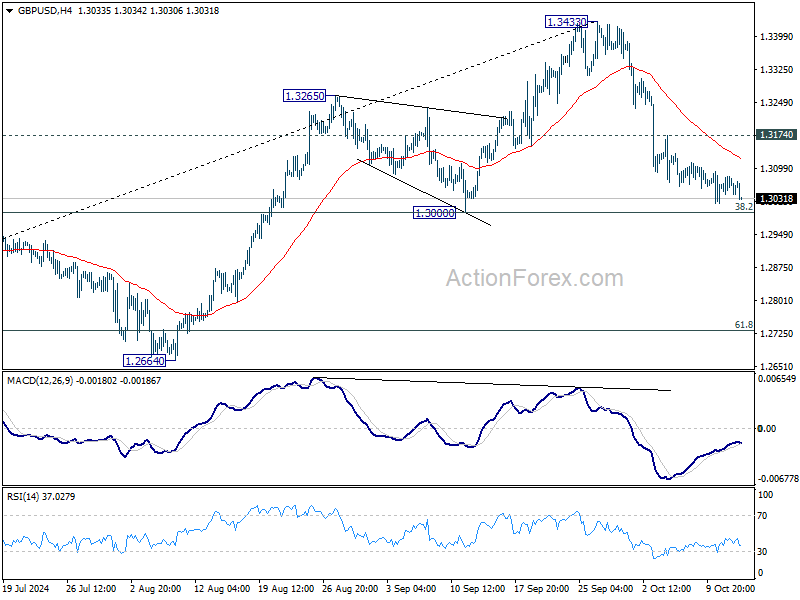
Intraday bias in GBP/USD stays neutral and outlook is unchanged. Fall from 1.3433 short term top could extend lower. But strong support should be seen from 1.3000 cluster support (38.2% retracement of 1.2298 to 1.3433 at 1.2999) to contained downside. Above 1.3174 minor resistance will turn bias back to the upside for stronger rebound. However, decisive break of 1.3000 will carry larger bearish implications.

In the bigger picture, as long as 1.3000 support holds, the up trend from 1.0351 (2022 low) is still in progress. Next target is 61.8% projection of 1.0351 to 1.3141 from 1.2298 at 1.4022. However, considering mild bearish divergence condition in D MACD, decisive break of 1.3000 will argue that a medium term top is already in place, and bring deeper fall back to 1.2664 support next.
USD/CHF Mid-Day Outlook
Daily Pivots: (S1) 0.8557; (P) 0.8573; (R1) 0.8590; More…
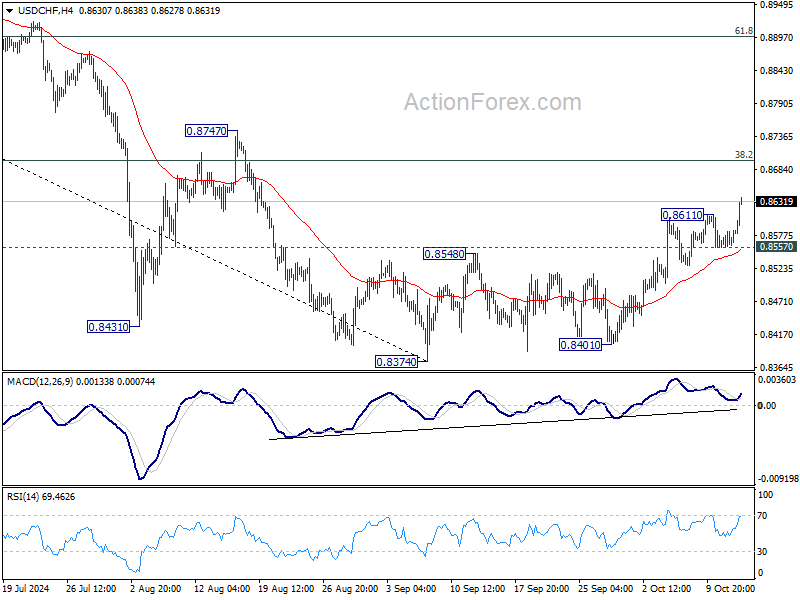
USD/CHF's rise from 0.8374 resumed after brief consolidations Intraday bias is back on the upside for 38.2% retracement of 0.9223 to 0.8374 at 0.8698. Sustained break there will argue that fall from 0.9223 has completed after defending 0.8332 low. On the downside, below 0.8557 minor support will turn intraday bias neutral again first.
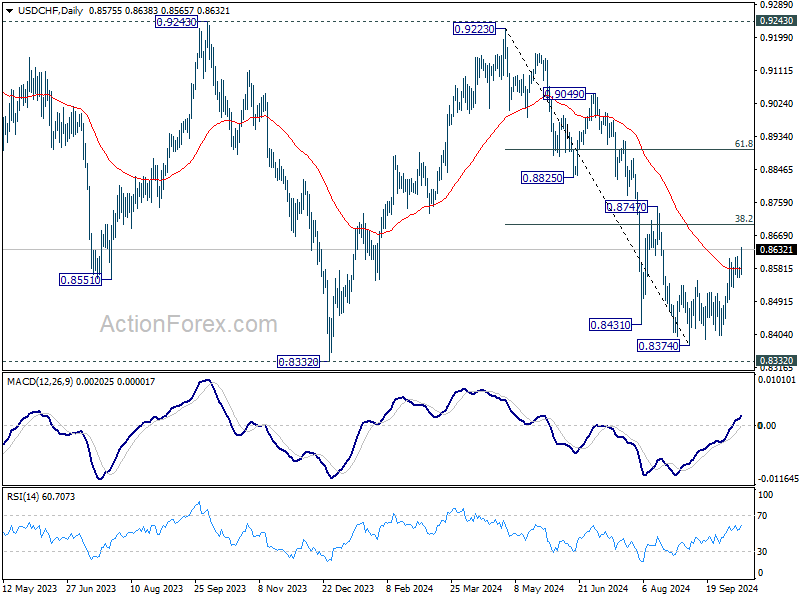
In the bigger picture, price actions from 0.8332 (2023 low) are currently seen as a medium term corrective pattern, with fall from 0.9223 as the second leg. Strong support could be seen from 0.8332 to bring rebound. Yet, overall outlook will continue to stay bearish as long as 0.9243 resistance holds. Firm break of 0.8332, however, will resume larger down trend from 1.0146 (2022 high).
USD/JPY Mid-Day Outlook
Daily Pivots: (S1) 148.58; (P) 148.94; (R1) 149.46; More...
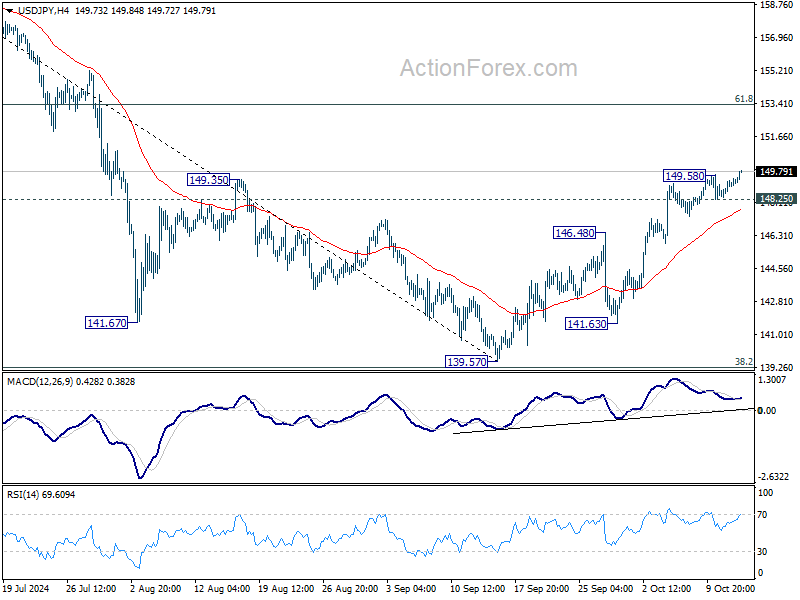
USD/JPY's rise from 139.57 resumed after brief consolidations and intraday bias is back on the upside, This rally is seen as the second leg of the corrective pattern from 161.94, and should target 61.8% retracement of 161.94 to 139.57 at 153.39 next. On the downside, below 148.25 minor support will turn intraday bias neutral again first.
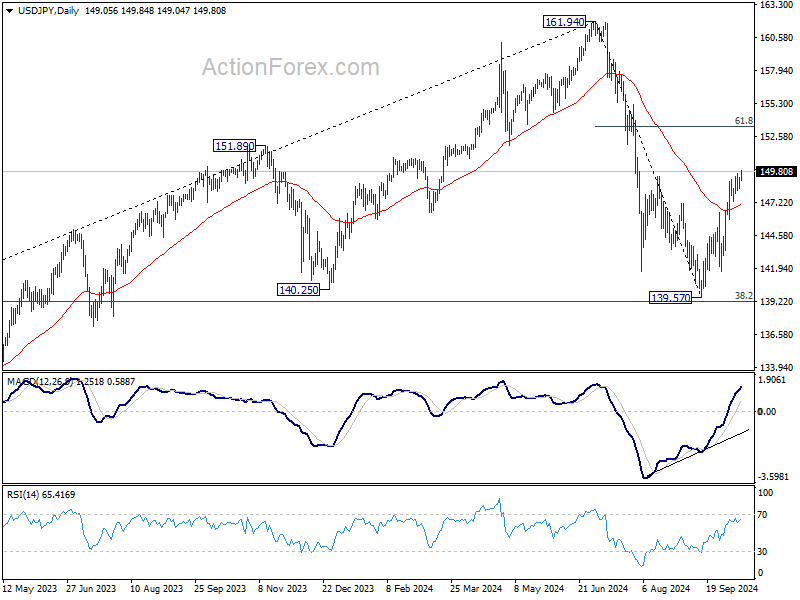
In the bigger picture, price actions from 161.94 are seen as a corrective pattern to rise from 102.58 (2021 low). The range of medium term consolidation should now be set between 38.2% retracement of 102.58 to 161.94 at 139.26 and 161.94. Nevertheless, sustained break of 139.26 would open up deeper medium term decline to 61.8% retracement at 125.25.
Dollar Rallies as Thin Liquidity Fuels Gains
Dollar is broadly stronger today in what is otherwise a quiet trading session. With US markets closed for holiday, overall activity has been subdued. However, Dollar bulls seem to be taking advantage of the thinner liquidity to push the greenback higher. The anticipation of further interest rate cuts from ECB this week, and more to come, is providing additional support for Dollar. Additionally, the lack of clarity surrounding China’s fiscal stimulus continues to weigh on the Aussie and Kiwi, keeping both on the back foot.
In addition to ECB rate cut, attention is also on the UK, where a series of key economic releases are due throughout the week. Tomorrow's employment and wage growth data kick off a lineup that also includes Wednesday’s CPI report and Friday's retail sales figures. These indicators will be closely watched by market participants as they assess the potential for further rate cuts from the BoE. The BoE has been grappling with a split within its Monetary Policy Committee, with some members extended easing to counter slowing economy, while others advocate a more cautious approach.
Technically, there is prospect for a strong rebound in GBP/USD from 1.3000 cluster support level. Break of 1.3174 resistance will retain near term bullishness, and bring retest of 1.3433 high. However, sustained break of 1.3000 will raise the chance of bearish trend reversal, and bring deeper decline towards next structural support at 1.2664.
In Europe, at the time of writing, FTSE is up 0.11%. DAX is up 0.37%. CAC is down -0.16%. UK 10-year yield is up 0.0440 at 4.251. Germany 10-year yield is up 0.014 at 2.281. Earlier in Asia, Japan was on holiday. Hong Kong HSI fell -0.75%. China Shanghai SSE rose 2.07%. Singapore Strait Times rose 0.62%.
China's Export Growth Slows Sharply, Misses Expectations
China's export and import data for September painted a weaker-than-expected picture of the nation's trade performance. Exports grew by just 2.4% yoy to USD 303.7B, well below expectations of 6.0% yoy and down from the 8.7% yoy rise in the previous month. Imports edged up a modest 0.3% yoy to USD 222B, missing expectations of 0.9% yoy increase and lower than August's 0.5% yoy rise. Trade surplus narrowed to USD 81.7B, smaller than the expected USD 89.8B and down from USD 91.0B in August.
Breaking down the data by region, exports to the US, China’s largest trading partner, rose by 2.2% yoy, while imports saw a stronger 6.7% yoy growth. Trade with ASEAN remained more robust, with exports up 5.5% yoy and imports climbing 4.2%yoy. However, exports to the EU edged up by only 1.3%, while imports from the bloc fell by -4% yoy. Trade with Russia was mixed, with exports surging by 16.6% yoy, but imports declining by -8.4% yoy.
Customs spokesman Lu Daliang attributed the weaker export growth to “short-term incidental factors,” including frequent typhoons in key port cities, a high base from last year, and ongoing global shipping congestion. Lu noted that the peak export season for some Chinese products typically seen in Q3 had been moved forward by more than a month this year due to the shipping delays.
New Zealand BNZ services unchanged at 457, stuck in contraction
New Zealand's BusinessNZ Performance of Services Index was unchanged at 45.7 in September, marking the seventh consecutive month in contraction and remaining well below the long-term average of 53.1.
Katherine Rich, CEO of BusinessNZ, noted that the services sector appears to be "stuck in a rut" and is struggling to get out of contraction.
The detailed data reflects mixed performance across key components. While activity/sales edged slightly higher from 44.3 to 45.6, employment saw a sharp decline, dropping from 49.4 to 45.7—reflecting further weakness in job creation. New orders/business also ticked down marginally from 46.9 to 46.7, while supplier deliveries dipped further to 43.2 from 43.5.
One small positive came from a reduction in the proportion of negative comments from respondents, which fell to 58.5% in September, compared to 60.8% in August and 67.0% in June and July. However, a significant number of businesses still cited the broader economic environment as a key negative factor impacting their performance.
USD/JPY Mid-Day Outlook
Daily Pivots: (S1) 148.58; (P) 148.94; (R1) 149.46; More...
USD/JPY's rise from 139.57 resumed after brief consolidations and intraday bias is back on the upside, This rally is seen as the second leg of the corrective pattern from 161.94, and should target 61.8% retracement of 161.94 to 139.57 at 153.39 next. On the downside, below 148.25 minor support will turn intraday bias neutral again first.
In the bigger picture, price actions from 161.94 are seen as a corrective pattern to rise from 102.58 (2021 low). The range of medium term consolidation should now be set between 38.2% retracement of 102.58 to 161.94 at 139.26 and 161.94. Nevertheless, sustained break of 139.26 would open up deeper medium term decline to 61.8% retracement at 125.25.
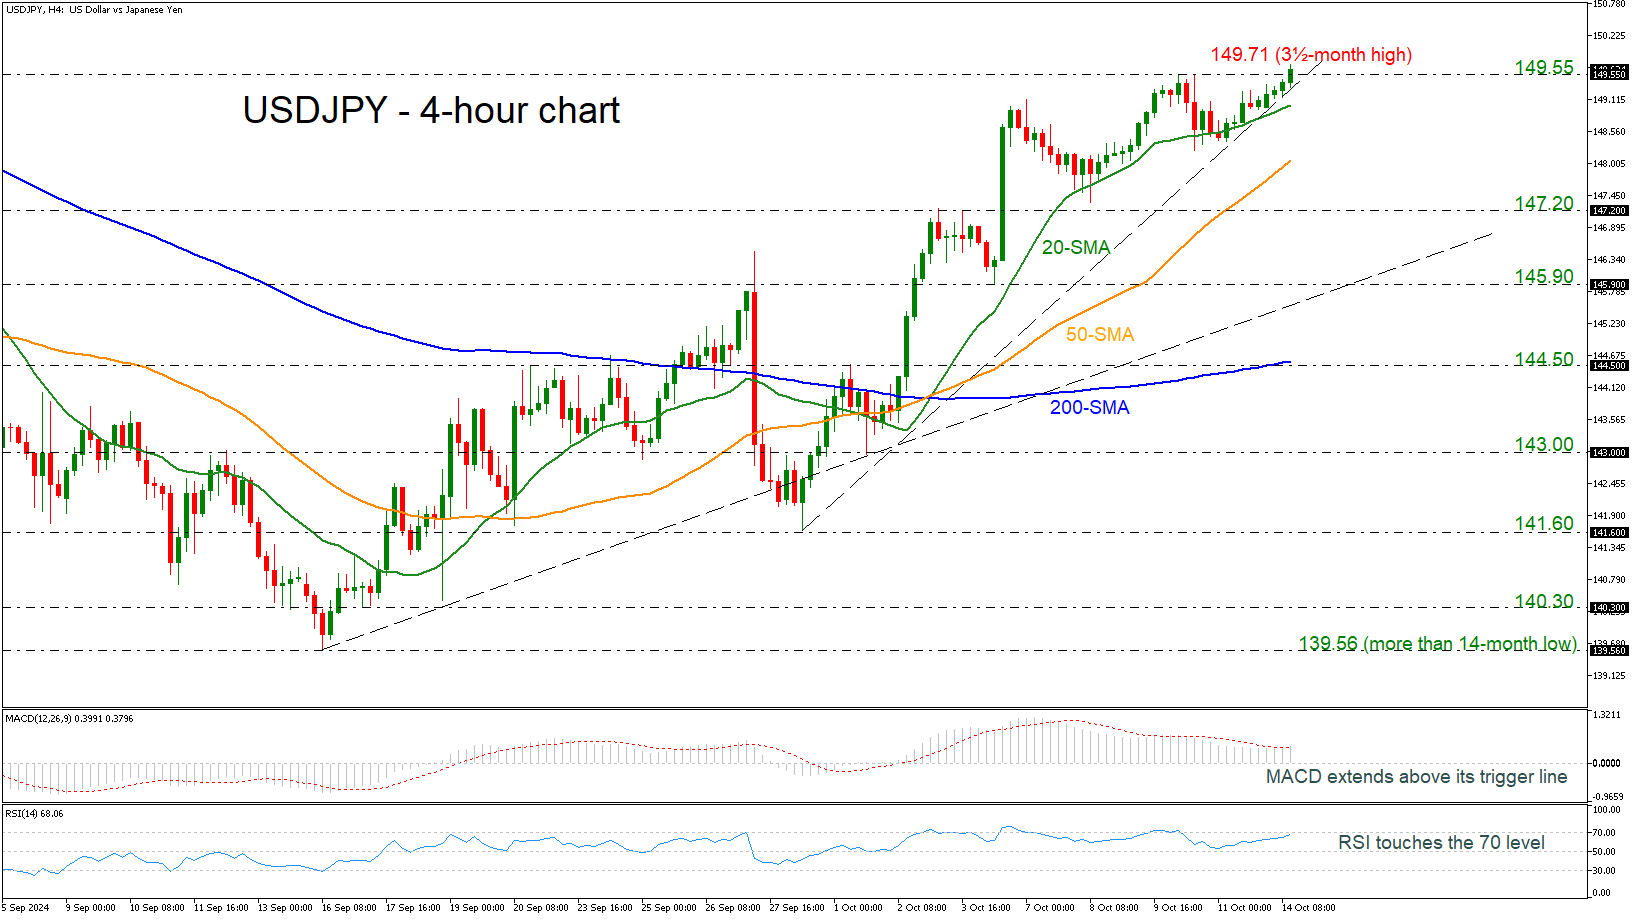
USDJPY Tests New 3½-Month High
- USDJPY makes an attempt for steeper bullish actions
- MACD and RSI confirm upside momentum
USDJPY is rising towards a fresh three-and-half-month high of 149.71, posting the fifth consecutive green 4-hour session. The next strong battle likely awaits at the 150.00 psychological level, but the next resistance lies at the 151.90 level, taken from the inside swing low on July 25. But first, the price needs to overcome the 200-day simple moving average (SMA), which is at 151.20.
Otherwise, a decline beneath the steep short-term uptrend line and the 20-period SMA at 149.00 could take the bears until the 50-period SMA at 148.05. Even lower, traders may flirt with the 147.20 support level before returning to the medium-term ascending line at 145.90.
Technical oscillators show some bullish signs. The MACD is extending its positive momentum above its trigger and zero lines, while the RSI is heading north near the 70 level.
All in all, USDJPY is creating a notable upside movement, trying to endorse the short-term bullish structure. A fall beneath the 200-period SMA at 144.50 could switch the outlook to negative.
ECB to Cut Rates Despite Plethora of Reasons for a Pause
- ECB meets on Thursday; markets expect a 25bps rate cut
- Lots of reasons for a pause, including the lack of staff projections
- But the ECB might choose to avoid disappointing the markets
- The euro could really benefit from a rate pause
ECB meets on Thursday
The ECB will hold its penultimate meeting for 2024 on Thursday, just five weeks after the September gathering that produced another rate cut. It has been an eventful period for the markets with the Fed announcing a 50bps rate cut and the conflict in the Middle East moving up a notch.
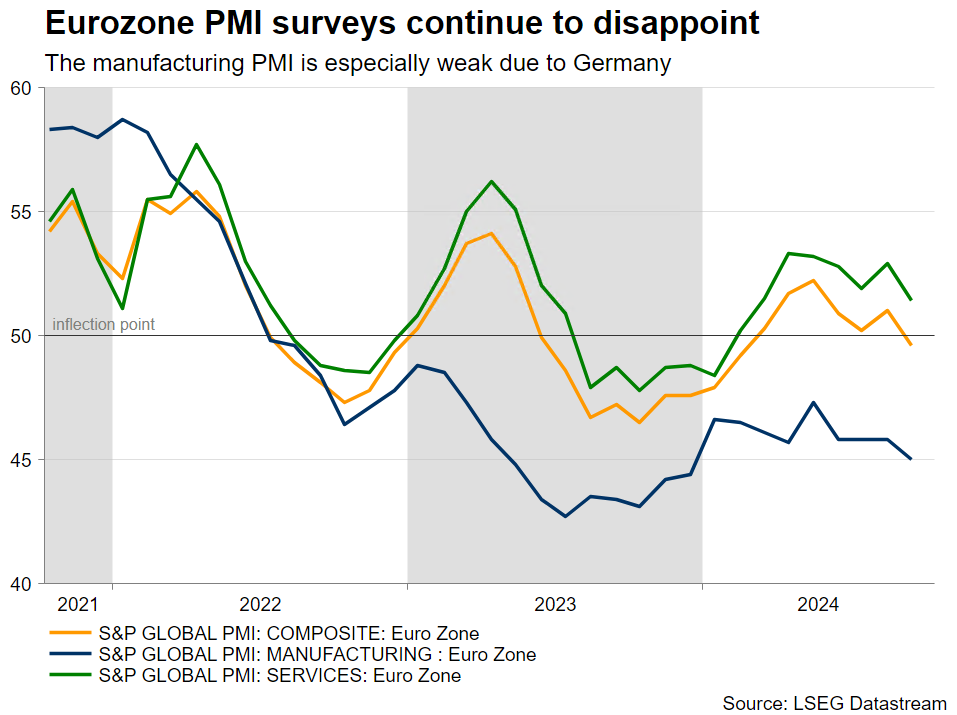
In the meantime, the eurozone data continued to worsen. Most notably, the September PMI surveys, predominantly the manufacturing ones, confirmed the rather protracted soft patch experienced by the euro area economy, particularly in Germany, and the September headline CPI figure dropped below 2% for the first time since July 2021.
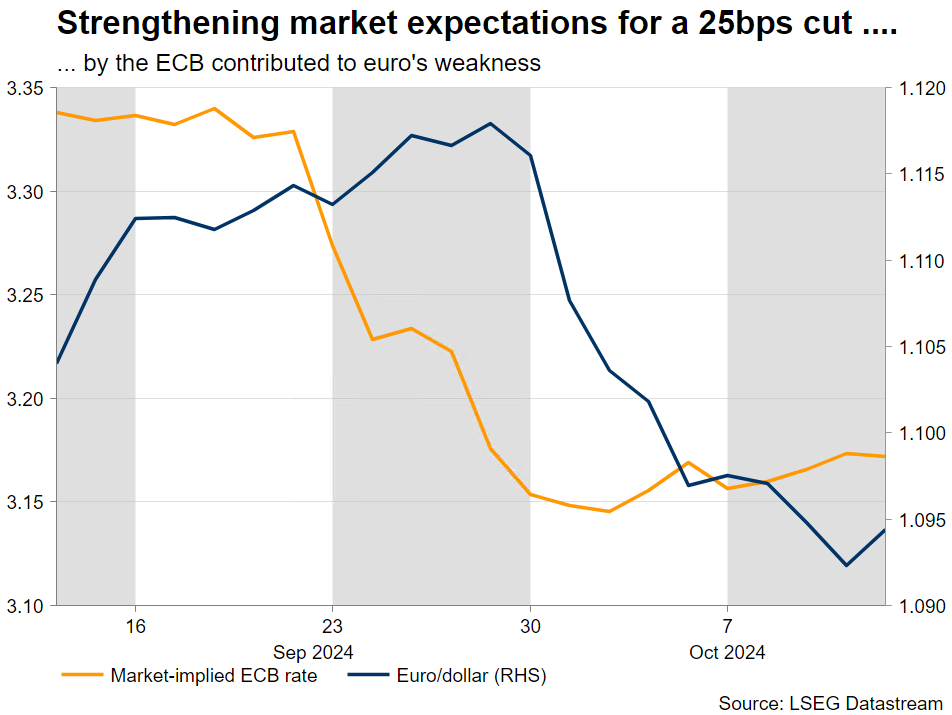
These developments, i.e. the aggressive Fed rate cut, the weak growth outlook and satisfaction from the euro area inflation prints, allowed most ECB members to move from vague comments about the need for further rate cuts to openly state their preference for an October move. The difference between the recently published minutes of the September meeting and the ECB members’ most recent rhetoric is quite telling.
This shift is also reflected in market expectations. The probability of an October 25bps cut was around 30% after the September gathering, but it quickly rose to fully price in this rate move. It is currently hovering around 99%, which, in the eyes of the market, makes this week’s rate cut a done deal.
Is the rate cut really a done deal?
Frankly, the September CPI report was not surprising, as President Lagarde had already announced that the ECB expects a weak print, with inflation rising again towards the end of 2024. Interestingly, there are no staff projections this time around, and considering the fact that the meeting comes only five weeks after the September one, some ECB members might be inclined to wait until December. Additionally, Thursday's gathering will take place in Ljubljana, Slovenia and the ECB usually, but not always, prefers to announce rate changes when the meeting is hosted at the ECB tower in Frankfurt.
This extra time until the December gathering is probably important for other reasons. The ECB could examine any likely Fed announcements on November 7, where the outlook is equally complicated following the recent strong jobs data, and digest the outcome of the US presidential election.
But the most important factor for pausing on Thursday might be that in September the ECB adjusted its rates profile. The deposit rate was cut by 25bps to 3.5%, but the gap with the main ECB rate dropped to 15bps from 50bps, with the latter dropping to 3.65% from 4.25% before the September gathering.
The market is convinced of the need of another rate cut
Despite the plethora of reasons for a pause, the ECB has to take tough decisions based on the incoming data and the overall economic outlook. It is obvious that the eurozone economy is barely growing with Germany officially expected to contract for a second year running, and with no help expected at this stage from China, which continues to face its own grave issues. Therefore, another 25bps rate cut could only prove beneficial for the eurozone economy.
At the end of the day, an agreement could provide a solution. The doves might begrudgingly accept a pause on Thursday in exchange for a strong pre-commitment for a 25bps rate cut in December, possibly more if needed.
The euro could suffer from a dovish rate cut
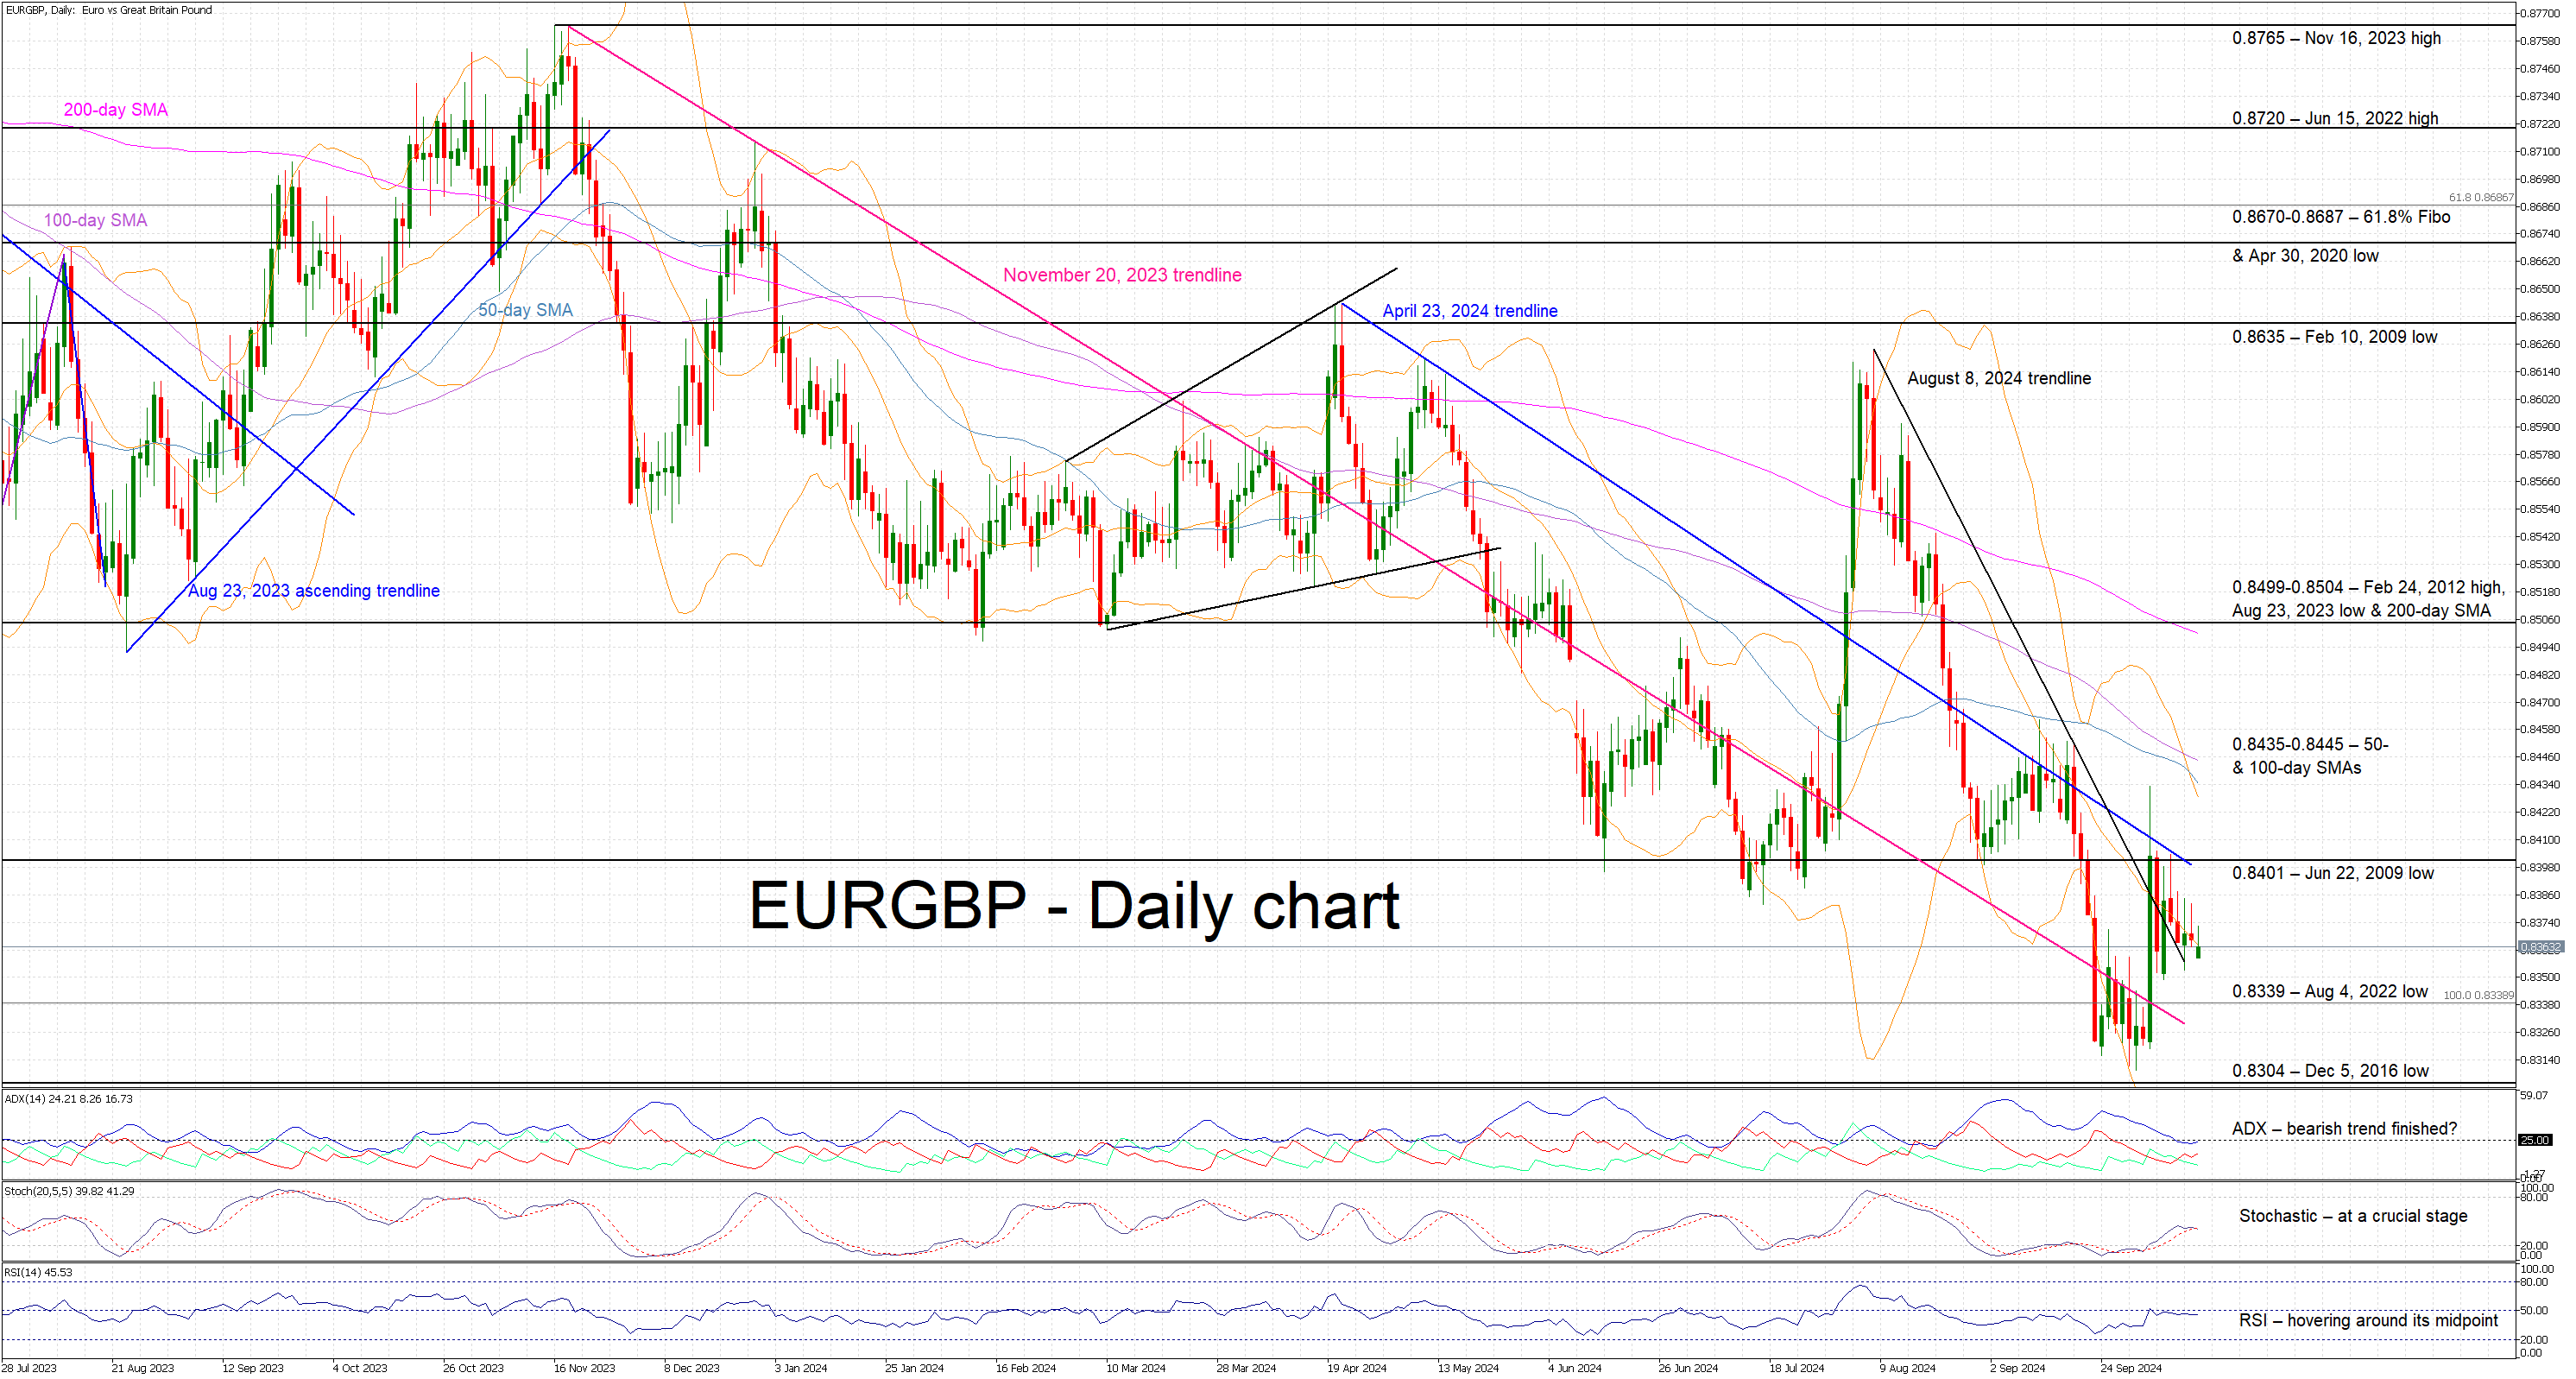
Despite the recent upleg in euro/pound, mostly on the back of the early October comments from Governor Bailey for a more aggressive BoE stance in terms of the rate cuts, the downward trend from the November 2023 high remains in place.
A dovish rate cut on Thursday will probably allow euro bears to overcome some key support levels and test again the 0.8304 level. On the flip side, a surprising rate pause could cause a sizeable upleg in euro/pound with the 0.8500 area looking like a plausible target.
Gold (XAU/USD) Price Outlook: China Sends Mixed Signals Keeping Gold Prices Steady
- Gold prices remain steady despite weak Chinese data, Risk-Off Start to the week.
- Market uncertainty and geopolitical tensions are supporting gold’s safe-haven appeal.
- Key support and resistance levels to watch are identified.
Gold prices held steady this morning as weak Chinese data renewed market concerns and led to a risk-off start to the week. The Chinese data is an interesting one where Gold is concerned, as the drop in exports could lead to fear that demand for Gold may fall from China while the risk-off mood benefits Gold thanks to its safe haven appeal.
Thus, following a n initial fall at market open, Gold bulls did push prices back toward the Friday highs above the $2660/oz handle. Following the reaction to last week’s US data, Gold bulls still appear to be dominant, this despite the prospect of less aggressive rate cuts from the Federal Reserve.
Market participants are now pricing in less than 50 bps of rate cuts from the Fed before the year is out. This begs the question, why are Gold prices still elevated?
I think a lot of this is down to the risk still prevalent in Global markets. The first being uncertainty around China and Global growth moving forward and the second obviously being the uncertainty around the geopolitical dynamics still at play. Markets are still holding out hope that the Chinese stimulus will be enough even though it is too early to tell.
These factors are keeping market participants on edge and thus the safe haven play remains supported.
Economic Data and Week Ahead
Markets may experience a thin session liquidity wise today as the US celebrates Columbus day. This could lead to some erratic price action for the precious metal as the DXY is also likely to play a role.
Federal Reserve policymakers are scheduled to speak today and markets will be paying attention to policymakers Waller and Kashkari for further dovish sentiments which should keep Gold prices bid heading into tomorrow.
The lack of high impact data this week from the US could see Gold dominated by overall market sentiment, geopolitics and Federal Reserve policymakers comments.
Technical Analysis Gold (XAU/USD)
From a technical analysis standpoint, Gold surprised with last weeks rally to break back above the psychological 2650 handle.
Looking at the four-hour chart (H4) chart below, the previous H4 candle closed as a shooting star hinting at further downside. My concern is that at present with such a bullish long and medium-term trend, any push to the downside may be limited. The only positive for bears is that the recent rally has failed to take out the precious metals all time highs around 2685, which was printed on September, 26.
Immediate support rests at the 2650 handle before the 100 day-AM and support level comes into focus around 2643-2640. A break of this level will open up a potential run toward the 2625 handle.
Conversely, a move higher from here will face resistance at 2670 before the all time highs at 2685 and the psychological 2700 handle comes into focus.
GOLD (XAU/USD) Four-Hour (H4) Chart, October 14, 2024
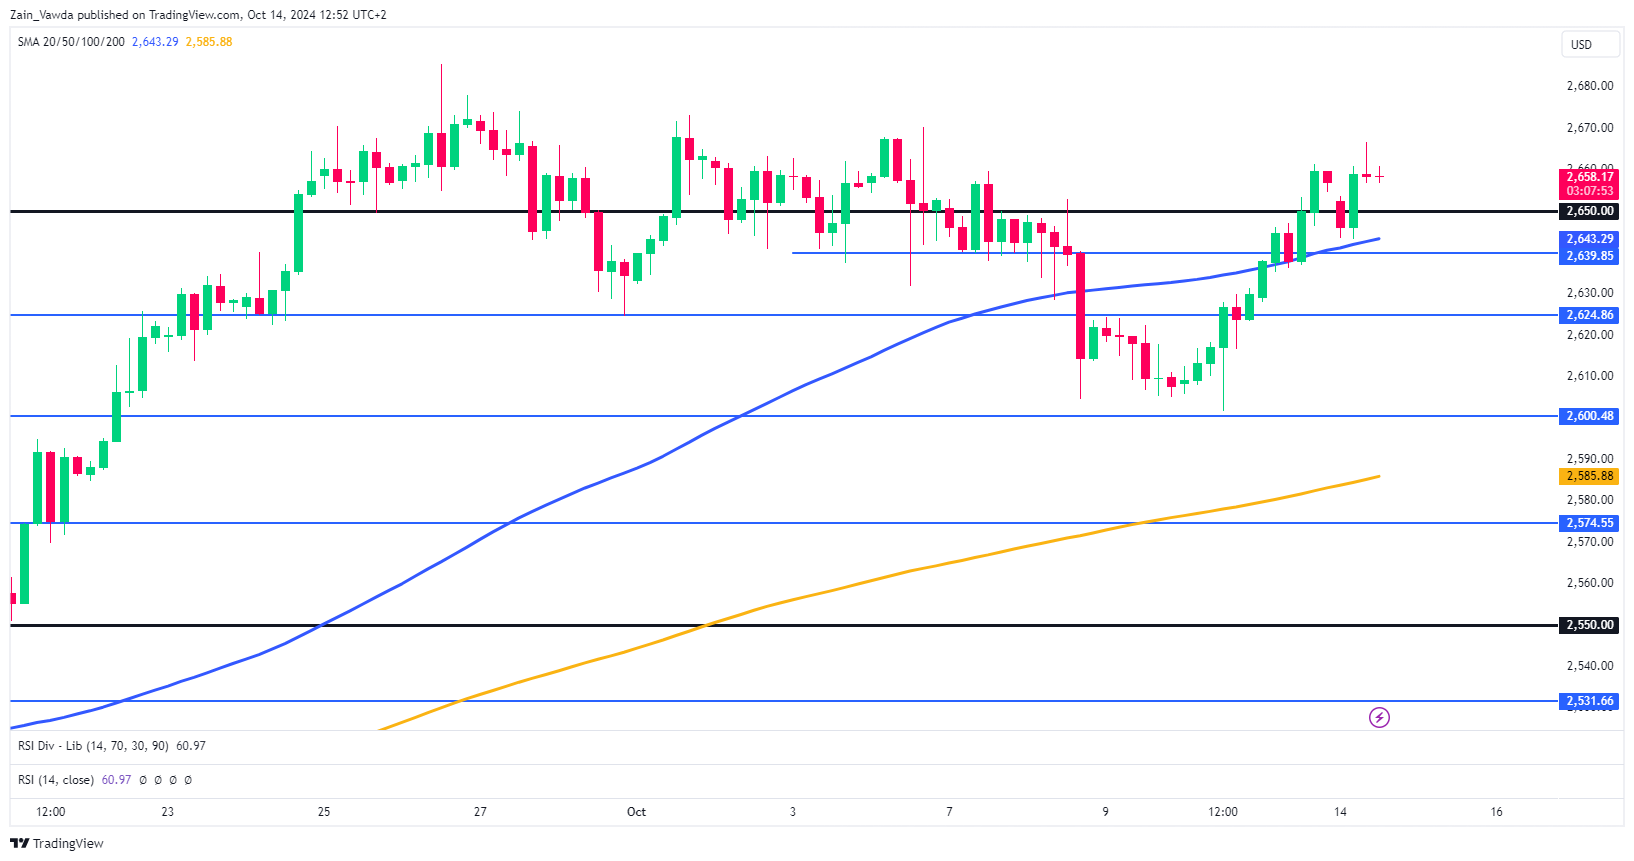
Source: TradingView (click to enlarge)
Support
- 2650
- 2640
- 2624
Resistance
- 2670
- 2685
- 2700
AUD/USD: Under Downside Pressure from China’s Weak Inflation
- China’s latest set of inflationary data for September increases the risk of a deflationary spiral being entrenched.
- China policymakers continued to use rhetoric to push out new fiscal stimulus policies but lacked details in terms of the amount and scope of implementation.
- An erosion of confidence in China’s policymaking process may trigger a negative feedback loop into the AUD/USD.
Since our last publication, the AUD/USD has managed to shape a push-up from its 11 September low of 0.6622 (close to the 200-day moving average support at 0.6600) and hit the 0.6900 key medium-term pivotal resistance before it reversed down from an intraday high of 0.6943 printed on 30 September.
In the recent two weeks, the AUD/USD slipped by -3.3% which saw a low of 0.6701 on last Thursday, 10 October. Its renewed weakness has been indirectly linked to the fortunes of the Chinese economy via the demand propensity for industrial-related commodities such as iron ore which is Australia’s key export to China.
Still no clear and specific amount of fresh fiscal stimulus from China
On 26 September, China’s top leadership decision-making body, the Politburo issued a “strongly worded” message in its press statement with the promise of more stimulus measures to stop the beleaguered real estate market from declining further.
It has led market participants to highly anticipate a fresh round of fiscal stimulus measures amounting to two to three trillion yuan to be announced after the Golden Week national day holidays.
However, both the press briefings of National Development and Reform on Tuesday, 8 October, and the Ministry of Finance on Saturday, 12 October were lukewarm in terms of meeting expectations as they lacked details and scope without any specific fresh fiscal stimulus amount being announced and focused instead of using rhetoric messaging as forward guidance.
The deflationary risk spiral persists
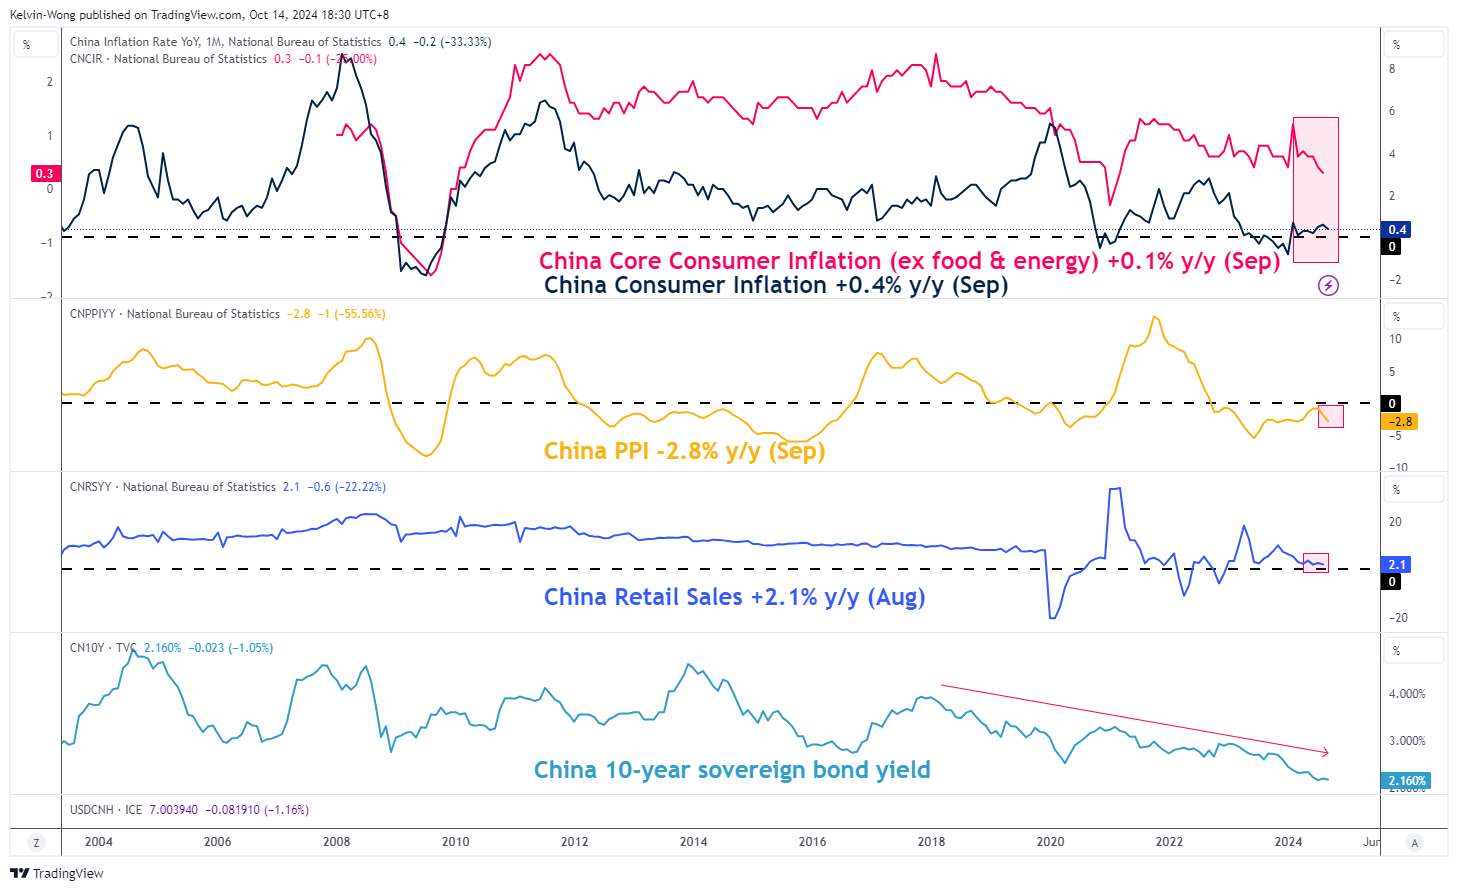
Fig 1: China consumer inflation & PPI trends as of Sep 2024 (Source: TradingView, click to enlarge chart)
The headline consumer inflation rate for China has slipped down further to a three-month low of 0.4% y/y in September, below the consensus and August’s print of 0.6%.
The core consumer inflation (excluding food and energy) has decelerated by a higher magnitude to 0.1% y/y in September from 0.3% in August, its lowest level since February 2021 (see Fig 1).
PPI (factory gate prices) decelerated to -2.8% y/y in September from -1.8% in August, the sharpest contraction since March.
All in all, the window is closing to negate this set of persistent internal demand-led weaknesses inherent in the China economy through the actual implementation of fresh fiscal stimulus measures that boast consumer confidence directly rather than just “morale boasting” rhetoric messaging.
Lacking a new set of fresh fiscal stimulus, market participants are likely to lose patience and their collective behavior may morph into a bandwagon of “negative animal spirits” that may drive down the prices of tradeable instruments that have a significant correlation with the health of Chinese economy such as the Aussie dollar.
0.6700 key near-term support to watch on AUD/USD
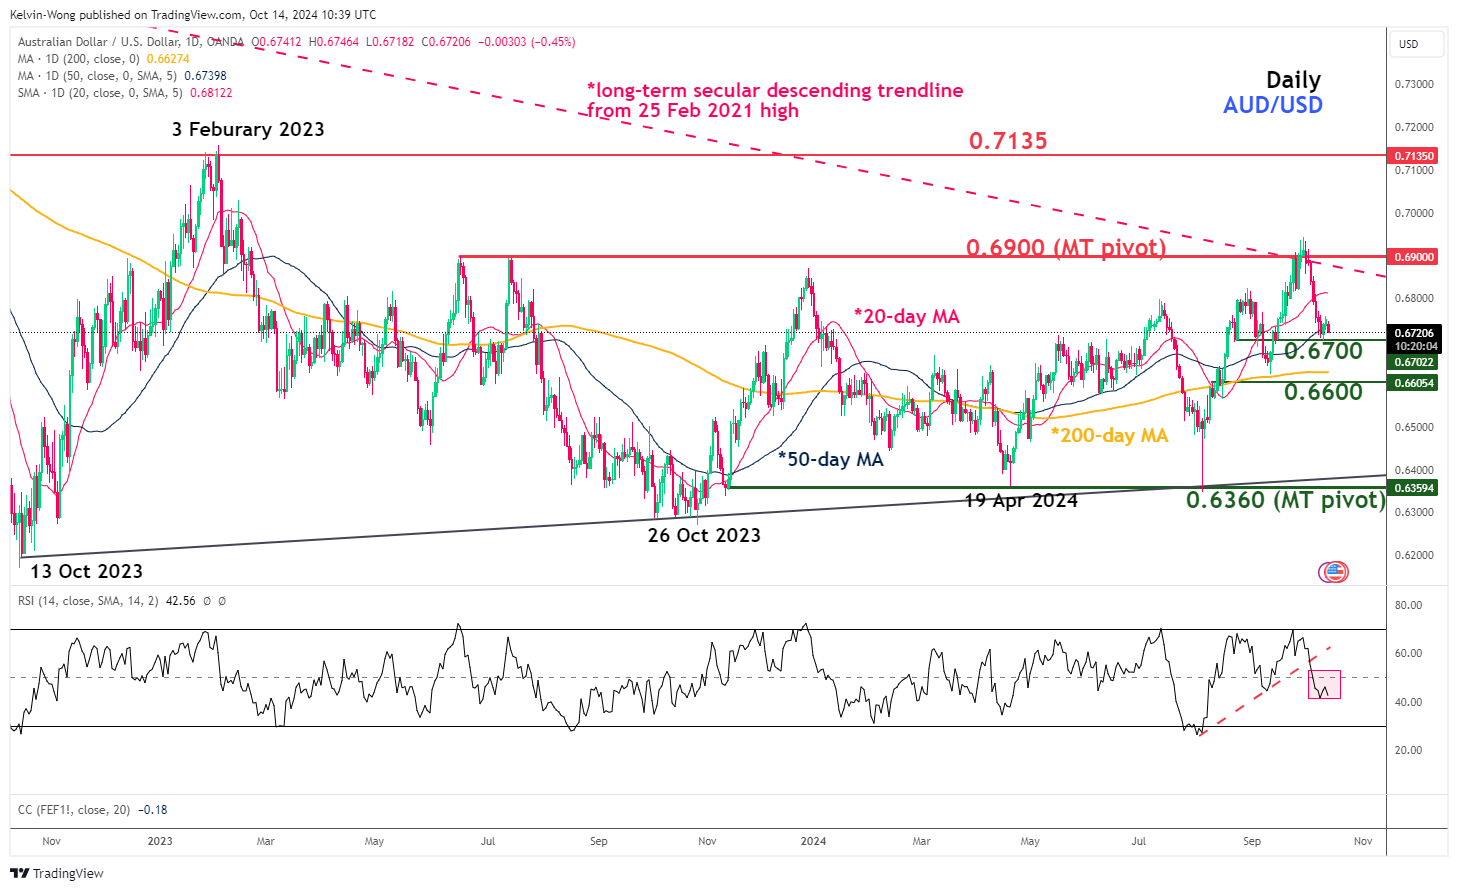
Fig 2: AUD/USD medium-term trend as of 14 Oct 2024 (Source: TradingView, click to enlarge chart)
In the past week, the price actions of AUD/USD have been hovering precariously around the 0.6700 key near-term support (see Fig 2).
The daily RSI momentum indicator has staged a bearish breakdown below the 50 level and a parallel ascending trendline from its 2 August oversold reading. These observations suggest that medium-term bearish momentum has resurfaced which increases the odds of a breakdown below 0.6700.
Failure to hold at 0.6700 exposes the next support at 0.6600 (close to the 200-day moving average), and a daily close below 0.6600 may see a deeper correction towards the medium-term range support at 0.6360.
On the other hand, a clearance above 0.6900 key medium-term pivotal resistance negates the bearish bias for a test on the next medium-term resistance at 0.7135 (swing highs of 11 August 2022 and 3 February 2023).
EUR/USD Experiences Downward Pressure Amid Fed Rate Cut Speculations
EUR/USD has seen a slight downturn, correcting near the support level of 1.0905 as the market adjusts its expectations regarding the Federal Reserve's monetary policy. The probability of a 25-basis-point rate cut by the Fed in November currently stands at 86.8%, reflecting a cautious outlook for significant further easing this year.
Economic data from Germany showed a current account surplus of 14.4 billion euros in August 2024, marking the smallest surplus since May 2023 and falling short of analysts' expectations of 19.9 billion euros. This decrease was most notable in the goods segment, highlighting potential vulnerabilities in Europe's largest economy.
In the US, the University of Michigan's preliminary Consumer Confidence Index for October dropped to 68.9 points from 70.1 in September, a five-month high. This decline was contrary to expectations of an increase to 71.9 points. The year-on-year comparison also illustrates consumer concerns about high prices, as the index has risen from 63.8 in October 2023.
Technical analysis of EUR/USD
The EUR/USD pair has completed a downward movement to 1.0890, followed by a growth impulse to 1.0953 and a correction to 1.0926. A consolidation range is now forming around 1.0926. A break below this range could extend the decline to 1.0898. Conversely, an upward break could initiate a corrective move to 1.0995, potentially followed by another downward wave towards 1.0777. The MACD indicator supports this scenario, as it is below zero but starting to show signs of upward movement, indicating the potential for short-term bullish corrections within a broader bearish trend.
On the hourly chart, after achieving a high of 1.0953, the market underwent a correction to 1.0925. It has since broken below 1.0926, indicating a possible extension of the consolidation range towards 1.0898. Upon reaching this level, a retest of 1.0926 from below might occur, followed by a corrective rise to 1.0995. The Stochastic oscillator, positioned above 50 and poised to drop towards 20, suggests that short-term declines may occur before any potential recovery.