
Sample Category Title
UK payrolled employment falls -15k in Sep, unemployment rate dips to 4% in Aug
In September, UK payrolled employment decreased -15k or -0.0% mom, but increased by 113k or 0.4% yoy, to 30.3m. Median monthly pay rose 5.3% yoy, down from prior 6.0% yoy, but stays well above June's 3.8% yoy. Claimant count rose 27.9k to 1.797m, above expectation of 20.2k.
In the three months to August, unemployment rate fell from 4.1% to 4.0%, below expectation of 4.0%. Average regular earnings excluding bonuses rose 4.9% yoy, down from prior 5.1% yoy, below expectation of 5.0% yoy. Average regular earnings including bonuses rose 3.8% yoy, down from prior 4.0% yoy, matched expectations.

USD/CAD Daily Outlook
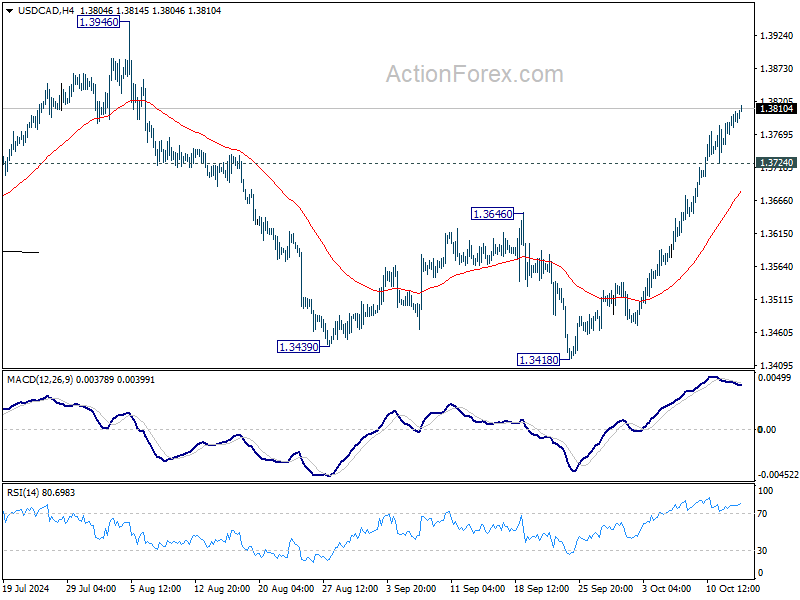
Daily Pivots: (S1) 1.3768; (P) 1.3786; (R1) 1.3816; More...
USD/CAD's rally from 1.3418 is in progress and intraday bias remains on the upside, As noted before, corrective fall from 1.3946 should have completed at 1.3418 already. Further rally should be seen towards this resistance. On the downside, below 1.3724 minor support will turn intraday bias neutral first.
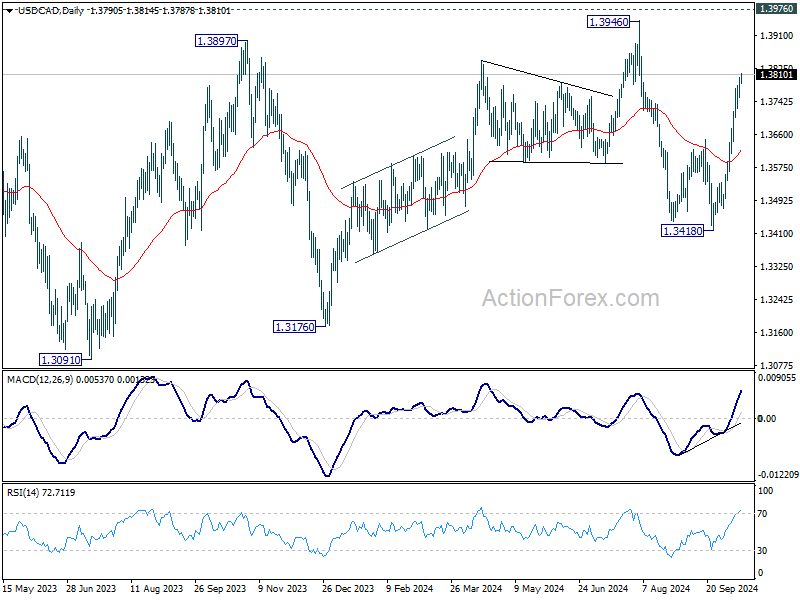
In the bigger picture, sideway consolidation pattern from 1.3976 (2022 high) might still extend further. While another decline cannot be ruled out, strong support should emerge above 1.2947 resistance turned support to bring rebound. Rise from 1.2005 (2021 low) is still in favor to resume at a later stage.
AUD/USD Daily Report
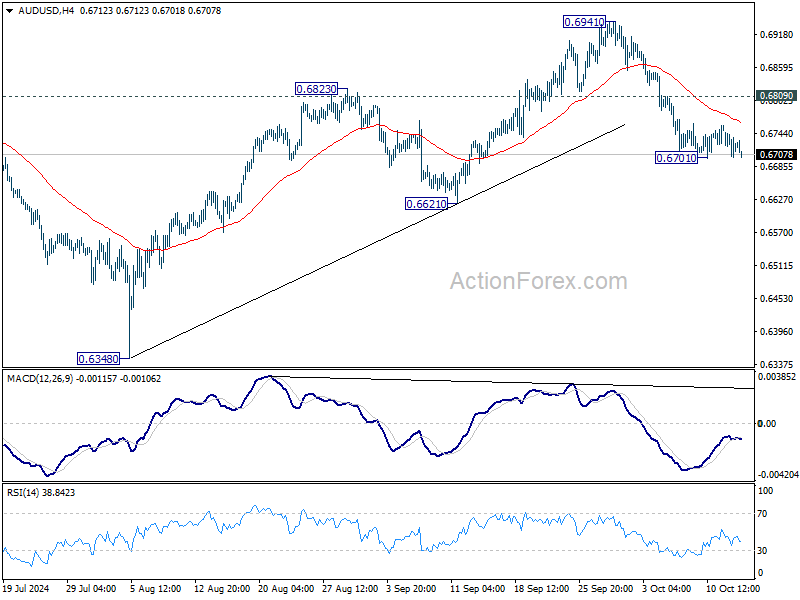
Daily Pivots: (S1) 0.6703; (P) 0.6725; (R1) 0.6747; More...
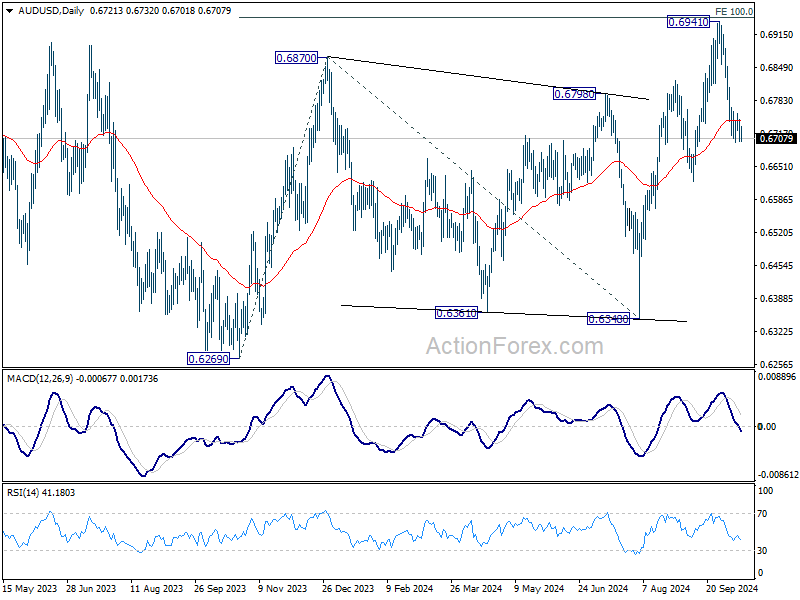
AUD/USD is staying in consolidation above 0.6701 temporary low and intraday bias stays neutral. Further decline is expected as long as 0.6809 minor resistance holds. On the downside, break of 0.6701 and sustained trading below 55 D EMA (now at 0.6743) should confirm rejection by 0.6941 fibonacci level. Intraday bias will be back on the downside for 0.6621 support next. On the upside, however, break of 0.6809 minor resistance will bring retest of 0.6941 high instead.
In the bigger picture, overall, price actions from 0.6169 (2022 low) are seen as a medium term corrective pattern, with rise from 0.6269 as the third leg. Firm break of 100% projection of 0.6269 to 0.6870 from 0.6340 at 0.6941 will target 138.2% projection at 0.7179. However, break of 0.6621 support will argue that rise from 0.6269 has completed and bring deeper fall back to 0.6269/6348 support zone.
USD/JPY Daily Outlook
Daily Pivots: (S1) 149.20; (P) 149.59; (R1) 150.15; More...
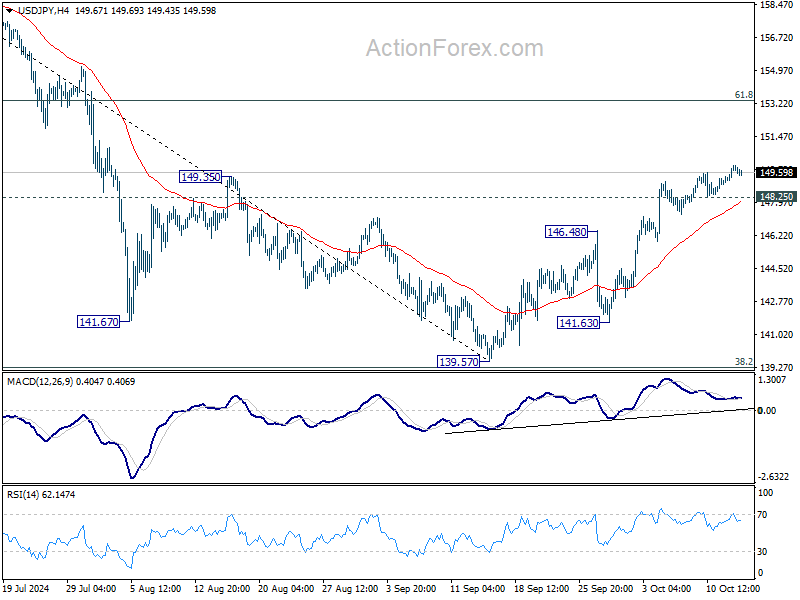
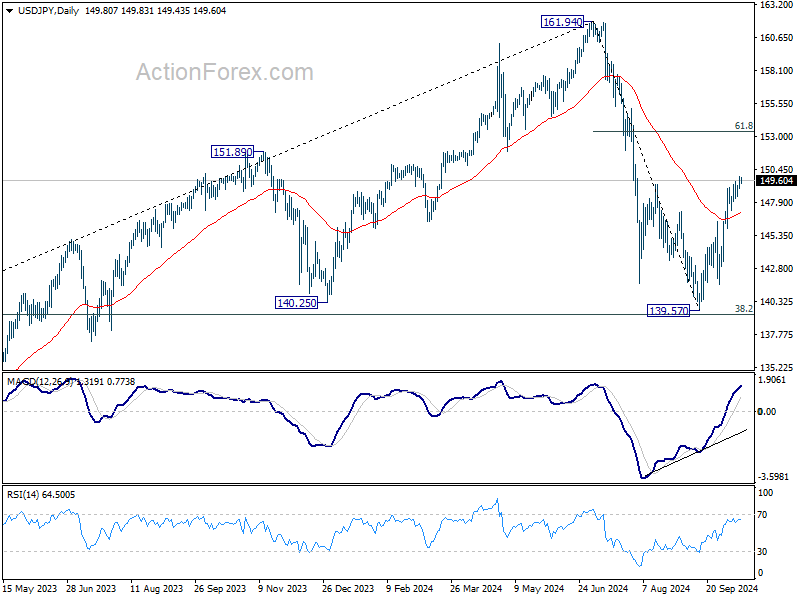
Intraday bias in USD/JPY stays on the upside as rise from 139.57 is in progress. This rally is seen as the second leg of the corrective pattern from 161.94, and should target 61.8% retracement of 161.94 to 139.57 at 153.39 next. On the downside, below 148.25 minor support will turn intraday bias neutral again first.
In the bigger picture, price actions from 161.94 are seen as a corrective pattern to rise from 102.58 (2021 low). The range of medium term consolidation should now be set between 38.2% retracement of 102.58 to 161.94 at 139.26 and 161.94. Nevertheless, sustained break of 139.26 would open up deeper medium term decline to 61.8% retracement at 125.25.
USD/CHF Daily Outlook
Daily Pivots: (S1) 0.8583; (P) 0.8612; (R1) 0.8655; More…
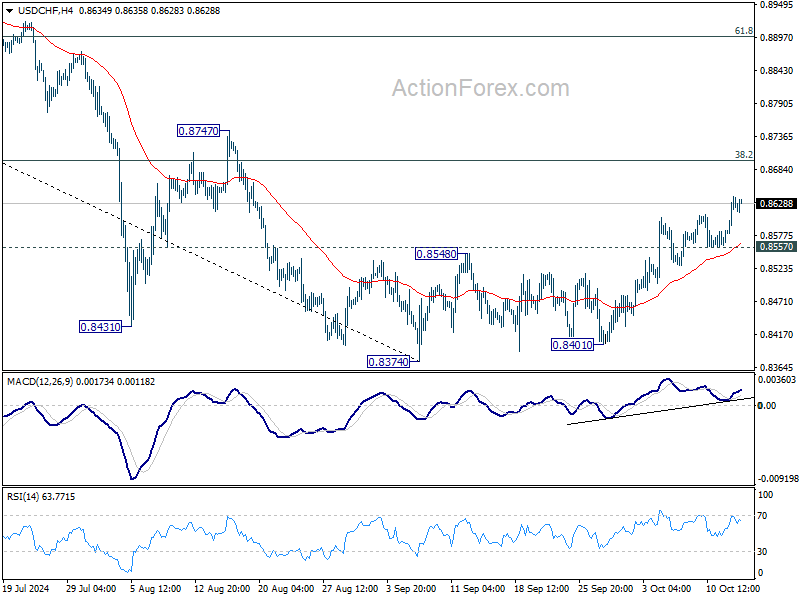
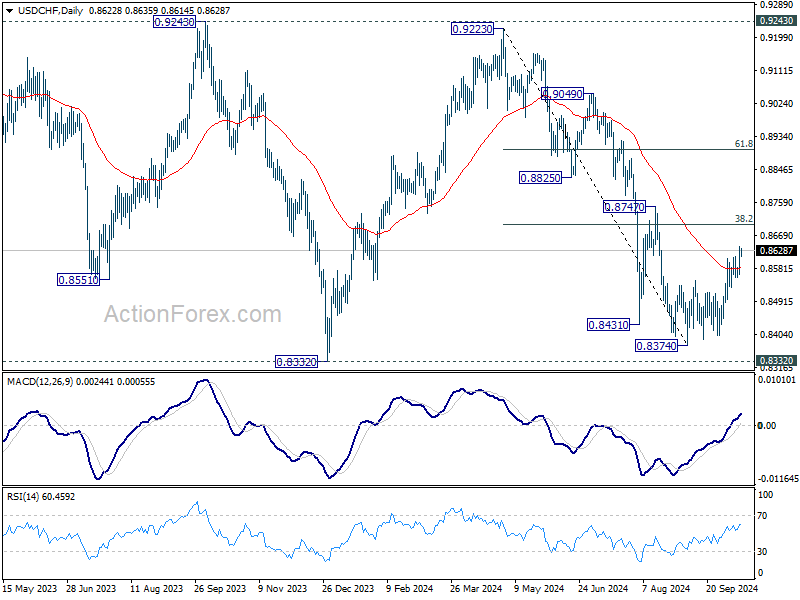
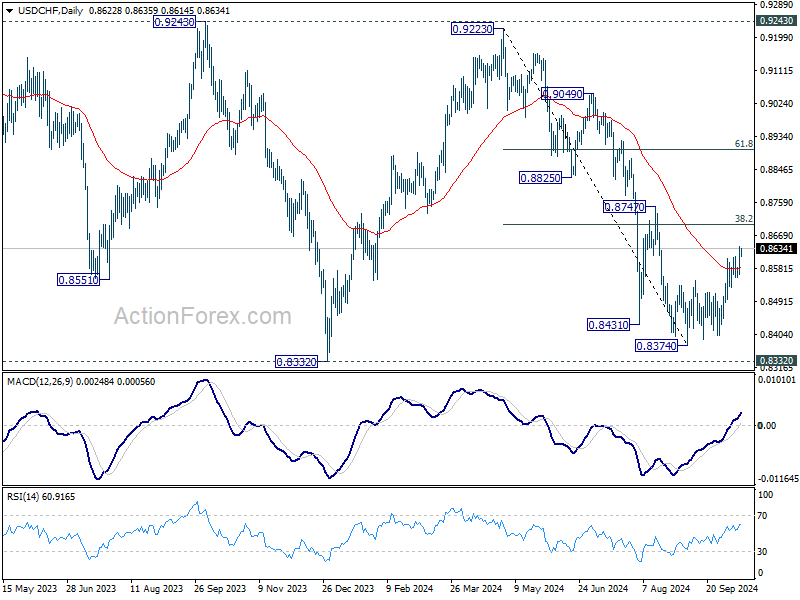
Intraday bias in USD/CHF remains on the upside for the moment. Rise from 0.8374 short term bottom is in progress for 38.2% retracement of 0.9223 to 0.8374 at 0.8698. Sustained break there will argue that fall from 0.9223 has completed after defending 0.8332 low. Further rally should be seen to 61.8% retracement at 0.8899 next. On the downside, below 0.8557 minor support will turn intraday bias neutral again first.
In the bigger picture, price actions from 0.8332 (2023 low) are currently seen as a medium term corrective pattern, with fall from 0.9223 as the second leg. Strong support could be seen from 0.8332 to bring rebound. Yet, overall outlook will continue to stay bearish as long as 0.9243 resistance holds. Firm break of 0.8332, however, will resume larger down trend from 1.0146 (2022 high).
EUR/USD Daily Outlook
Daily Pivots: (S1) 1.0886; (P) 1.0911; (R1) 1.0935; More....
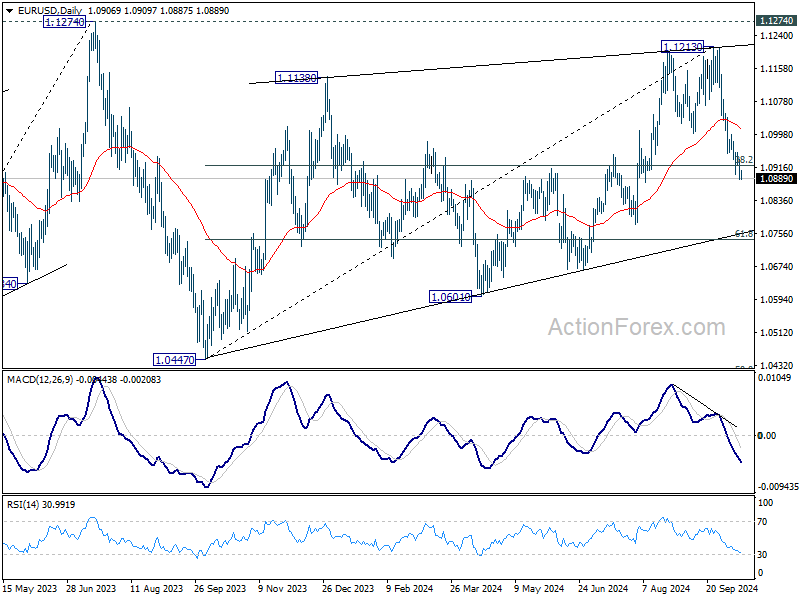
EUR/USD's fall from 1.1213 resumed after brief consolidations and intraday bias is back on the downside. Sustained trading below 38.2% retracement of 1.0447 to 1.1213 at 1.0920 will argue that fall from 1.1213 is the third leg of the corrective pattern from 1.1274. In this case, deeper decline would be seen to 61.8% retracement at 1.0740 next. On the upside, above 1.0953 minor resistance will turn intraday bias neutral again first.
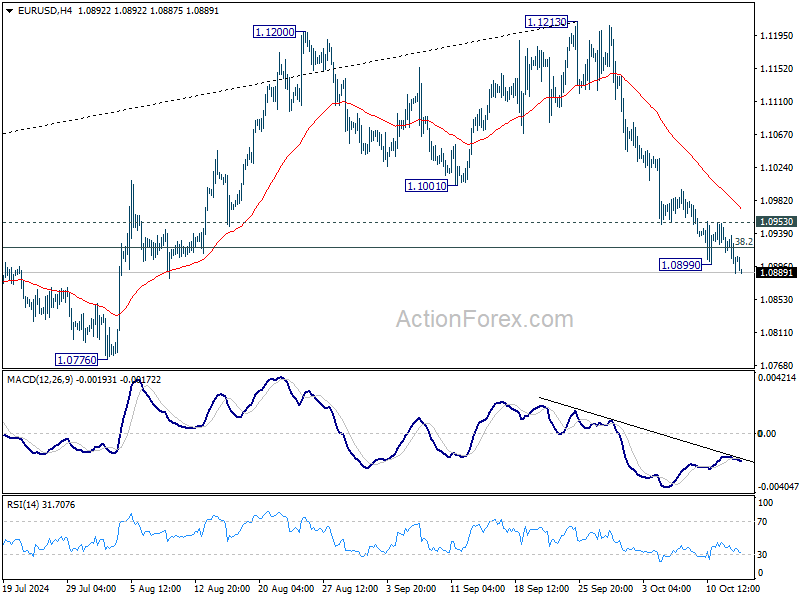
In the bigger picture, rejection by 1.1274 resistance suggests that corrective pattern from 1.1274 (2023 high) is not completed yet. Instead, decline from 1.1213 might be another falling leg. Sustained break of 55 W EMA (now at 1.0877) will validate this case, and bring deeper fall towards 1.0447 support again.
GBP/USD Daily Outlook
Daily Pivots: (S1) 1.3035; (P) 1.3054; (R1) 1.3077; More...
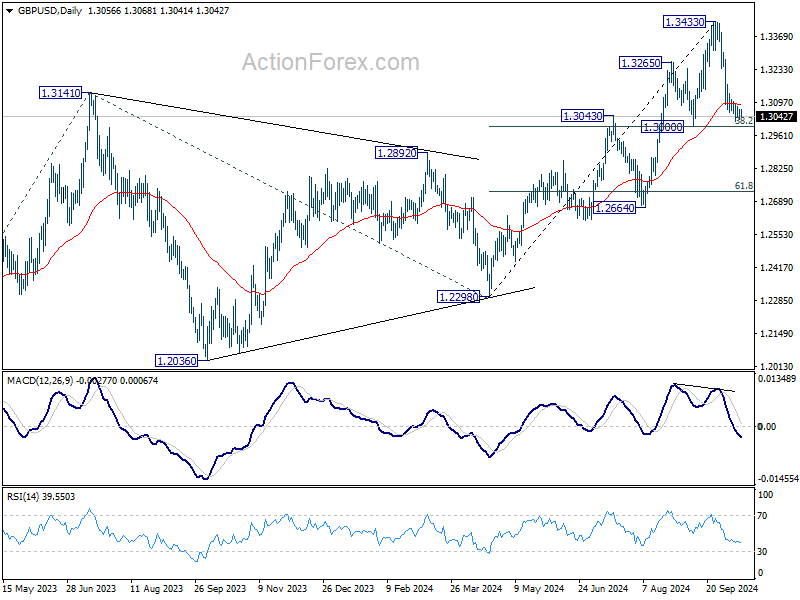
Outlook in GBP/USD remains unchanged and intraday bias stays neutral first. Strong support should be seen from 1.3000 cluster support (38.2% retracement of 1.2298 to 1.3433 at 1.2999) to complete the correction from 1.3433. On the upside, break of 1.3174 minor resistance will turn bias back to the upside for retesting 1.3433. However, sustained break of 1.3000 will carry larger bearish implications and target 61.8% retracement at 1.2732.
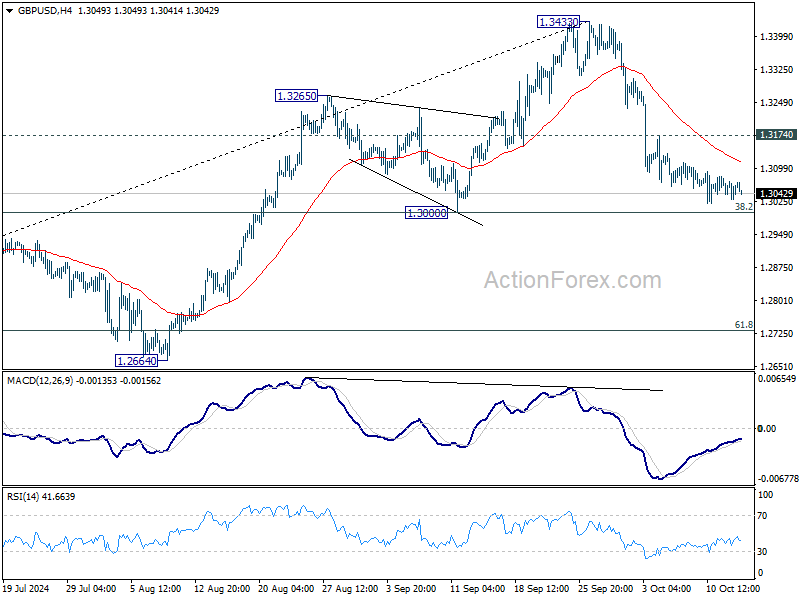
In the bigger picture, as long as 1.3000 support holds, the up trend from 1.0351 (2022 low) is still in progress. Next target is 61.8% projection of 1.0351 to 1.3141 from 1.2298 at 1.4022. However, considering mild bearish divergence condition in D MACD, decisive break of 1.3000 will argue that a medium term top is already in place, and bring deeper fall back to 1.2664 support next.
Dollar Gains Amid Mixed Sentiment, Nikkei Soars Follow US, While China Struggles
Risk sentiment in Asia was mixed today. Japan's Nikkei 225 index extended its rally and broke above the 40k mark for the first time in three months. This momentum firstly follows another record close on Wall Street overnight. Secondly, contributing to the optimism are growing expectations that BoJ may hold off on implementing another rate hike by the end of the year. The latest Reuters poll indicates that a slim majority—25 out of 49 economists surveyed—expect BoJ to maintain its current policy rate at 0.25% through December. Nevertheless, tightening is going to continue, with 87% of respondents, or 39 out of 45, anticipate a rate increase to 0.50% by the end of Q1 next year.
In contrast, equities in Hong Kong and mainland China are struggling. Unconfirmed media reports suggest that China might raise an additional CNY 6 trillion (approximately USD 820 billion) through treasury bonds over the next three years to bolster its slowing economy with fiscal stimulus. The proposed funds are intended to assist local governments in resolving off-the-books debts. However, the absence of official confirmation has left investors uneasy. Investors are clearly dissatisfied with the lack of concrete information, causing hesitation in committing to positions in Chinese assets.
In the currency markets, Dollar remains the strongest performer so far this week, although its momentum is moderate. Notably, USD/JPY pair is grappling with the psychological barrier at the 150 level. Traders are cautious that breaching this threshold could trigger intensified verbal intervention from Japanese authorities, aiming to prevent excessive Yen depreciation. British Pound is currently the second strongest, with market attention focused on this week's key UK economic data releases, starting with today's employment and wage growth figures. Canadian Dollar ranks third in strength, ahead of Canada's CPI release today. On the weaker side, Swiss Franc leads the decline, followed by Australian Dollar and New Zealand Dollar. Euro and Japanese Yen are occupying middle positions.
Technically, as USD/CHF's rebound from 0.8374 short term bottom extends, focus is now on 38.2% retracement of 0.9223 to 0.8374 at 0.8698. Sustained break there will argue that fall from 0.9223 has completed after defending 0.8332 low. The term trend should have reversed in this case, targeting 61.8% retracement at 0.8899 and above.
In Asia, at the time of writing, Nikkei is up 1.26%. Hong Kong HSI is down -1.55%. China Shanghai SSE is down -0.84%. Singapore Strait Times is up 0.30%. Japan 10-year JGB yield is up 0.0167 at 0.969.
Overnight, DOW rose 0.47%. S&P 500 rose 0.77%. NASDAQ rose 0.87%. 10-year yield rose 0.0250 to 4.098.
Fed’s Waller advocates for caution in policy easing amid solid economic conditions
In a speech overnight, Fed Governor Christopher Waller provided noted that recent economic data has been "uneven," with both positive signals and areas of concern, but emphasized that the US economy remains on "solid footing." Employment is near the Fed’s maximum objective, and inflation is approaching the target, despite some disappointing recent inflation figures.
In light of this, Waller expressed caution about the pace of monetary easing, noting that while the September 50bps cut was necessary, the Fed should now proceed with "more caution on the pace of rate cuts." He reaffirmed his view that the Fed would reduce the policy rate "gradually over the next year."
Looking ahead, Waller's baseline forecast still calls for a gradual reduction in the policy rate over the next year. However, he acknowledged uncertainty about the "final destination" for interest rates, with projections for the long-run federal funds rate varying significantly among Fed officials. The range extends from 2.4% to 3.8%, with the median estimate sitting at 2.9%.
While much of the market focus is on the size of rate cuts in the near term, Waller pointed out that the "larger message" from Fed’s economic projections is the extent of policy tightening that still needs to be reversed. If the economy continues its current stable performance, Waller expects that easing will occur gradually over time.
Cryptocurrencies surge amid optimism over US regulatory outlook post-election
Cryptocurrencies rallied overnight on growing optimism that regulatory environment for digital assets in the US may improve following the upcoming presidential election in November. This boost in sentiment was initially driven by a rise in Donald Trump's standing in prediction markets and some polls, as he is perceived to be more pro-crypto compared. Later, the market received another push after Kamala Harris’ campaign made supportive comments, pledging to support a regulatory framework for cryptocurrencies.
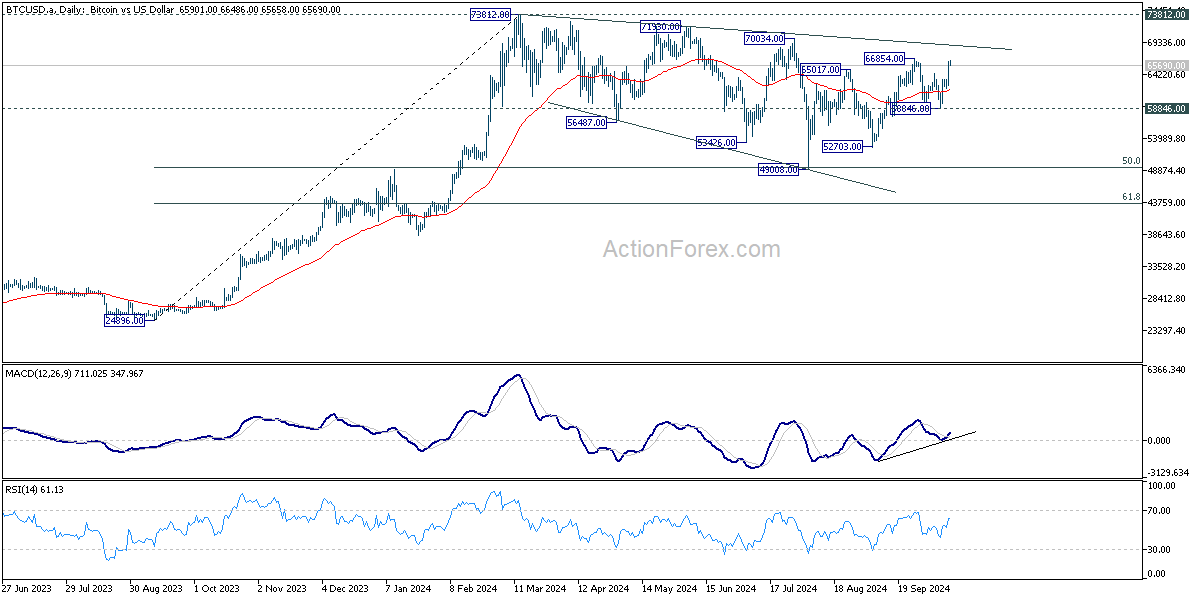
Technically, however, Bitcoin is still stuck in medium term consolidation pattern from 73012 (March high). The range is pretty much set between 50% retracement of 24896 to 37812 at 49354, i.e. between 49k and 74k in short.
Further near term rise is in favor as long as 58846 support holds. Break of 66854 will target a test on 73812 high. However, there is so far no indication of sustainable momentum through to new record.
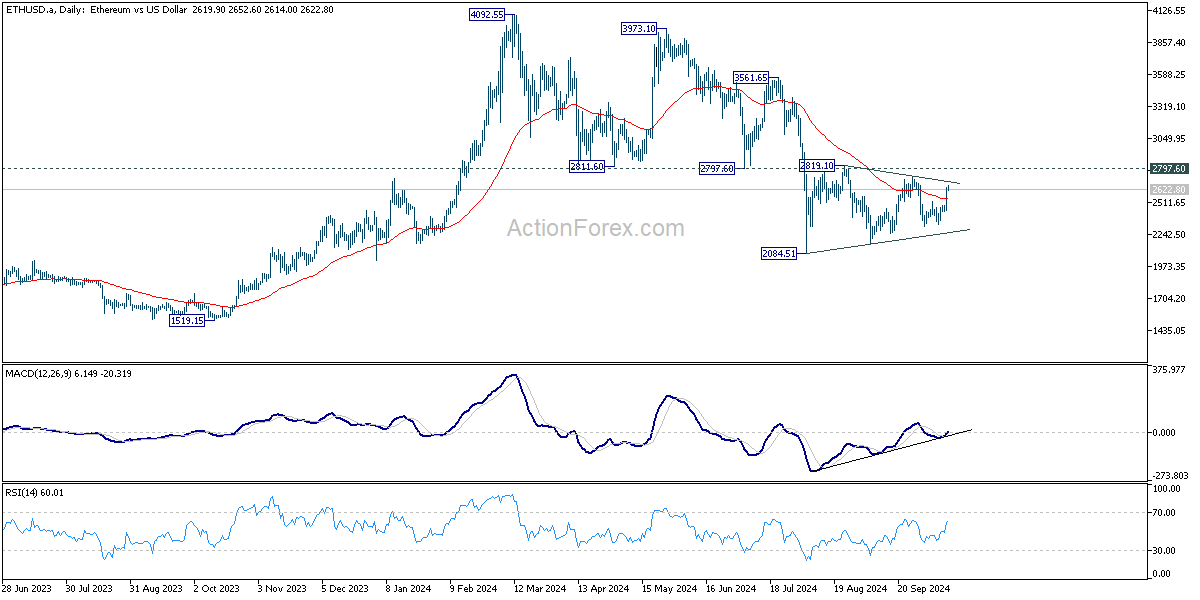
Ethereum's outlook is worse. Current bounce might be just a leg of the consolidation pattern from 2084.52 low. Further decline will remain in favor as long as 2797.60 resistance holds. Break of 20845.71 will resume the larger down trend from 4092.55 (March high).
Looking ahead
UK employment data is the main focus in European session. Germany will publish ZEW economic sentiment while Eurozone will release industrial production.
Later in the day, Canada CPI will take center stage while US Empire State manufacturing index will also be featured.
GBP/USD Daily Outlook
Daily Pivots: (S1) 1.3035; (P) 1.3054; (R1) 1.3077; More...
Outlook in GBP/USD remains unchanged and intraday bias stays neutral first. Strong support should be seen from 1.3000 cluster support (38.2% retracement of 1.2298 to 1.3433 at 1.2999) to complete the correction from 1.3433. On the upside, break of 1.3174 minor resistance will turn bias back to the upside for retesting 1.3433. However, sustained break of 1.3000 will carry larger bearish implications and target 61.8% retracement at 1.2732.
In the bigger picture, as long as 1.3000 support holds, the up trend from 1.0351 (2022 low) is still in progress. Next target is 61.8% projection of 1.0351 to 1.3141 from 1.2298 at 1.4022. However, considering mild bearish divergence condition in D MACD, decisive break of 1.3000 will argue that a medium term top is already in place, and bring deeper fall back to 1.2664 support next.
GBP/USD Could Recover: Is a Comeback on The Way?
Key Highlights
- GBP/USD started a fresh decline below the 1.3120 support zone.
- A connecting bearish trend line is forming with resistance at 1.3070 on the 4-hour chart.
- EUR/USD extended losses and traded below the 1.0920 support.
- Bitcoin rallied above the $63,500 and $64,000 levels.
GBP/USD Technical Analysis
The British Pound started a fresh decline from the 1.3440 resistance against the US Dollar. GBP/USD traded below the 1.3250 and 1.3120 support levels to enter a bearish zone.
Looking at the 4-hour chart, the pair settled below the 1.3100 level, the 100 simple moving average (red, 4-hour), and the 200 simple moving average (green, 4-hour). The pair even tested the 1.3015 zone. A low was formed at 1.3014 and the pair is now consolidating losses.
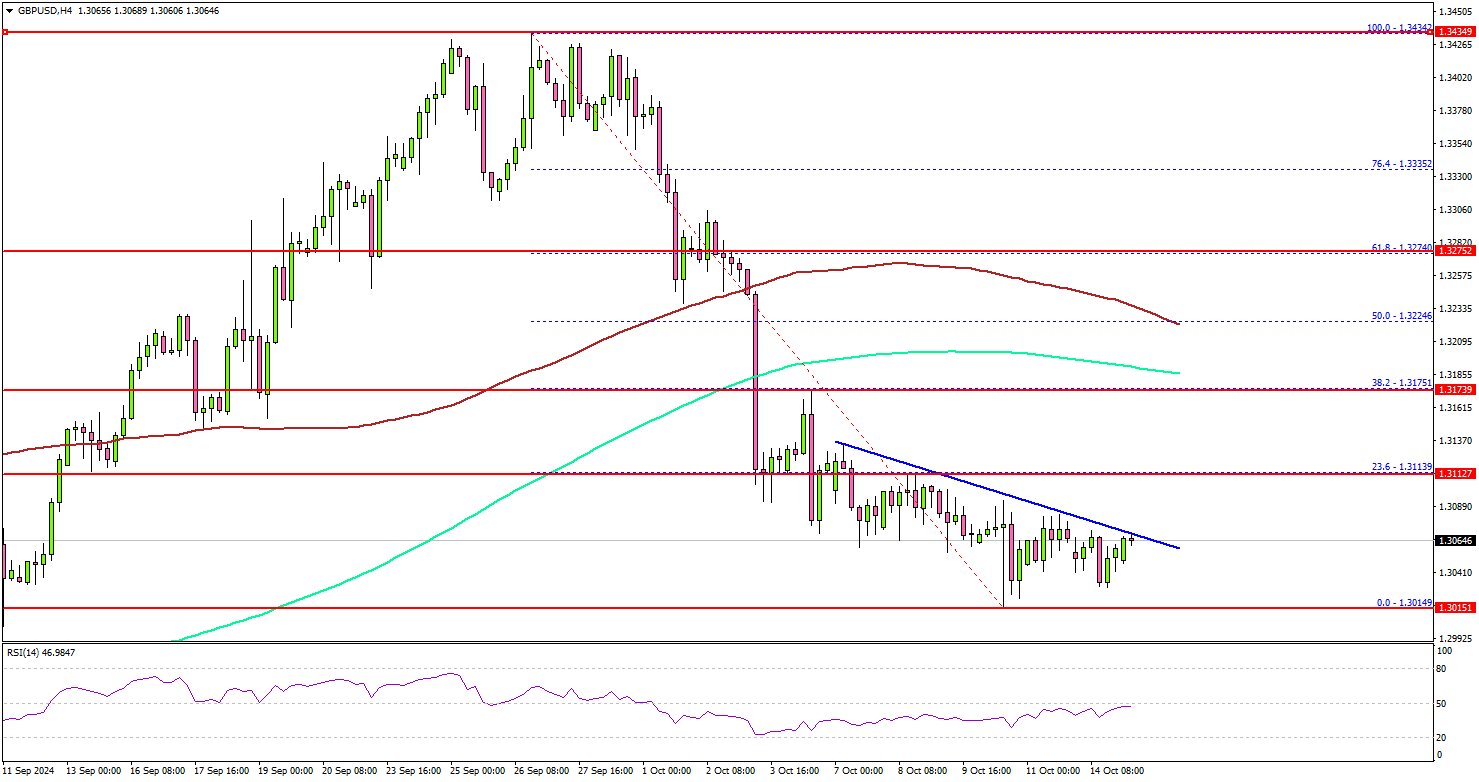
On the downside, immediate support sits near the 1.3020 level. The next key support sits near the 1.3000 level. Any more losses could send the pair toward the 1.2880 level.
On the upside, the bears might be active near the 1.3070 level. There is also a connecting bearish trend line forming with resistance at 1.3070 on the same chart. The first major resistance might be near the 1.3120 level. It is close to the 23.6% Fib retracement level of the downward move from the 1.3434 swing high to the 1.3014 low.
A close above the 1.3120 level could set the tone for another increase. The next major resistance could be 1.3175. A clear move above the 1.3175 level might send GBP/USD toward 1.3220. Any more gains might call for a test of the 1.3320 zone.
Looking at EUR/USD, the bears remained active and were able to push the pair below the 1.0940 and 1.0920 support levels.
Upcoming Economic Events:
- UK Claimant Count Change for Sep 2024 – Forecast 20.2K, versus 23.7K previous.
- UK ILO Unemployment Rate for August 2024 (3M) – Forecast 4.1%, versus 4.1% previous.
Cryptocurrencies surge amid optimism over US regulatory outlook post-election
Cryptocurrencies rallied overnight on growing optimism that regulatory environment for digital assets in the US may improve following the upcoming presidential election in November. This boost in sentiment was initially driven by a rise in Donald Trump's standing in prediction markets and some polls, as he is perceived to be more pro-crypto compared. Later, the market received another push after Kamala Harris’ campaign made supportive comments, pledging to support a regulatory framework for cryptocurrencies.
Technically, however, Bitcoin is still stuck in medium term consolidation pattern from 73012 (March high). The range is pretty much set between 50% retracement of 24896 to 37812 at 49354, i.e. between 49k and 74k in short.
Further near term rise is in favor as long as 58846 support holds. Break of 66854 will target a test on 73812 high. However, there is so far no indication of sustainable momentum through to new record.
Ethereum's outlook is worse. Current bounce might be just a leg of the consolidation pattern from 2084.52 low. Further decline will remain in favor as long as 2797.60 resistance holds. Break of 20845.71 will resume the larger down trend from 4092.55 (March high).