Sample Category Title
EUR/USD Daily Outlook
Daily Pivots: (S1) 1.0923; (P) 1.0938; (R1) 1.0954; More....
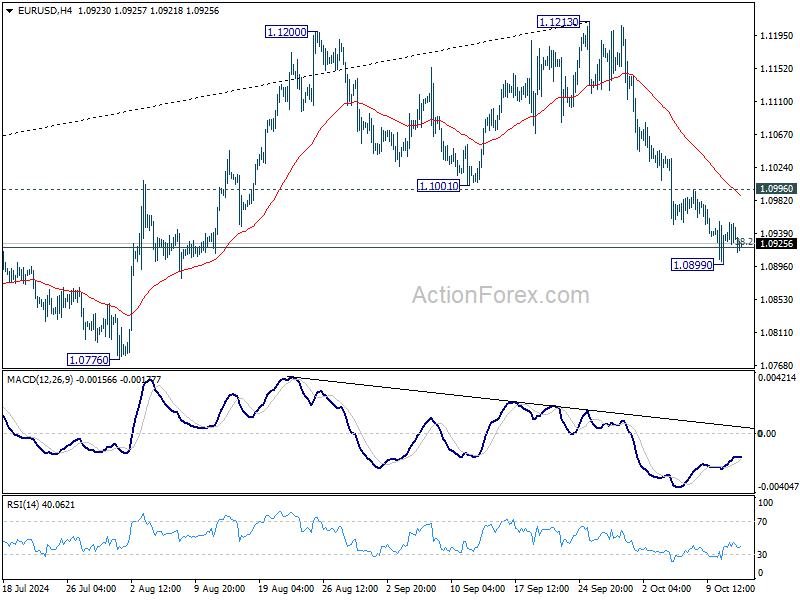
Intraday bias in EUR/USD remains neutral for the moment. Further decline is expected as long as 1.0996 resistance holds. On the downside, sustained break of 38.2% retracement of 1.0447 to 1.1213 at 1.0920 will argue that fall from 1.1213 is the third leg of the corrective pattern from 1.1274. In this case, deeper decline would be seen to 61.8% retracement at 1.0740 next.
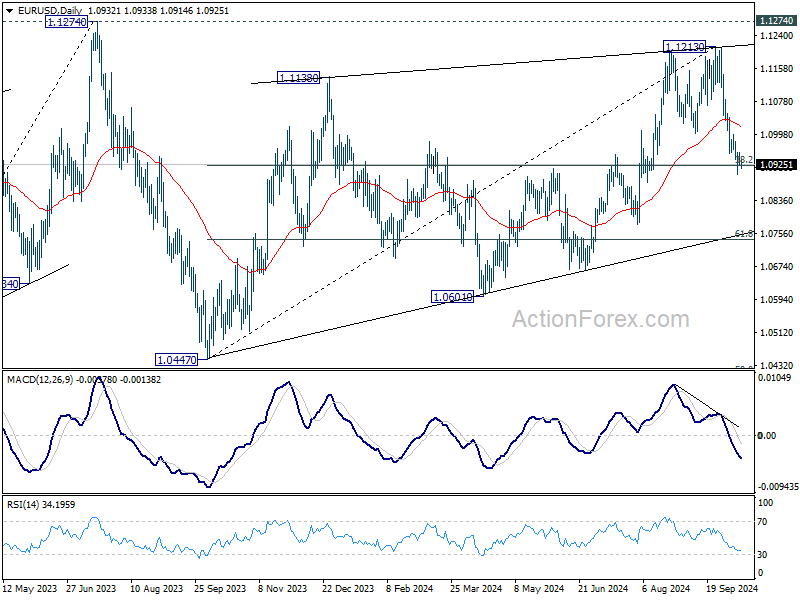
In the bigger picture, rejection by 1.1274 resistance suggests that corrective pattern from 1.1274 (2023 high) is not completed yet. Instead, decline from 1.1213 might be another falling leg. Sustained break of 55 W EMA (now at 1.0877) will validate this case, and bring deeper fall towards 1.0447 support again.
GBP/USD Daily Outlook
Daily Pivots: (S1) 1.3045; (P) 1.3064; (R1) 1.3089; More...
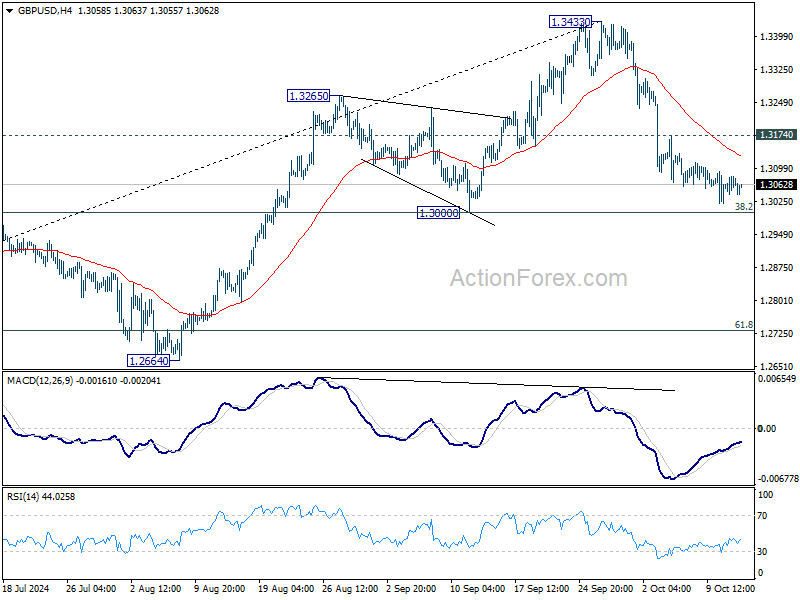
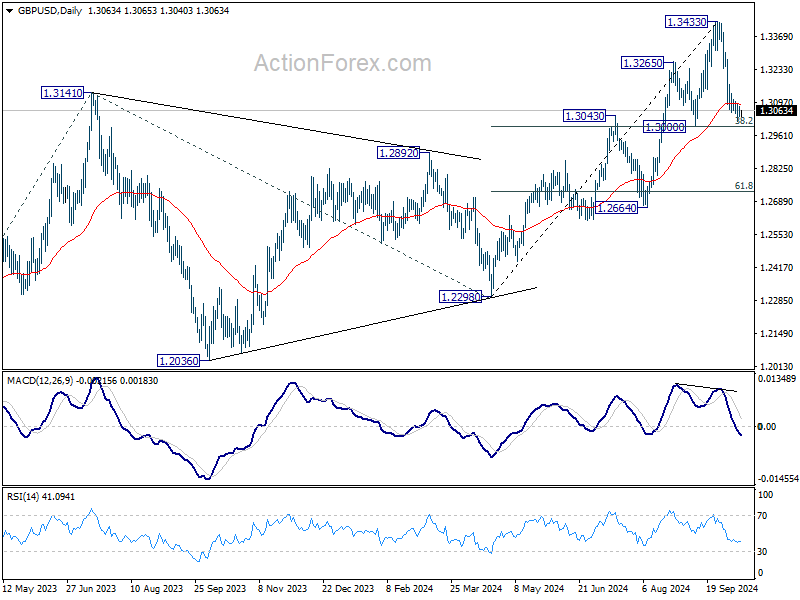
Intraday bias in GBP/USD remains neutral for the moment. Fall from 1.3433 short term top could extend lower. But strong support should be seen from 1.3000 cluster support (38.2% retracement of 1.2298 to 1.3433 at 1.2999) to contained downside. Above 1.3174 minor resistance will turn bias back to the upside for stronger rebound. However, decisive break of 1.3000 will carry larger bearish implications.
In the bigger picture, as long as 1.3000 support holds, the up trend from 1.0351 (2022 low) is still in progress. Next target is 61.8% projection of 1.0351 to 1.3141 from 1.2298 at 1.4022. However, considering mild bearish divergence condition in D MACD, decisive break of 1.3000 will argue that a medium term top is already in place, and bring deeper fall back to 1.2664 support next.
USD/JPY Daily Outlook
Daily Pivots: (S1) 148.58; (P) 148.94; (R1) 149.46; More...
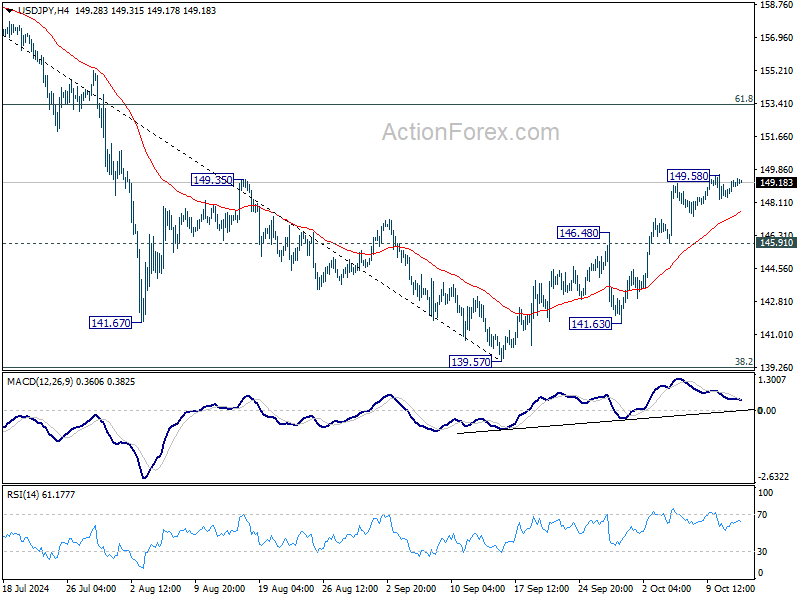
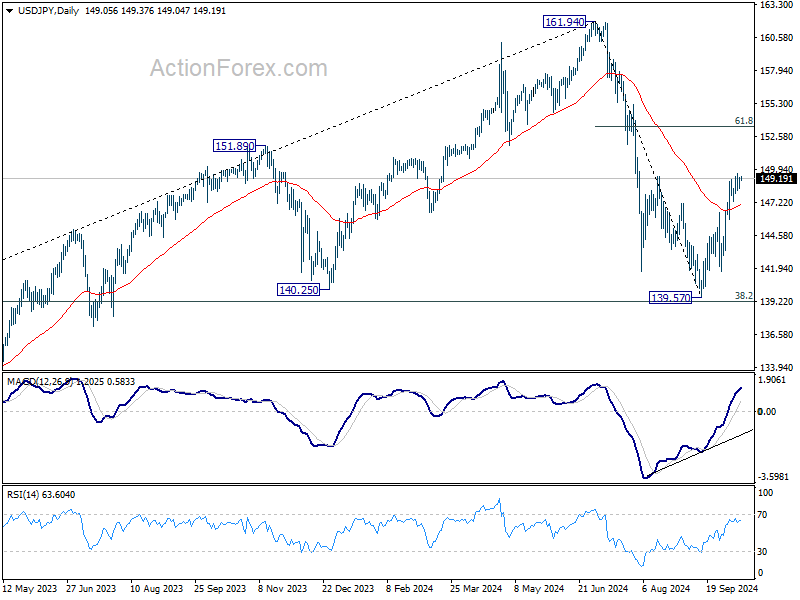
Intraday bias in USD/JPY remains neutral for consolidations below 149.58 temporary top. Further rally is expected as long as 145.91 support holds. Above 149.58 will resume the rise from 139.57 short term bottom to 61.8% retracement of 161.94 to 139.57 at 153.39.
In the bigger picture, price actions from 161.94 are seen as a corrective pattern to rise from 102.58 (2021 low). The range of medium term consolidation should now be set between 38.2% retracement of 102.58 to 161.94 at 139.26 and 161.94. Nevertheless, sustained break of 139.26 would open up deeper medium term decline to 61.8% retracement at 125.25.
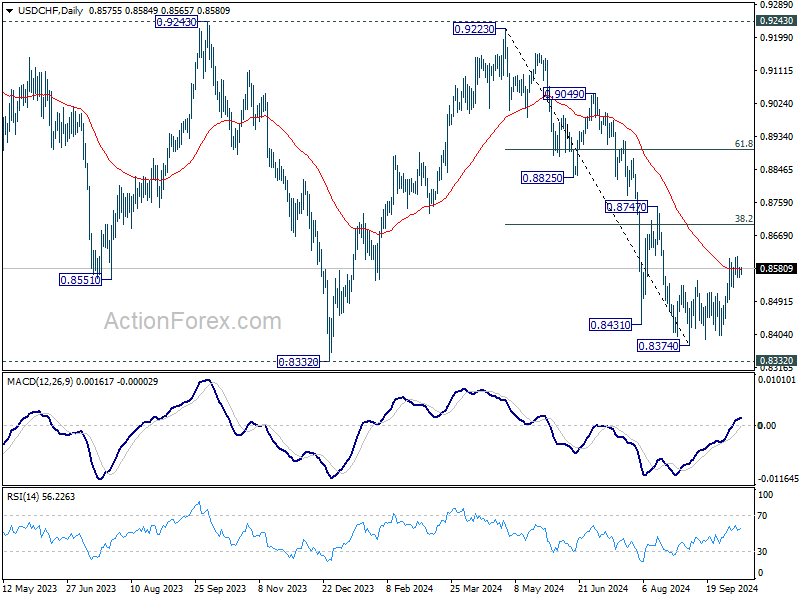
USD/CHF Daily Outlook
Daily Pivots: (S1) 0.8557; (P) 0.8573; (R1) 0.8590; More…
USD/CHF trades mildly higher in Asian session but stays below 0.8611 temporary top. Intraday bias remains neutral First. further rally is expected as long as 0.8529 minor support holds. Above 0.8611 will resume the rebound from 0.8374 short term bottom to 38.2% retracement of 0.9223 to 0.8374 at 0.8698. However, firm break of 0.8529 will turn bias back to the downside for retesting 0.8374 low instead.
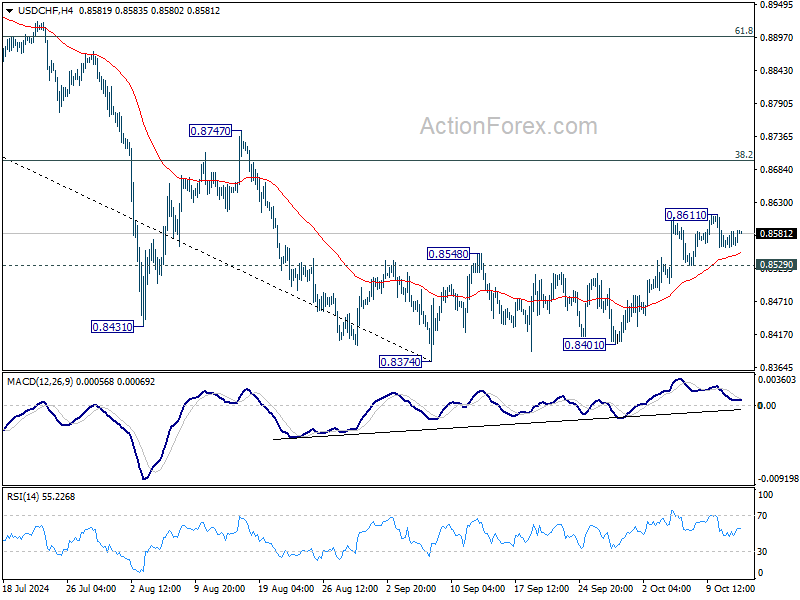
In the bigger picture, price actions from 0.8332 (2023 low) are currently seen as a medium term corrective pattern, with fall from 0.9223 as the second leg. Strong support could be seen from 0.8332 to bring rebound. Yet, overall outlook will continue to stay bearish as long as 0.9243 resistance holds. Firm break of 0.8332, however, will resume larger down trend from 1.0146 (2022 high).
Dollar Strengthens Mildly Amid Quiet Trading, ECB to Cut Again This Week
The Monday Asian session started quietly with Japan on holiday and the US and Canada on extended weekends. Market reactions to China’s Minister of Finance press briefing over the weekend have been subdued, as traders await further details regarding China’s anticipated fiscal stimulus. Without specifics, it's difficult to gauge the broader impact on the country’s economic outlook.
In the currency markets, Dollar is currently leading gains, followed by British Pound and Canadian Dollar. On the downside, New Zealand Dollar is the weakest, followed by Australian Dollar and Swiss Franc. Euro and Japanese Yen are trading in the middle. But most major pairs are just confined within Friday’s narrow trading ranges. The key event of the week will be the anticipated ECB rate cut, while inflation data from the UK, Canada, and New Zealand will also be closely monitored for further policy signals.
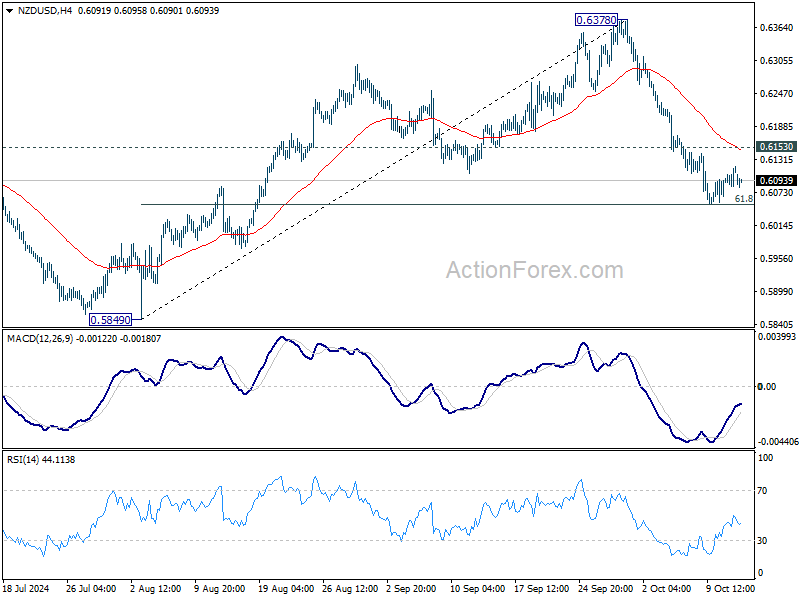
Technically, NZD/USD recovered after touching 61.8% retracement of 0.5849 to 0.6378 at 0.6051. But outlook will stay bearish as long as 0.6153 resistance holds. Decisive break of 0.6051 will bring deeper fall back to 0.5849 support next. The upcoming Q3 CPI data from New Zealand could play a critical role in determining the pair’s next move.
In Asia, at the time of writing, Hong Kong HSI is down -0.10%. China Shanghai SSE is up 1.87%. Singapore Strait Times is up 0.42%. Japan is on holiday.
China’s CPI falls back to 0.4% yoy in Sep, PPI down -2.8% yoy
China’s inflation data for September, released over the weekend, showed continuously weak price momentum.
Headline CPI growth slowed to 0.4% yoy, down from 0.6% yoy in August and missing market expectations of 0.6%. Core CPI, which excludes volatile food and energy prices, rose by just 0.1% yoy, its lowest reading since February 2021. This marked the 20th consecutive month in which core inflation remained below 1.0%, underscoring persistent weak domestic demand and the need for stronger economic stimulus to encourage consumer spending.
Food prices remained a key driver of inflation, with a 3.3% yoy increase. Vegetable prices surged by 22.9% yoy, and pork prices jumped by 16.2% yoy. These spikes in food costs contributed to the overall rise in consumer prices, but price weakness in other areas remains a concern. For instance, prices of new energy vehicles, which face international tariff pressures, fell by -6.9% yoy.
On the industrial front, PPI fell by -2.8% yoy in September, deeper than the -1.8% yoy decline in August and missing expectations of a -2.5% yoy drop. This marked the 24th consecutive month of negative PPI readings
New Zealand BNZ services unchanged at 457, stuck in contraction
New Zealand's BusinessNZ Performance of Services Index was unchanged at 45.7 in September, marking the seventh consecutive month in contraction and remaining well below the long-term average of 53.1.
Katherine Rich, CEO of BusinessNZ, noted that the services sector appears to be "stuck in a rut" and is struggling to get out of contraction.
The detailed data reflects mixed performance across key components. While activity/sales edged slightly higher from 44.3 to 45.6, employment saw a sharp decline, dropping from 49.4 to 45.7—reflecting further weakness in job creation. New orders/business also ticked down marginally from 46.9 to 46.7, while supplier deliveries dipped further to 43.2 from 43.5.
One small positive came from a reduction in the proportion of negative comments from respondents, which fell to 58.5% in September, compared to 60.8% in August and 67.0% in June and July. However, a significant number of businesses still cited the broader economic environment as a key negative factor impacting their performance.
ECB to Cut Rates, CPI Reports from UK, Canada, and New Zealand Awaited
ECB is at the forefront this week and is set to deliver a widely expected rate cut. Meanwhile, key inflation data from several major economies, including the UK, Canada, and New Zealand, will offer crucial insights into their central banks' next moves
ECB is widely expected to lower the deposit rate by 25bps to 3.25% . This marks a significant shift from its previous stance, driven by increasing concerns about economic stagnation and faster-than-expected decline in inflation across the Eurozone. Supporting this expectation, a recent Reuters poll indicated that 70 out of 75 economists surveyed anticipate the 25bps rate cut, a dramatic change from the mere 12% who predicted such a move just a month ago. Looking ahead, 68 of these economists also foresee an additional 25bps reduction, bringing the deposit rate down to 3.00%.
Inflation data will be in sharp focus this week too, with CPI releases from the United Kingdom, Canada, New Zealand, and Japan drawing significant attention.
In the UK, headline inflation is projected to decline to 1.9% in September, below BoE's 2% target after two months of slight rebounds. However, core CPI is expected to remain relatively high at 3.4%, only a slight decrease from 3.6%. BoE's MPC is notably divided on the future path of monetary policy. Recently, Governor Andrew Bailey suggested that more aggressive easing could be an option, while Chief Economist Huw Pill urged caution. Consequently, every piece of incoming data will be critical ahead of the November meeting. Additionally, the UK is set to release employment figures and retail sales data.
In Canada, CPI for September might show a slight increase but is expected to remain close to BoC's target, with core measures holding steady. This situation has led to growing calls for BoC to expedite its policy easing and return interest rates to a neutral setting more swiftly to prevent inflation from falling below target. Should CPI data reveal any downside surprises this week, it could prompt the BoC towards a more substantial 50bps rate cut at its meeting on October 23.
Turning to New Zealand, Q3 CPI is anticipated to show a sharp slowdown from 3.3% to 2.3%, reinforcing RBNZ significant 50bps cut last week. There is speculation that RBNZ may follow up with another 50bps reduction on November 27 to conclude the year, especially since the next meeting isn't scheduled until mid-February next year. Should this week’s CPI data support the case for further easing, RBNZ may feel compelled to act preemptively once again.
Other important economic indicators to monitor this week include Germany's ZEW Economic Sentiment Index, Australia's employment statistics, Japan's CPI figures, and China's GDP report.
Here are some highlights for the week:
- Monday: New Zealand BNZ services; China trade balance; Swiss PPI.
- Tuesday: UK employment; Germany ZEW; Eurozone industrial production; Canada CPI, wholesale sales; US Empire State manufacturing.
- Wednesday: New Zealand CPI; UK CPI; Canada housing starts, manufacturing sales; US import prices.
- Thursday: Japan trade balance, tertiary industry index; Australia employment, NAB quarterly business confidence; Eurozone CPI final, trade balance, ECB rate decision; US retail sales, jobless claims, Philly Fed survey, industrial production, business inventories, NAHB housing index.
- Friday: Japan CPI; China GDP, industrial production, retail sales, fixed asset investment; UK retail sales; Eurozone current account; US building permits and housing starts.
USD/CHF Daily Outlook
Daily Pivots: (S1) 0.8557; (P) 0.8573; (R1) 0.8590; More…
USD/CHF trades mildly higher in Asian session but stays below 0.8611 temporary top. Intraday bias remains neutral First. further rally is expected as long as 0.8529 minor support holds. Above 0.8611 will resume the rebound from 0.8374 short term bottom to 38.2% retracement of 0.9223 to 0.8374 at 0.8698. However, firm break of 0.8529 will turn bias back to the downside for retesting 0.8374 low instead.
In the bigger picture, price actions from 0.8332 (2023 low) are currently seen as a medium term corrective pattern, with fall from 0.9223 as the second leg. Strong support could be seen from 0.8332 to bring rebound. Yet, overall outlook will continue to stay bearish as long as 0.9243 resistance holds. Firm break of 0.8332, however, will resume larger down trend from 1.0146 (2022 high).
EUR/USD Dives To 1.0900: Can It Stage a Recovery?
Key Highlights
- EUR/USD started a fresh decline below the 1.1000 support zone.
- A connecting bearish trend line is forming with resistance at 1.0945 on the 4-hour chart.
- GBP/USD extended losses and traded below the 1.3080 support.
- Gold started a consolidation phase near the $2,650 level.
EUR/USD Technical Analysis
The Euro started a fresh decline from the 1.1200 resistance against the US Dollar. EUR/USD traded below the 1.1120 and 1.1000 support levels to enter a bearish zone.
Looking at the 4-hour chart, the pair settled below the 1.1000 level, the 100 simple moving average (red, 4-hour), and the 200 simple moving average (green, 4-hour). The pair even tested the 1.0900 zone. A low was formed at 1.0900 and the pair is now consolidating losses.
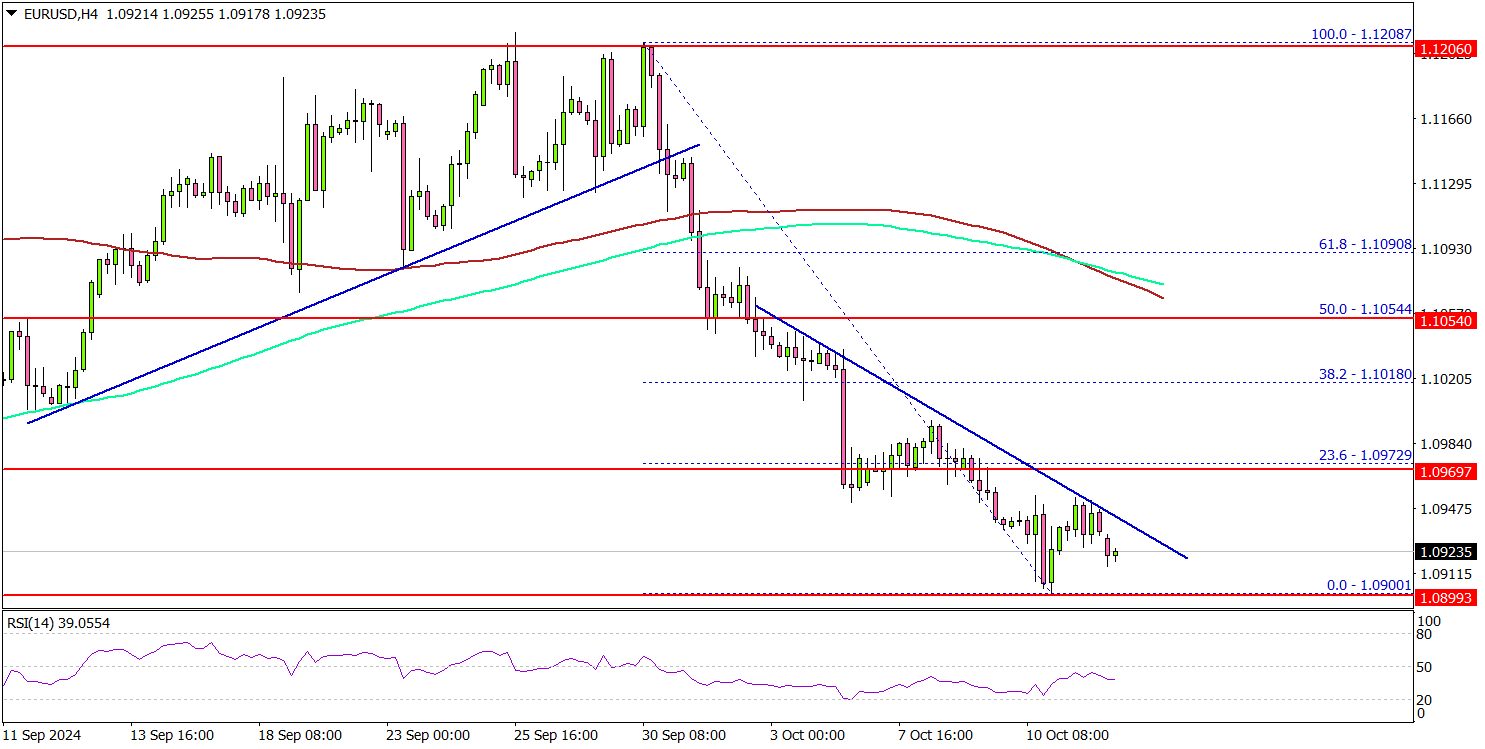
On the downside, immediate support sits near the 1.0900 level. The next key support sits near the 1.0880 level. Any more losses could send the pair toward the 1.0850 level. Any more losses could send the pair toward the 1.0820 level.
On the upside, the bears might be active near the 1.0945 level. The first major resistance might be near the 1.0975 level. It is close to the 23.6% Fib retracement level of the downward move from the 1.1208 swing high to the 1.0900 low.
A close above the 1.0975 level could set the tone for another increase. The next major resistance could be 1.1020. A clear move above the 1.1020 level might send EUR/USD toward 1.1050. Any more gains might call for a test of the 1.1120 zone.
Looking at GBP/USD, the bears remained active and were able to push the pair below the 1.3120 and 1.3080 support levels.
Upcoming Economic Events:
- Fed's Kashkari speech.
New Zealand BNZ services unchanged at 457, stuck in contraction
New Zealand's BusinessNZ Performance of Services Index was unchanged at 45.7 in September, marking the seventh consecutive month in contraction and remaining well below the long-term average of 53.1.
Katherine Rich, CEO of BusinessNZ, noted that the services sector appears to be "stuck in a rut" and is struggling to get out of contraction.
The detailed data reflects mixed performance across key components. While activity/sales edged slightly higher from 44.3 to 45.6, employment saw a sharp decline, dropping from 49.4 to 45.7—reflecting further weakness in job creation. New orders/business also ticked down marginally from 46.9 to 46.7, while supplier deliveries dipped further to 43.2 from 43.5.
One small positive came from a reduction in the proportion of negative comments from respondents, which fell to 58.5% in September, compared to 60.8% in August and 67.0% in June and July. However, a significant number of businesses still cited the broader economic environment as a key negative factor impacting their performance.
China’s CPI falls back to 0.4% yoy in Sep, PPI down -2.8% yoy
China’s inflation data for September, released over the weekend, showed continuously weak price momentum.
Headline CPI growth slowed to 0.4% yoy, down from 0.6% yoy in August and missing market expectations of 0.6%. Core CPI, which excludes volatile food and energy prices, rose by just 0.1% yoy, its lowest reading since February 2021. This marked the 20th consecutive month in which core inflation remained below 1.0%, underscoring persistent weak domestic demand and the need for stronger economic stimulus to encourage consumer spending.
Food prices remained a key driver of inflation, with a 3.3% yoy increase. Vegetable prices surged by 22.9% yoy, and pork prices jumped by 16.2% yoy. These spikes in food costs contributed to the overall rise in consumer prices, but price weakness in other areas remains a concern. For instance, prices of new energy vehicles, which face international tariff pressures, fell by -6.9% yoy.
On the industrial front, PPI fell by -2.8% yoy in September, deeper than the -1.8% yoy decline in August and missing expectations of a -2.5% yoy drop. This marked the 24th consecutive month of negative PPI readings
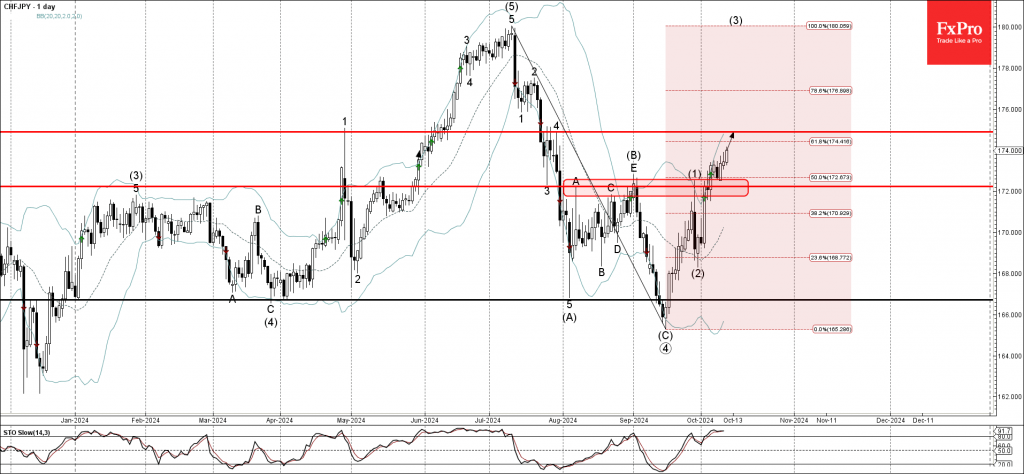
CHFJPY Wave Analysis
- CHFJPY broke resistance zone
- Likely to rise to resistance level 174.90
CHFJPY currency pair under the bullish pressure after the earlier breakout of the resistance zone located between the key resistance level 172.00 (which stopped the previous waves A, C,E and (1)) and the 50% Fibonacci correction of the primary downward correction 4 from July.
The breakout of this resistance zone accelerated the active intermediate impulse sequence (3) from the end of September.
Given the rising bullish Swiss franc sentiment, CHFJPY currency pair be expected to rise further to the next resistance level 174.90.
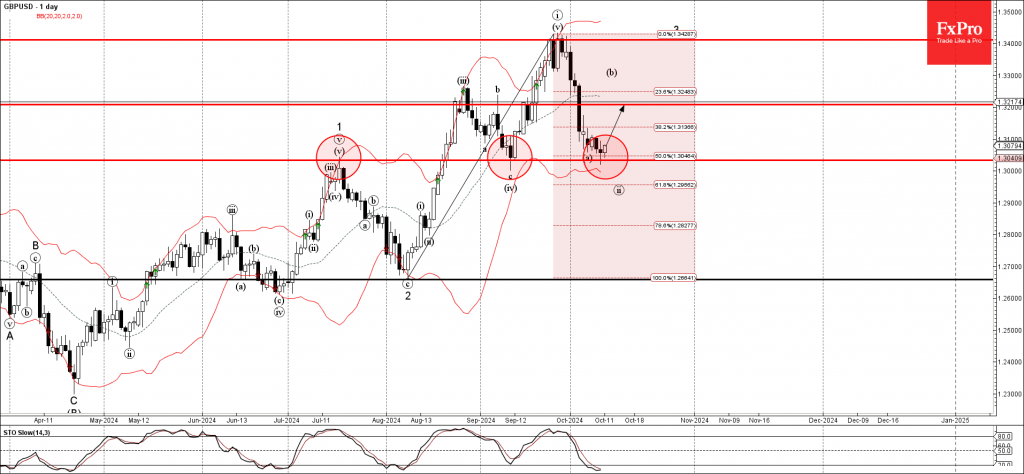
GBPUSD Wave Analysis
- GBPUSD reversed from support zone
- Likely to rise to resistance level 1.3200
GBPUSD currency pair recently reversed up from the support zone located between the pivotal support level 1.3030 (former monthly high from July), lower daily Bollinger Band and the 50% Fibonacci correction of the upward impulse from August.
The upward reversal from this support zone stopped the previous minor correction ii from the end of September.
Given the clear daily uptrend and the oversold daily Stochastic, GBPUSD currency pair be expected to rise further to the next resistance level 1.3200.