
Sample Category Title
EUR/GBP Weekly Outlook
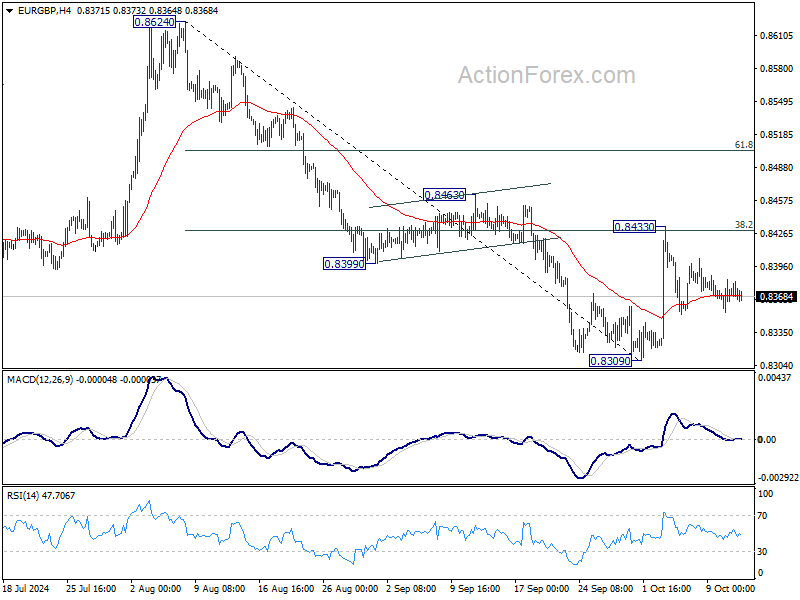
EUR/GBP stayed in range of 0.8309/8433 last week and outlook is unchanged. Initial bias remains neutral this week first and further decline is in favor. On the downside, firm break of 0.8309 will resume larger down trend to 0.8201 key support next. However, decisive break of 38.2% retracement of 0.8624 to 0.8309 at 0.8429 will pave the way to 61.8% retracement at 0.8504 and possibly above.
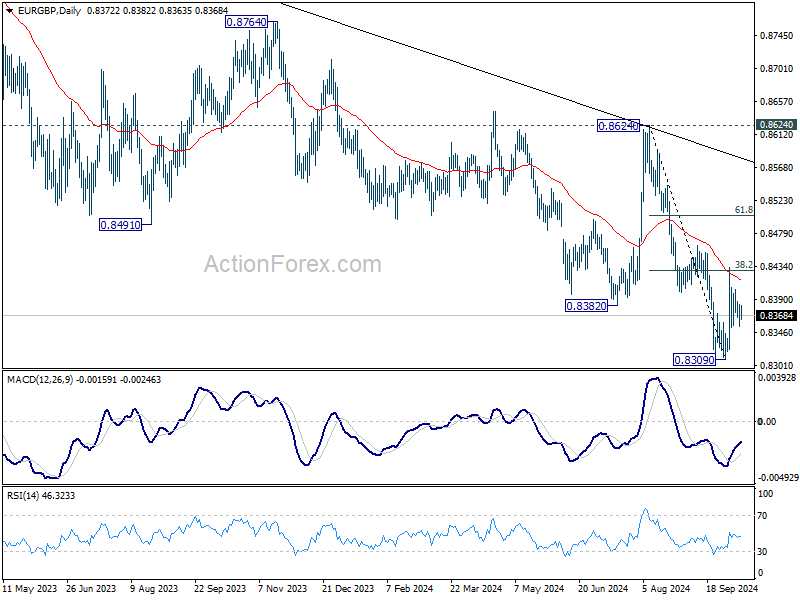
In the bigger picture, down trend from 0.9267 (2022 high) is in progress. Next target is 0.8201 (2022 low), but strong support should be seen there to bring rebound. However, outlook will remain bearish as long as 0.8624 resistance holds even in case of strong rebound.
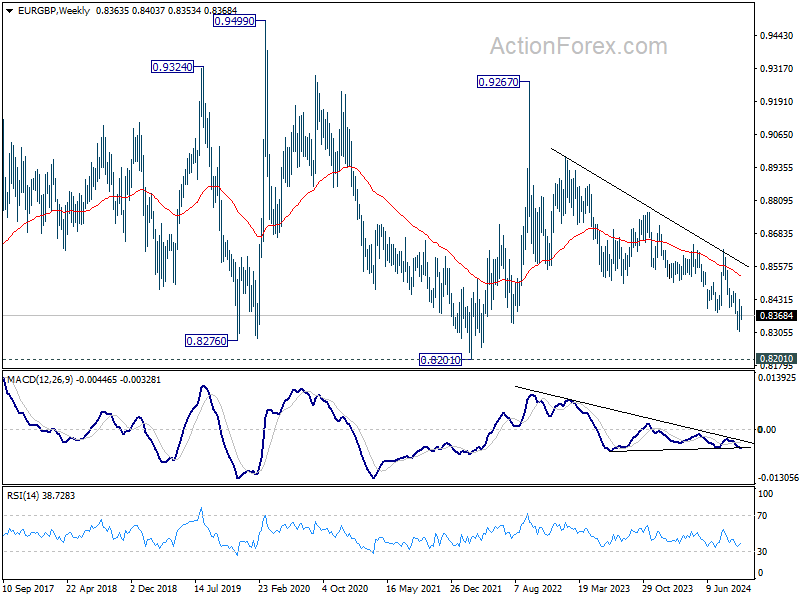
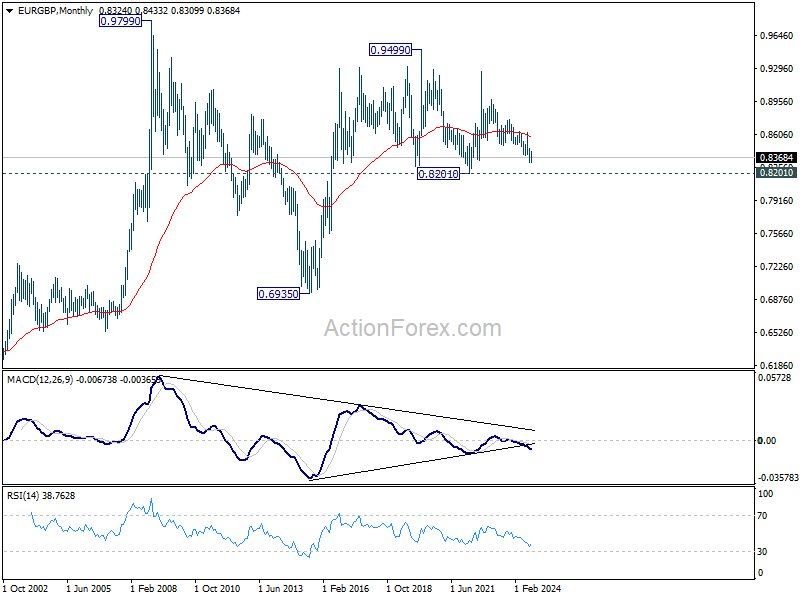
In the long term picture, price action from 0.9499 (2020 high) is seen as part of the long term range pattern from 0.9799 (2008 high). Range trading should continue between 0.8201 and 0.9499, until there is clear signal of imminent breakout.
EUR/AUD Weekly Outlook
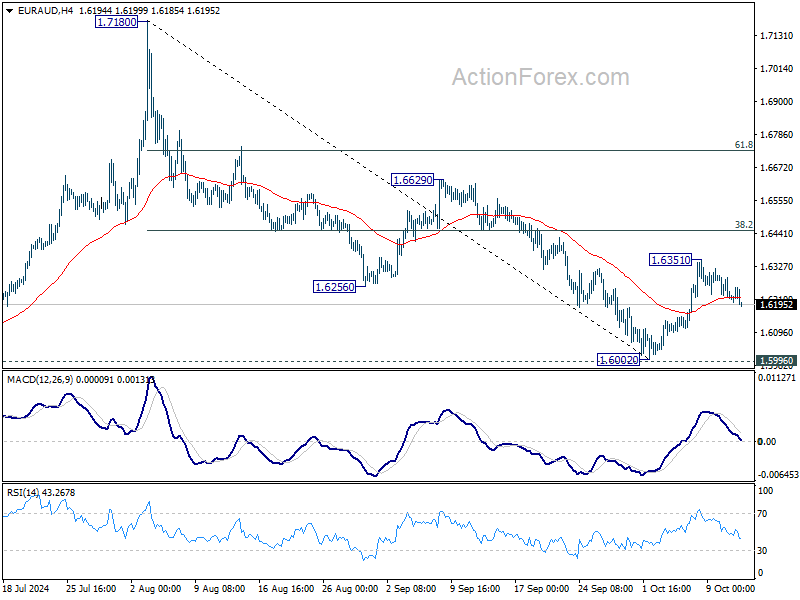
EUR/AUD rose to 1.6351 last week but subsequent break of 55 4H EMA suggest that the recovery has completed. Initial bias is back on the downside this week for retesting 1.6002 low. On the upside, though, above 1.6351 will resume the rebound from 1.6002 to 38.2% of 1.7180 to 1.6002 at 1.6452.
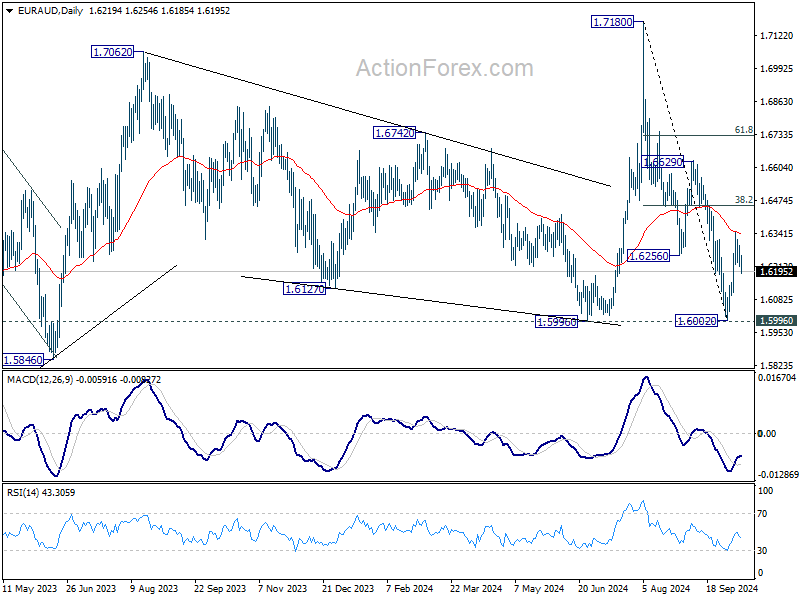
In the bigger picture, as long as 1.5996 support holds, up trend from 1.4281 (2022 low) is still expected to resume at a later stage. However, decisive break of 1.5996 will argue that the medium term trend has reversed and turn outlook bearish.
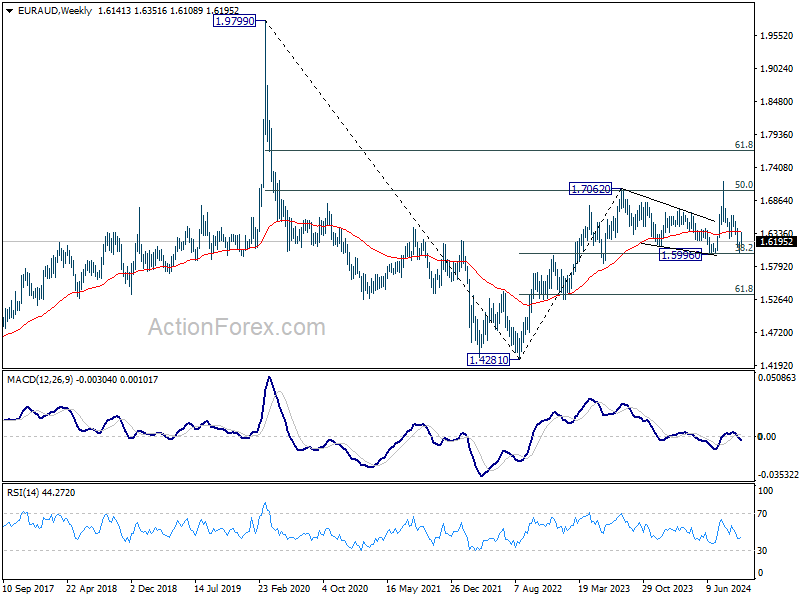
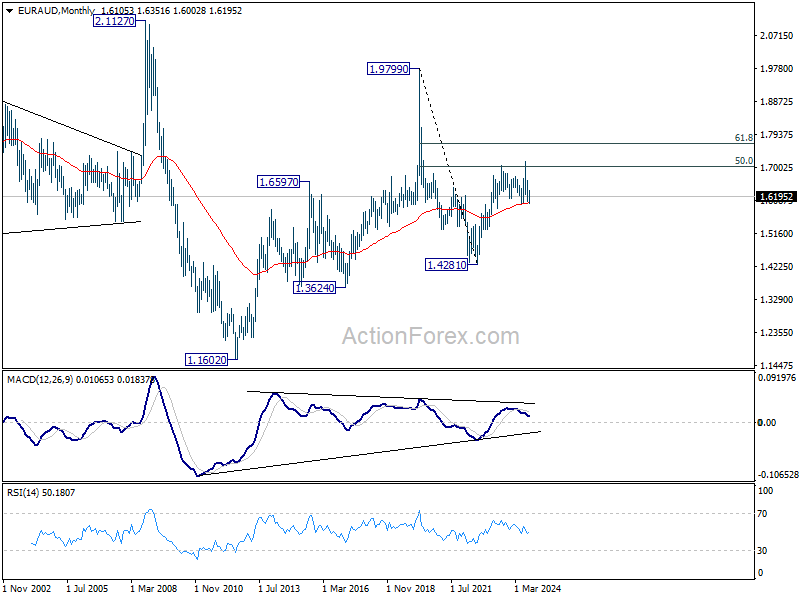
In the longer term picture, rise from 1.4281 is seen as the second leg of the pattern from 1.9799 (2020 high), which is part of the pattern from 2.1127 (2008 high). As long as 55 M EMA (now at 1.6008) holds, this second leg could still extend higher. However, sustained trading below 55 M EMA will open up the bearish case for extending the decline through 1.4281 low.
EUR/CHF Weekly Outlook
EUR/CHF stayed in the near term converging range last week and outlook is unchanged. Initial bias remains neutral first. On the downside, break of 0.9332 will resume the fall from 0.9579 towards 0.9209 low. On the upside, break of 0.9506 will turn intraday bias to the upside for 0.9579 resistance and above.
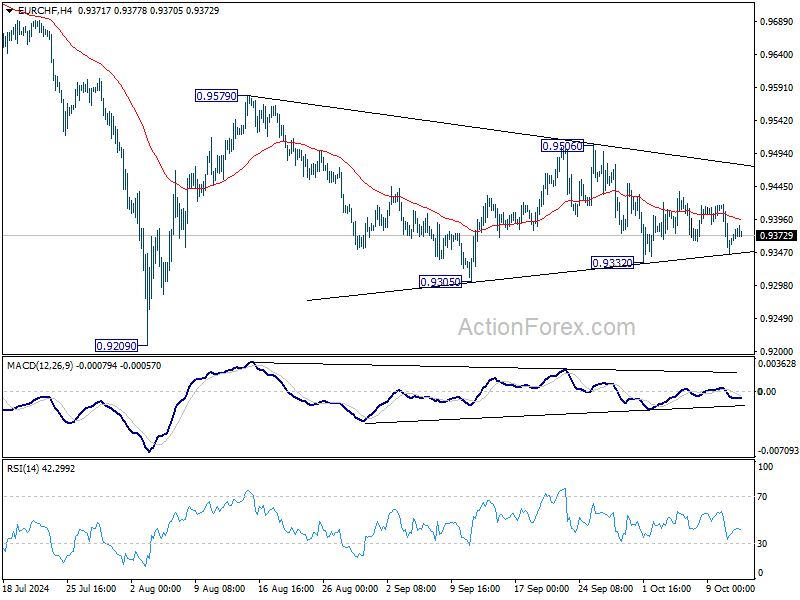
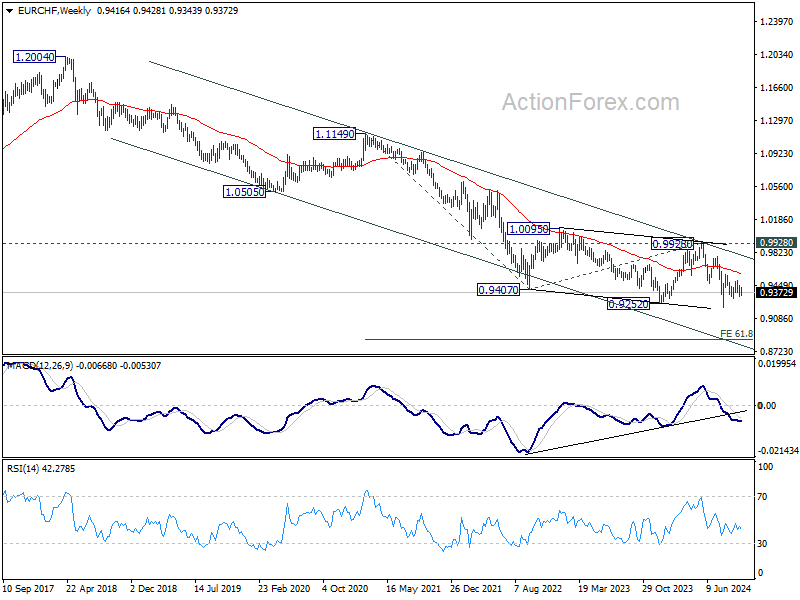
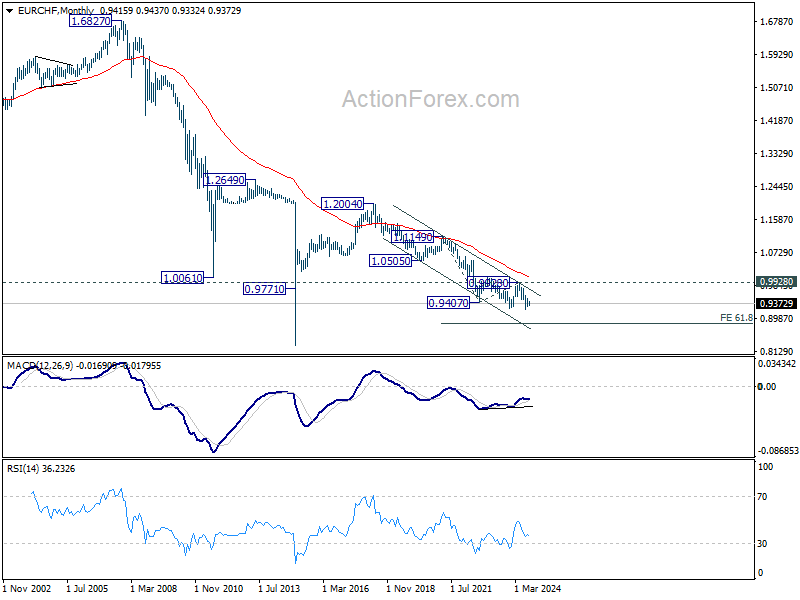
In the bigger picture, medium term corrective pattern from 0.9407 (2022 low) might have completed with three waves to 0.9928. Decisive break of 0.9252 (2023 low) will confirm long term down trend resumption. Next target will be 61.8% projection of 1.1149 to 0.9407 from 0.9928 at 0.8851. For now, outlook will stay bearish as long as 0.9928 resistance holds, even in case of strong rebound.
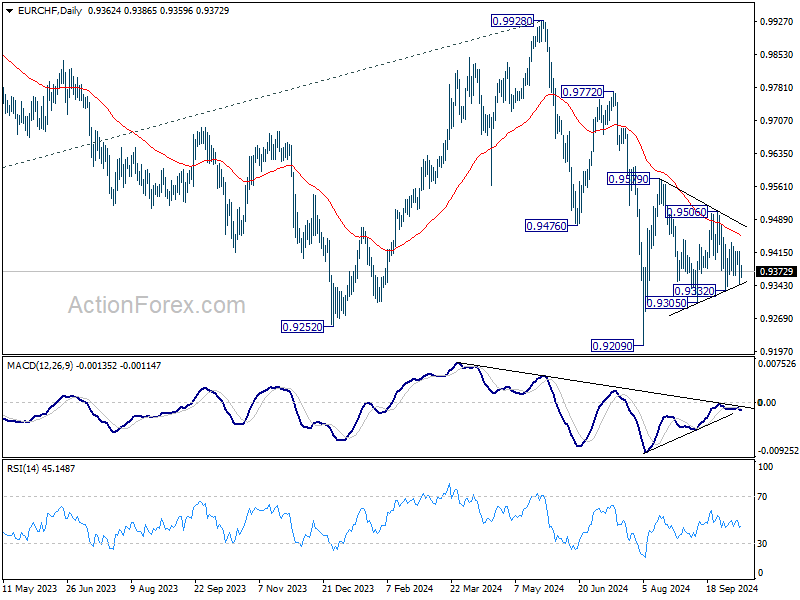
In the long term picture, fall from 1.2004 (2018 high) is part of the multi-decade down trend. Firm break of 0.9928 resistance is needed to be the first sign of long term bottoming. Otherwise, outlook will remain bearish.
Summary 10/14 – 10/18
Monday, Oct 14, 2024
| GMT | Ccy | Events | Consensus | Previous |
|---|---|---|---|---|
| 21:30 | NZD | Business NZ PSI Sep | 45.5 | |
| 03:00 | CNY | Trade Balance (USD) Sep | 91.5B | 91.0B |
| 06:30 | CHF | Producer and Import Prices Y/Y Sep | -1.20% | |
| 06:30 | CHF | Producer and Import Prices M/M Sep | 0.10% | 0.20% |
| GMT | Ccy | Events | |
|---|---|---|---|
| 21:30 | NZD | Business NZ PSI Sep | |
| Forecast: | Previous: 45.5 | ||
| 03:00 | CNY | Trade Balance (USD) Sep | |
| Forecast: 91.5B | Previous: 91.0B | ||
| 06:30 | CHF | Producer and Import Prices Y/Y Sep | |
| Forecast: | Previous: -1.20% | ||
| 06:30 | CHF | Producer and Import Prices M/M Sep | |
| Forecast: 0.10% | Previous: 0.20% | ||
Tuesday, Oct 15, 2024
| GMT | Ccy | Events | Consensus | Previous |
|---|---|---|---|---|
| 04:30 | JPY | Industrial Production M/M Aug F | -3.30% | -3.30% |
| 06:00 | GBP | Claimant Count Change Sep | 20.2K | 23.7K |
| 06:00 | GBP | ILO Unemployment Rate (3M) Aug | 4.10% | 4.10% |
| 06:00 | GBP | Average Earnings Including Bonus 3M/Y Aug | 4% | |
| 06:00 | GBP | Average Earnings Excluding Bonus 3M/Y Aug | 5.00% | 5.10% |
| 09:00 | EUR | Germany ZEW Economic Sentiment Oct | 10.2 | 3.6 |
| 09:00 | EUR | Germany ZEW Current Situation Oct | -85 | -84.5 |
| 09:00 | EUR | EurozoneZEW Economic Sentiment Oct | 16.9 | 9.3 |
| 09:00 | EUR | Eurozone Industrial Production M/M Aug | 1.80% | -0.30% |
| 12:30 | USD | Empire State Manufacturing Index Oct | 3.4 | 11.5 |
| 12:30 | CAD | Wholesale Sales M/M Aug | -1.10% | 0.40% |
| 12:30 | CAD | CPI M/M Sep | -0.20% | -0.20% |
| 12:30 | CAD | CPI Y/Y Sep | 2.10% | 2.00% |
| 12:30 | CAD | CPI Median Y/Y Sep | 2.30% | 2.30% |
| 12:30 | CAD | CPI Trimmed Y/Y Sep | 2.40% | 2.40% |
| 12:30 | CAD | CPI Common Y/Y Sep | 2.10% | 2.00% |
| 21:45 | NZD | CPI Q/Q Q3 | 0.70% | 0.40% |
| 21:45 | NZD | CPI Y/Y Q3 | 2.30% | 3.30% |
| 23:50 | JPY | Machinery Orders M/M Aug | -0.10% | -0.10% |
| GMT | Ccy | Events | |
|---|---|---|---|
| 04:30 | JPY | Industrial Production M/M Aug F | |
| Forecast: -3.30% | Previous: -3.30% | ||
| 06:00 | GBP | Claimant Count Change Sep | |
| Forecast: 20.2K | Previous: 23.7K | ||
| 06:00 | GBP | ILO Unemployment Rate (3M) Aug | |
| Forecast: 4.10% | Previous: 4.10% | ||
| 06:00 | GBP | Average Earnings Including Bonus 3M/Y Aug | |
| Forecast: | Previous: 4% | ||
| 06:00 | GBP | Average Earnings Excluding Bonus 3M/Y Aug | |
| Forecast: 5.00% | Previous: 5.10% | ||
| 09:00 | EUR | Germany ZEW Economic Sentiment Oct | |
| Forecast: 10.2 | Previous: 3.6 | ||
| 09:00 | EUR | Germany ZEW Current Situation Oct | |
| Forecast: -85 | Previous: -84.5 | ||
| 09:00 | EUR | EurozoneZEW Economic Sentiment Oct | |
| Forecast: 16.9 | Previous: 9.3 | ||
| 09:00 | EUR | Eurozone Industrial Production M/M Aug | |
| Forecast: 1.80% | Previous: -0.30% | ||
| 12:30 | USD | Empire State Manufacturing Index Oct | |
| Forecast: 3.4 | Previous: 11.5 | ||
| 12:30 | CAD | Wholesale Sales M/M Aug | |
| Forecast: -1.10% | Previous: 0.40% | ||
| 12:30 | CAD | CPI M/M Sep | |
| Forecast: -0.20% | Previous: -0.20% | ||
| 12:30 | CAD | CPI Y/Y Sep | |
| Forecast: 2.10% | Previous: 2.00% | ||
| 12:30 | CAD | CPI Median Y/Y Sep | |
| Forecast: 2.30% | Previous: 2.30% | ||
| 12:30 | CAD | CPI Trimmed Y/Y Sep | |
| Forecast: 2.40% | Previous: 2.40% | ||
| 12:30 | CAD | CPI Common Y/Y Sep | |
| Forecast: 2.10% | Previous: 2.00% | ||
| 21:45 | NZD | CPI Q/Q Q3 | |
| Forecast: 0.70% | Previous: 0.40% | ||
| 21:45 | NZD | CPI Y/Y Q3 | |
| Forecast: 2.30% | Previous: 3.30% | ||
| 23:50 | JPY | Machinery Orders M/M Aug | |
| Forecast: -0.10% | Previous: -0.10% | ||
Wednesday, Oct 16 2024
| GMT | Ccy | Events | Consensus | Previous |
|---|---|---|---|---|
| 00:00 | AUD | Westpac Leading Index M/M Sep | -0.10% | |
| 06:00 | GBP | CPI M/M Sep | 0.30% | |
| 06:00 | GBP | CPI Y/Y Sep | 1.90% | 2.20% |
| 06:00 | GBP | Core CPI Y/Y Sep | 3.40% | 3.60% |
| 06:00 | GBP | RPI M/M Sep | 0.60% | |
| 06:00 | GBP | RPI Y/Y Sep | 3.10% | 3.50% |
| 06:00 | GBP | PPI Input M/M Sep | -0.50% | -0.50% |
| 06:00 | GBP | PPI Input Y/Y Sep | -1.20% | |
| 06:00 | GBP | PPI Output M/M Sep | -0.30% | -0.30% |
| 06:00 | GBP | PPI Output Y/Y Sep | 0.20% | |
| 06:00 | GBP | PPI Core Output M/M Sep | 0.10% | |
| 06:00 | GBP | PPI Core Output Y/Y Sep | 1.30% | |
| 12:15 | CAD | Housing Starts Y/Y Sep | 235K | 217K |
| 12:30 | CAD | Manufacturing Sales M/M Aug | -1.50% | 1.40% |
| 12:30 | USD | Import Price Index M/M Sep | -0.30% | -0.30% |
| 23:50 | JPY | Trade Balance (JPY) Sep | -0.49T | -0.60T |
| GMT | Ccy | Events | |
|---|---|---|---|
| 00:00 | AUD | Westpac Leading Index M/M Sep | |
| Forecast: | Previous: -0.10% | ||
| 06:00 | GBP | CPI M/M Sep | |
| Forecast: | Previous: 0.30% | ||
| 06:00 | GBP | CPI Y/Y Sep | |
| Forecast: 1.90% | Previous: 2.20% | ||
| 06:00 | GBP | Core CPI Y/Y Sep | |
| Forecast: 3.40% | Previous: 3.60% | ||
| 06:00 | GBP | RPI M/M Sep | |
| Forecast: | Previous: 0.60% | ||
| 06:00 | GBP | RPI Y/Y Sep | |
| Forecast: 3.10% | Previous: 3.50% | ||
| 06:00 | GBP | PPI Input M/M Sep | |
| Forecast: -0.50% | Previous: -0.50% | ||
| 06:00 | GBP | PPI Input Y/Y Sep | |
| Forecast: | Previous: -1.20% | ||
| 06:00 | GBP | PPI Output M/M Sep | |
| Forecast: -0.30% | Previous: -0.30% | ||
| 06:00 | GBP | PPI Output Y/Y Sep | |
| Forecast: | Previous: 0.20% | ||
| 06:00 | GBP | PPI Core Output M/M Sep | |
| Forecast: | Previous: 0.10% | ||
| 06:00 | GBP | PPI Core Output Y/Y Sep | |
| Forecast: | Previous: 1.30% | ||
| 12:15 | CAD | Housing Starts Y/Y Sep | |
| Forecast: 235K | Previous: 217K | ||
| 12:30 | CAD | Manufacturing Sales M/M Aug | |
| Forecast: -1.50% | Previous: 1.40% | ||
| 12:30 | USD | Import Price Index M/M Sep | |
| Forecast: -0.30% | Previous: -0.30% | ||
| 23:50 | JPY | Trade Balance (JPY) Sep | |
| Forecast: -0.49T | Previous: -0.60T | ||
Thursday, Oct 17, 2024
| GMT | Ccy | Events | Consensus | Previous |
|---|---|---|---|---|
| 00:30 | AUD | NAB Business Confidence Q3 | -1 | |
| 00:30 | AUD | Employment Change Sep | 25.2K | 47.5K |
| 00:30 | AUD | Unemployment Rate Sep | 4.20% | 4.20% |
| 04:30 | JPY | Tertiary Industry Index M/M Aug | -0.20% | 1.40% |
| 06:00 | CHF | Trade Balance (CHF) Sep | 4 | |
| 09:00 | EUR | Eurozone Trade Balance (EUR) Aug | 17.8B | 15.5B |
| 09:00 | EUR | Eurozone CPI Y/Y Sep F | 1.80% | 1.80% |
| 09:00 | EUR | Eurozone CPI Core Y/Y Sep F | 2.70% | 2.70% |
| 12:15 | EUR | ECB Main Refinancing Rate | 3.40% | 3.65% |
| 12:15 | EUR | ECB Deposit Facility | 3.25% | 3.50% |
| 12:30 | USD | Retail Sales M/M Sep | 0.30% | 0.10% |
| 12:30 | USD | Retail Sales ex Autos M/M Sep | 0.10% | 0.10% |
| 12:30 | USD | Initial Jobless Claims (Oct 11) | 241K | 258K |
| 12:30 | USD | Philadelphia Fed Survey Oct | 3 | 1.7 |
| 12:45 | EUR | ECB Press Conference | ||
| 13:15 | USD | Industrial Production M/M Sep | -0.10% | 0.80% |
| 13:15 | USD | Capacity Utilization Sep | 77.80% | 78.00% |
| 14:00 | USD | Business Inventories Aug | 0.30% | 0.40% |
| 14:00 | USD | NAHB Housing Market Index Oct | 43 | 41 |
| 14:30 | USD | Natural Gas Storage | 82B | |
| 15:00 | USD | Crude Oil Inventories | 5.81M | |
| 23:30 | JPY | National CPI Y/Y Sep | 3.00% | |
| 23:30 | JPY | National CPI Core Y/Y Sep | 2.30% | 2.80% |
| 23:30 | JPY | National CPI Core-Core Y/Y Sep | 2.00% |
| GMT | Ccy | Events | |
|---|---|---|---|
| 00:30 | AUD | NAB Business Confidence Q3 | |
| Forecast: | Previous: -1 | ||
| 00:30 | AUD | Employment Change Sep | |
| Forecast: 25.2K | Previous: 47.5K | ||
| 00:30 | AUD | Unemployment Rate Sep | |
| Forecast: 4.20% | Previous: 4.20% | ||
| 04:30 | JPY | Tertiary Industry Index M/M Aug | |
| Forecast: -0.20% | Previous: 1.40% | ||
| 06:00 | CHF | Trade Balance (CHF) Sep | |
| Forecast: | Previous: 4 | ||
| 09:00 | EUR | Eurozone Trade Balance (EUR) Aug | |
| Forecast: 17.8B | Previous: 15.5B | ||
| 09:00 | EUR | Eurozone CPI Y/Y Sep F | |
| Forecast: 1.80% | Previous: 1.80% | ||
| 09:00 | EUR | Eurozone CPI Core Y/Y Sep F | |
| Forecast: 2.70% | Previous: 2.70% | ||
| 12:15 | EUR | ECB Main Refinancing Rate | |
| Forecast: 3.40% | Previous: 3.65% | ||
| 12:15 | EUR | ECB Deposit Facility | |
| Forecast: 3.25% | Previous: 3.50% | ||
| 12:30 | USD | Retail Sales M/M Sep | |
| Forecast: 0.30% | Previous: 0.10% | ||
| 12:30 | USD | Retail Sales ex Autos M/M Sep | |
| Forecast: 0.10% | Previous: 0.10% | ||
| 12:30 | USD | Initial Jobless Claims (Oct 11) | |
| Forecast: 241K | Previous: 258K | ||
| 12:30 | USD | Philadelphia Fed Survey Oct | |
| Forecast: 3 | Previous: 1.7 | ||
| 12:45 | EUR | ECB Press Conference | |
| Forecast: | Previous: | ||
| 13:15 | USD | Industrial Production M/M Sep | |
| Forecast: -0.10% | Previous: 0.80% | ||
| 13:15 | USD | Capacity Utilization Sep | |
| Forecast: 77.80% | Previous: 78.00% | ||
| 14:00 | USD | Business Inventories Aug | |
| Forecast: 0.30% | Previous: 0.40% | ||
| 14:00 | USD | NAHB Housing Market Index Oct | |
| Forecast: 43 | Previous: 41 | ||
| 14:30 | USD | Natural Gas Storage | |
| Forecast: | Previous: 82B | ||
| 15:00 | USD | Crude Oil Inventories | |
| Forecast: | Previous: 5.81M | ||
| 23:30 | JPY | National CPI Y/Y Sep | |
| Forecast: | Previous: 3.00% | ||
| 23:30 | JPY | National CPI Core Y/Y Sep | |
| Forecast: 2.30% | Previous: 2.80% | ||
| 23:30 | JPY | National CPI Core-Core Y/Y Sep | |
| Forecast: | Previous: 2.00% | ||
Friday, Oct 18, 2024
| GMT | Ccy | Events | Consensus | Previous |
|---|---|---|---|---|
| 02:00 | CNY | Retail Sales Y/Y Sep | 2.40% | 2.10% |
| 02:00 | CNY | Industrial Production Y/Y Sep | 4.60% | 4.50% |
| 02:00 | CNY | Fixed Asset Investment YTD Y/Y Sep | 3.30% | 3.40% |
| 02:00 | CNY | GDP Y/Y Q3 | 4.60% | 4.70% |
| 06:00 | GBP | Retail Sales M/M Sep | -0.30% | 1.00% |
| 08:00 | EUR | Eurozone Current Account (EUR) Aug | 42.2B | 39.6B |
| 12:30 | USD | Housing Starts M/M Sep | 1.360M | 1.356M |
| 12:30 | USD | Building Permits M/M Sep | 1.460M | 1.470M |
| GMT | Ccy | Events | |
|---|---|---|---|
| 02:00 | CNY | Retail Sales Y/Y Sep | |
| Forecast: 2.40% | Previous: 2.10% | ||
| 02:00 | CNY | Industrial Production Y/Y Sep | |
| Forecast: 4.60% | Previous: 4.50% | ||
| 02:00 | CNY | Fixed Asset Investment YTD Y/Y Sep | |
| Forecast: 3.30% | Previous: 3.40% | ||
| 02:00 | CNY | GDP Y/Y Q3 | |
| Forecast: 4.60% | Previous: 4.70% | ||
| 06:00 | GBP | Retail Sales M/M Sep | |
| Forecast: -0.30% | Previous: 1.00% | ||
| 08:00 | EUR | Eurozone Current Account (EUR) Aug | |
| Forecast: 42.2B | Previous: 39.6B | ||
| 12:30 | USD | Housing Starts M/M Sep | |
| Forecast: 1.360M | Previous: 1.356M | ||
| 12:30 | USD | Building Permits M/M Sep | |
| Forecast: 1.460M | Previous: 1.470M | ||
Markets Weekly Outlook – ECB to Deliver 25 bps Rate Cut? Bank Earnings in Focus
- Market expectations for a Federal Reserve rate cut decreased following mixed US data signals.
- The European Central Bank’s interest rate decision is a key event, with a 25 bps cut highly anticipated.
- The week ahead features CPI releases from several countries, including China and New Zealand, while US earnings season gathers pace with major banks reporting.
- Can the S&P 500 rally continue? Technical breakdown provided.
Week in Review: US Data Sends Mixed Signals as Rate Cut Bets Slide
Another week and more disappointment for market participants eyeing rate cuts from the Federal Reserve. A slow start to the week with a lot of rangebound price action through to Thursday afternoons CPI release.
The backend of the week however did not disappoint, US and European indices alike rallying higher on Friday in particular in an attempt to finish the week strong. At the time of writing all wall streets major indexes as well as gold were trading in the green for the week.
Market pricing for a 25 bps rate cut from the Federal Reserve has changed from 97% probability on October 4, to 87% probability at the time of writing.
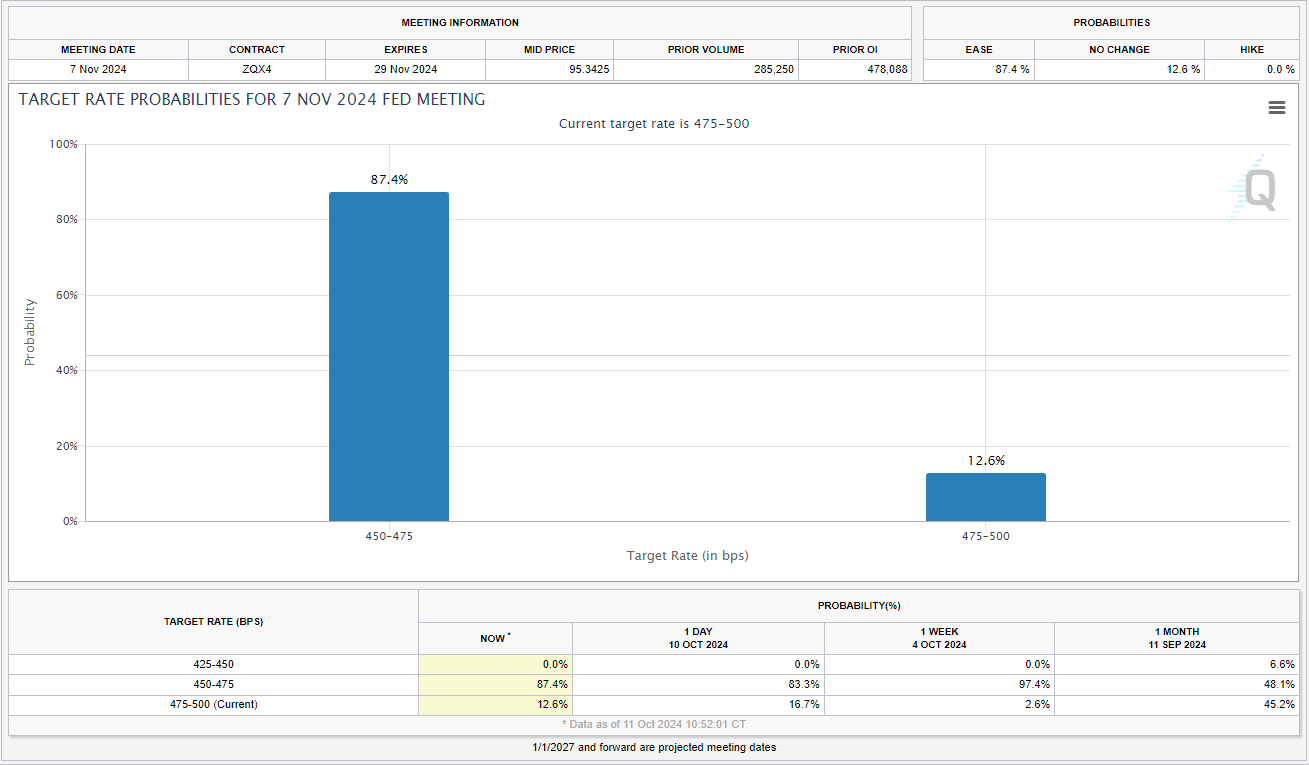
Source: CME FedWatch Tool
Oil prices were trading just over 1% higher this week following last week’s rally. The lack of further geopolitical escalation between Israel and Iran kept oil prices in check, coupled with renewed concerns that the recent Chinese stimulus may not be enough to spur on growth.
The FX font saw the US Dollar dominate proceedings, with gains across the majors. Emerging market currencies however fared slightly better against the greenback, especially toward the backend of the week.
Earnings season got off to a positive start as JPMorgan profit beat estimates. The surprise came from the higher interest income and solid performance from the investment banking division. The big tech names and major earnings releases are largely scheduled for later in the month, but next week still brings some big names.
Among the names reporting next week are Netflix, Investment Banks like Blackrock, Bank of America, CitiGroup and of course Taiwan Semiconductor Manufacturing, better known as TSM.
As the US election draws closer one wonders whether we may start seeing some reaction as polls begin coming through thick and fast. For now though, the week ahead is stacked with key data releases, while the cloud of tensions in the Middle East continues to keep market participants in some sectors on edge.
The Week Ahead: CPI Data, US Earnings and ECB Interest Rates
The week ahead sees a host of CPI releases from China, Canada, New Zealand and the United Kingdom. The biggest event of the week however, is likely to be the ECB rate decision which is a big event for the Euro Area.
Growth has become a sticky point when it comes to the Euro Area and hence the anticipation for this week’s rate meeting. Will a 25 bps cut be enough to stimulate growth?
Asia Pacific Markets
In Asia, data kicks off with Chinese CPI over the weekend. China’s Ministry of Finance also announced a briefing scheduled for 10:00 GMT+8 on Saturday. Markets are largely expecting that Finance Minister Lan Fo’An will unveil a detailed stimulus plan. However, with market expectations running high, there’s potential for disappointment.
Australia will release labor data but eyes will be on the New Zealand CPI print following a 50 bps rate cut this past week. Third-quarter CPI figures are set to be released on Wednesday and could influence the size of the upcoming rate cut by the Reserve Bank of New Zealand.
A sharper than expected drop off in inflation could lead to an increase in rate cut expectations. There is a big gap between the November and February meetings of the RBNZ, thus a softer than expected inflation print could see markets price in an aggressive rate cut for February which could weaken the New Zealand Dollar further.
Europe + UK + US
In developed markets, the European Central Bank interest rate meeting will keep the attention of market participants. There has been a stark change over the past month as rate cut bets have significantly increased for the ECB. This has been largely attributed to a wider slow down in the Euro Area while the struggles of Germany continue. At present markets are pricing in around 98% probability that the ECB will cut rates by 25 bps.
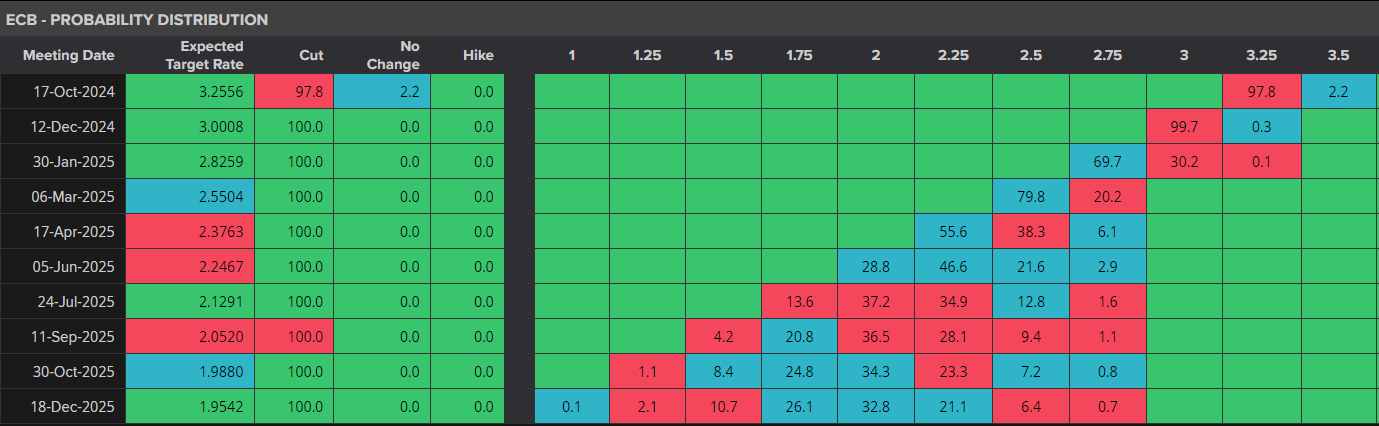
Source: LSEG Refinitiv
In the UK, Wednesday’s CPI figures are crucial as analysts assess the Bank of England’s next steps. Based on the UK Overnight Index Swaps (OIS), investors currently see a 75% likelihood of a 25-basis point cut on November 7, with a 60% chance of an additional cut in December.
The August employment report and September retail sales will be released on Tuesday and Friday. Investors will be looking to see if wage growth slowed down and whether consumers continued to spend last month.
The US finally gets a breather as the US Earnings season will take center stage. A host of banks mentioned above coupled with US retail sales will be the highlights.

Chart of the Week
This week’s focus is back to the US Dollar Index (DXY) as it has run into a key confluence area. The conflicting signals between the technical and fundamental picture makes this even more intriguing to keep an eye on.
The confluence area where the 100-day MA rests around 103.20 should provide a stern challenge for the DXY bulls in the early part of next week. A break above this high will face another confluence area where the 200-day MA rests around 103.65.
Conversely, there is potential for a pullback. The Friday daily candle close may give us more insight into the possibility of an early week pullback in price. A bearish or doji close will increase the probability of a pullback, however as i mentioned any downside may be limited depending on Geopolitical conditions and other external dynamics.
For a more in dept outlook read the US Dollar Index article here
US Dollar Index Daily Chart – October 11, 2024
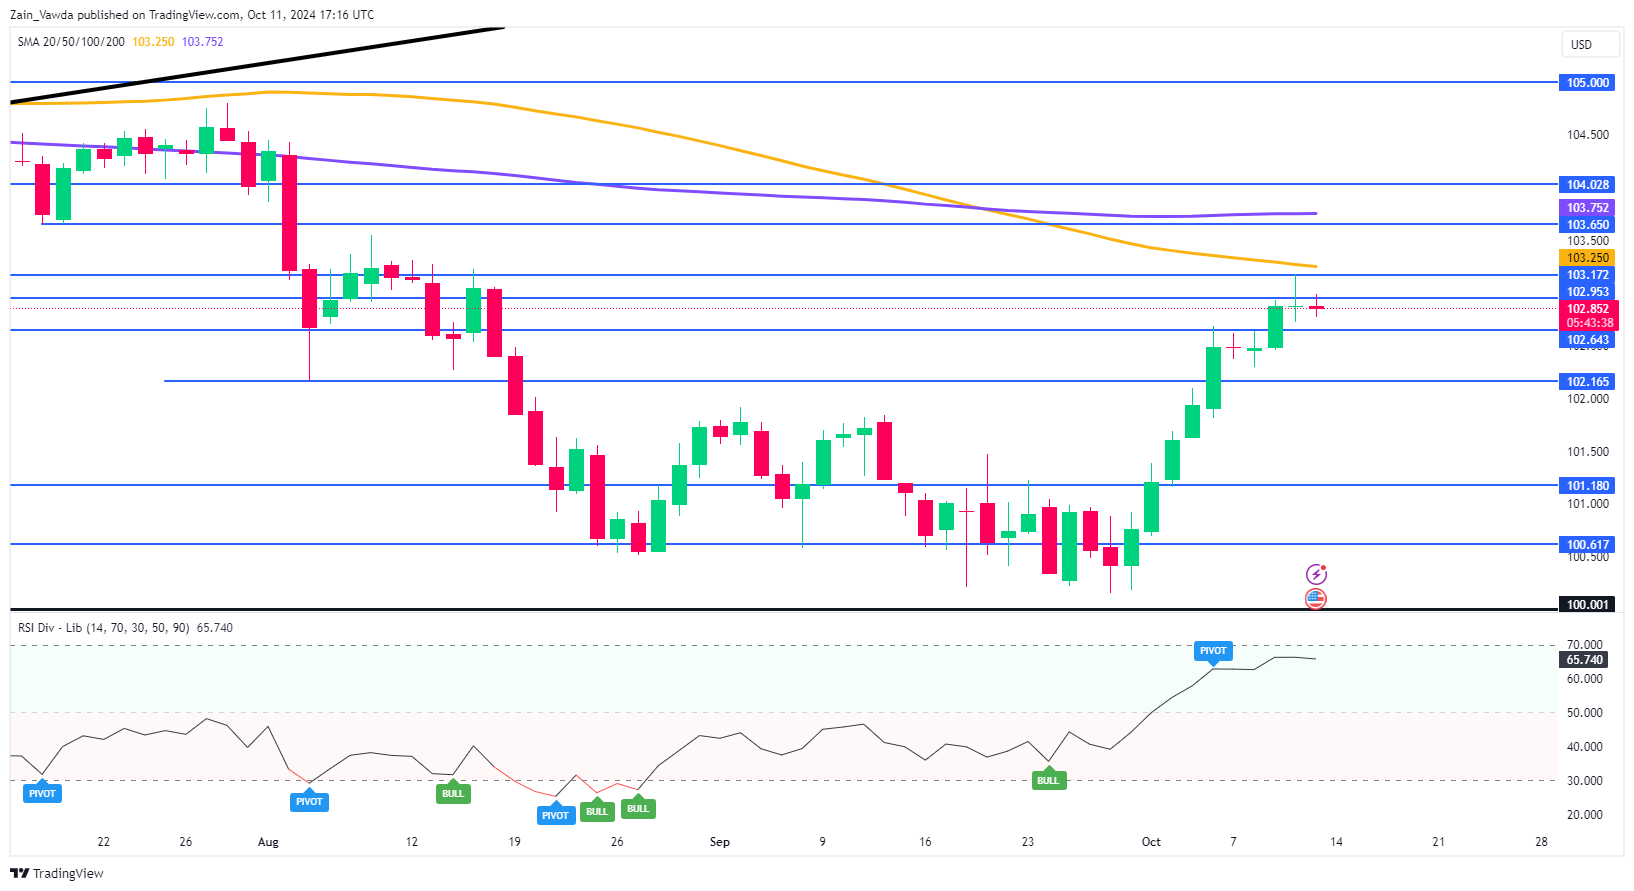
Source: TradingView.Com (click to enlarge)
Key Levels to Consider:
Support:
- 102.60
- 102.16
- 101.18
Resistance:
- 103.20
- 103.65
- 104.00
Another chart that may be of interest in the S&P 500 which hit fresh highs this week. There is a massive triangle technical pattern which is still in play that may be of some interest. For a full technical breakdown, please read the technical section in the October 1 article titled: S&P 500, Nasdaq 100 – Wall Street Slides at the Open as Powell Hints at Modest Rate Cuts
S&P 500 Daily Chart – October 11, 2024
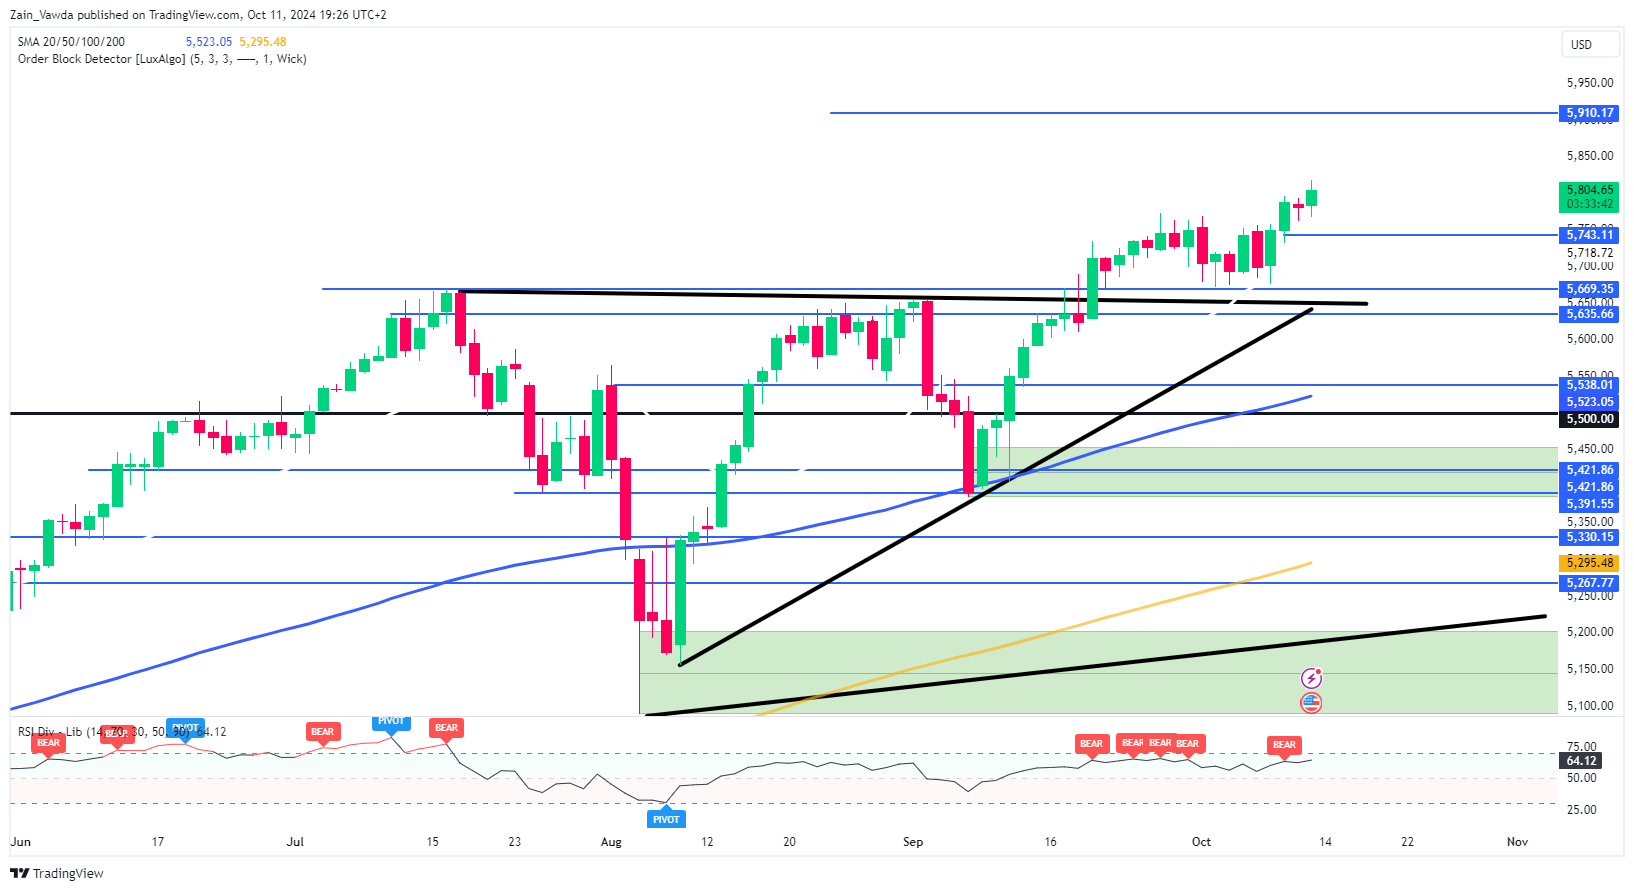
Source: TradingView.Com (click to enlarge)
The Weekly Bottom Line: Rates to Fall, But Not So Fast
U.S. Highlights
- Progress on the inflation front appears to have stalled at the end of the third quarter, as core CPI inflation ticked up, albeit modestly, by 0.1 percentage point to 3.3% year-on-year in September.
- Initial jobless claims surged higher by last week, as states affected by Hurricane Helene (FL, NC) and the ongoing Boeing strike (WA) recorded outsized increases to their unadjusted initial jobless claims.
- Between stronger job growth, and slower progress on inflation, we expect the Fed to cut rates more gradually, with two quarter-point cuts in November and December.
Canadian Highlights
- Canada’s job market defied expectations in September, with the unemployment rate ticking down for the first time since January.
- The better-than-expected jobs data will temper expectations for a 50-basis point cut from the Bank of Canada this month. We expect a 25-basis point reduction in the overnight rate.
- The Bank of Canada’s Business Outlook Survey reaffirms that businesses are feeling the burden of high interest rates, but most are not planning to reduce headcounts and fewer are expecting a recession.
U.S. – Rates to Fall, But Not So Fast
The second week of October continued to reflect the theme that began at last week’s close. A stronger-than-expected payrolls report last Friday drove home the point that the U.S. labor market is holding up better than previously thought, while this week’s CPI report showed progress on the inflation front stalling. All of this suggests that the Fed is likely to slow the pace of rate cuts next month. Bond yields continued the climb higher this week, with the 10-Year yield up another 10 basis points, closing out the week at 4.1%. Equity markets managed to eke out a decent gain, with the S&P 500 up roughly 1% from last week’s close, as of the time of writing.
Total inflation as measured by CPI cooled in September, easing from 2.5% year-on-year (y/y) to 2.4%, largely due to falling energy prices. However, the good news ended there. Core CPI inflation rose a tenth of a percentage point, more than the consensus forecast, which pushed the twelve-month change higher to 3.3% y/y (Chart 1). Price growth in the important ‘shelter’ category eased, though we saw broader price pressures heat up across most other service categories, while core goods prices added to overall inflationary pressure – a first in seven months.
With progress on the inflation front stalling and the labor market holding up well, futures markets are now pricing just an 80% probability that the Fed will cut by 25-basis points next month. Minutes from the last FOMC meeting show that the Fed’s strong start to the easing cycle in September was thought of as a “recalibration” to help bring restrictive monetary policy into “better alignment” with recent indicators of inflation and the labor market, and that this should not be interpreted as the new pace of policy easing over the coming months. We anticipate the Fed will deliver two additional 25 basis point cuts by the end of this year.
However, it’s important to note that the Fed will remain heavily data dependent in setting monetary policy. This will become increasingly difficult over the coming months, with large distortions likely to be seen in October/November data because of Hurricane’s Helene and Milton and the ongoing Boeing strike. Besides the tragic loss of life, the recent hurricanes have left behind a path of destruction in the Southeast, which will exude some near-term weakness.
The impacts of Boeing and Helene appear to already be featuring in employment data, with a sharp jump in initial jobless claims (up 33,000 to a seasonally adjusted 258,000 last week) tied in part to these events. Large increases in initial jobless claims were recorded in affected states such as Florida and North Carolina (Helene) and Washington (Boeing) (see Chart 2). We anticipate the Fed will look past the transient nature of some of these impacts as it continues to ease monetary policy next month, but communication as related to the next cut will require considerable effort given the many factors at play.
Canada – Good news on job market, but businesses remain subdued
Not wanting to be outdone by its southern neighbours, Canada’s jobs data also surprised to the upside this week. Much like last week’s U.S. payroll’s report, September’s Labour Force Survey can only be described as stronger than expected. Employment rose by more than expected in the month and, defying the expectations of most, the unemployment rate fell one tenth to 6.5%. Expectations were for an increase in the unemployment rate to 6.7% (see commentary). While this is positive news on the margin, the overall trend over the last two years is a gradually increasing unemployment rate, with the occasional backtrack in the monthly figures (Chart 1). This development is likely not a game-changer for the outlook. However, it may serve to firm expectations that Canada is closer to a soft landing than recession, and for that reason, it reduces the likelihood that the Bank of Canada will deliver an outsized interest rate reduction in its October decision, like the Federal Reserve did in September.
One reason we don’t see the unexpected positive monthly reading leading to any major dialing back of rate expectations is that the monthly jobs figures have been giving us whiplash for the last several months (Chart 2). The past four months have seen relatively little overall increase in employment, and the changes in part-time and full-time employment in one month have subsequently been undone by the next for four months now. To be sure, September’s jobs gain, which is heavily weighted to full-time employment, will be read as a sign of a labour market that is some distance from faltering. But the past few months of data mean we need to be cautious about reading too much into this.
The Bank of Canada’s Business Outlook Survey for the third quarter was also released on Friday and helps place the September jobs data into context. The overall picture is subdued, but somewhat improved, business conditions compared to last quarter. Firms surveyed by the Bank reported a below-average outlook for sales, but sales expectations have increased since interest rates start declining. Similarly, the share of businesses expecting a recession declined this quarter. Despite these areas of improvement, firms continued to indicate that high interest rates and soft demand were the biggest factors weighing down business conditions. In our view, the Bank of Canada is likely to interpret this survey as supporting the need to continue gradually reducing its policy rate.
This was a light week for Canadian data, today’s two releases being the only major releases all week. Next week, all eyes will be on Tuesday’s inflation data, probably the most important data release before the Bank of Canada’s October decision. Last month, headline inflation came in at 2% on a year-over-year basis, exactly on the Bank of Canada’s target. The jobs report today pushes expectations in the direction of a quarter-point cut in October and we look ahead to the September inflation data for confirmation.
Weekly Economic & Financial Commentary: Inflation’s Bumpy Descent Continues
Summary
United States: Inflation's Bumpy Descent Continues
- A slate of price data left the overall inflation picture little changed this week. Consumer prices came in a touch hotter than expected and producer prices came in a touch cooler, but on trend inflation continues to grind lower. With recent progress slower going and upside risks to inflation remaining, the latest FOMC minutes indicate further “recalibration” of the fed funds rate will proceed more gradually.
- Next week: Retail Sales (Thu.), Industrial Production (Thu.), Housing Starts (Fri.)
International: Mix of Economic Data from Advanced and Emerging Economies
- It was a moderately busy week for international economic data releases. In Japan, wage growth data were generally encouraging, and U.K. monthly GDP figures point to an economy that is continuing to recover. Elsewhere, the Reserve Bank of New Zealand's dovish 50 bps rate cut has led us to forecast more aggressive central bank easing going forward. China's stimulus announcements have disappointed so far, although another announcement is expected this weekend, while inflation slowed by more than expected in Mexico but picked up slightly in Brazil.
- Next week: U.K. CPI (Wed.), European Central Bank (Thu.), China GDP (Fri.)
Credit Market Insights: Consumer Credit Moderates as Interest Expenses Mount
- Consumer reliance on credit moderated in August, as demonstrated by data released this week by the Federal Reserve Board. Overall consumer credit outstanding grew $8.9 billion to a total outstanding balance of $5.1 trillion. The moderation from July’s swift pace of growth of $26.6 billion was primarily driven by a drop in revolving balances, a category largely composed of credit cards.
Topic of the Week: How Will Economic Data Reflect Hurricane Helene and Milton?
- The 2024 hurricane season has devastated many areas in the Southeastern United States. It is too early to get a precise read on the full suite of damages and loss of life caused by Helene and Milton. Yet, we know from times past that severe hurricanes can meaningfully distort economic data.
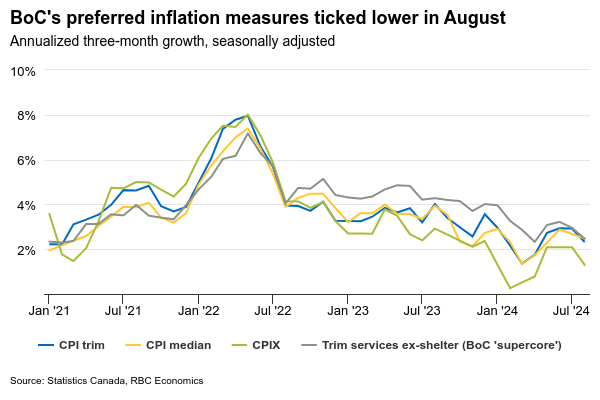
Inflation Expected to Keep Dropping Below 2% in Canada
Falling energy prices in September likely pushed Canadian inflation even lower than in August when the headline consumer price index fell to the Bank of Canada’s 2% target for the first time in more than three years.
Year-over-year headline CPI is expected to have eased to 1.8% in September from 2% in August, while the sub-index that strips out more volatile food and energy components held steady at 2.4%. Bank of Canada’s preferred core inflation measures (CPI trim, median and ‘supercore’) are expected to on balance have dropped lower on a three-month annualized basis. This signals price pressures continued to unwind in line with a very weak near-term outlook for the economy. Gross domestic product growth in Q3 is on track to disappoint, even with the population still growing at an abnormally fast rate.
In the housing market, which is usually more sensitive to interest rate changes relative to other parts of the economy, the reaction has so far been relatively subdued. Early reports from regional real estate boards showed activities in Canada’s largest markets continued to fluctuate in September with a surge in new listings and inventory putting some downward pressure on prices. We don’t expect a big pick-up in the nationwide resale report in the coming week and expect prices to remain below year-ago levels in September.
All of this points to a growing negative output gap, larger amounts of excess supply in the economy and more disinflationary pressures moving forward. That’s not good news for the BoC who’s worried about downside risks to the economy. At a recent forum, Governor Tiff Macklem highlighted how “recent indicators suggest growth may not be as strong as we expected,” and that they wish to see it strengthen to “stick the landing,” and not have inflation drop persistently below the target range.
The communication alludes to the need for bigger rate cuts than the ones we’ve seen so far. We think the next decision from the BoC will be a bigger 50 basis point reduction in the overnight rate on Oct. 23.
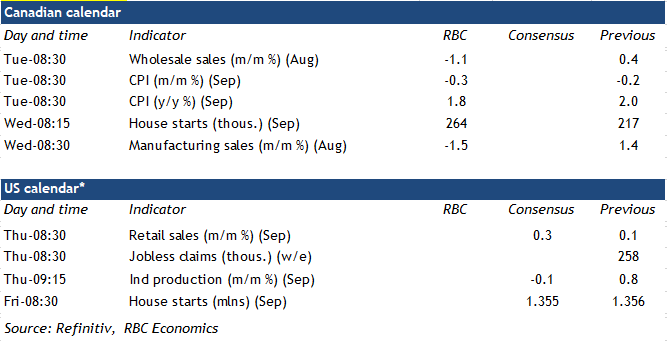
Week ahead data watch
On Tuesday, we expect August core wholesale sales to drop 1.1% in line with Statistics Canada’s early indicator. Sales declines were widespread with lower sales in five out of the seven subsectors.
August manufacturing sales on Wednesday also likely fell by 1.5%, mainly driven by lower sales of petroleum and coal products, and in primary metal subsectors.
Canadian housing starts on Wednesday likely came in at 264,000 in September, up 21% from the prior month and offsetting the decline in August.
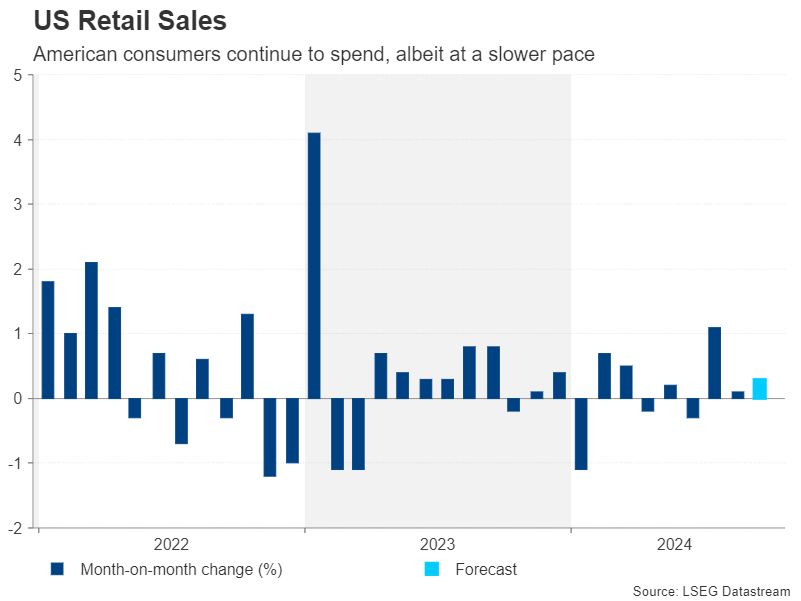
On Thursday, U.S. retail sales likely accelerated in September given auto sales were higher. But, sales at gas stations were lower during that month due to lower gas prices.
U.S. industrial production likely came in flat in September, down from 0.8% in August. Lower output in utility and motor vehicle sectors contributed to most of the slowdown.
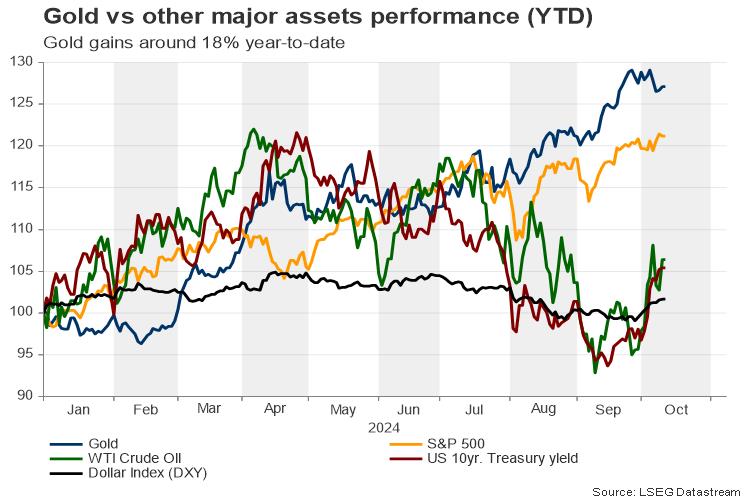
What’s in Store for Gold in Q4?
- Gold outperforms other asset classes; provides protection against risk events
- Tailwinds could persist as Q4 agenda includes US election, Fed policy, and geopolitical risks
- Technical outlook remains positive; another bull run could commence
Previously in Q3
It’s a golden age for gold which has been exhibiting an unprecedented performance so far this year, adding another 14% to its value in the third quarter despite global central bank reserves stabilizing, to trade up by 42% year-on-year. That’s even higher than the 32% annual return in the S&P 500.
Fed rate cuts, recession risks in Q4
The final quarter of the year is already underway, and it could be volatile as investors are still missing answers on a couple of topics.
The rate cut story might be a key catalyst for the gold rally. It only took an upbeat jobs report to cast doubt on future rate cut expectations. Investors completely gave up hope for additional 50bps reductions after employment growth rose to a six-month high, the unemployment rate dropped to 4.1% and wage growth accelerated. In addition, they even started to doubt the need for further reductions at the next meeting. Treasury yields surged above 4.0%, a level not seen since July, while gold pulled back only moderately due to the simultaneous escalation of rocket attacks between Israel and Iran.
The services side of the US economy behaves like interest rates are still accommodative. Nevertheless, it is worth mentioning that the unemployment rate is a lagging indicator that confirms changes rather than predicting them. Hence, the improvement in the jobs data should not be taken in earnest. Besides, Thursday’s negative reaction to the latest weekly jobless claims suggested that investors are not convinced that the labor market is on full steam.
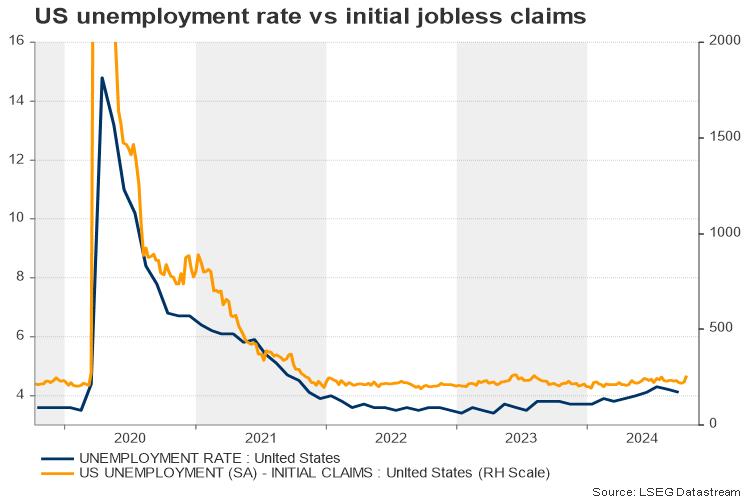
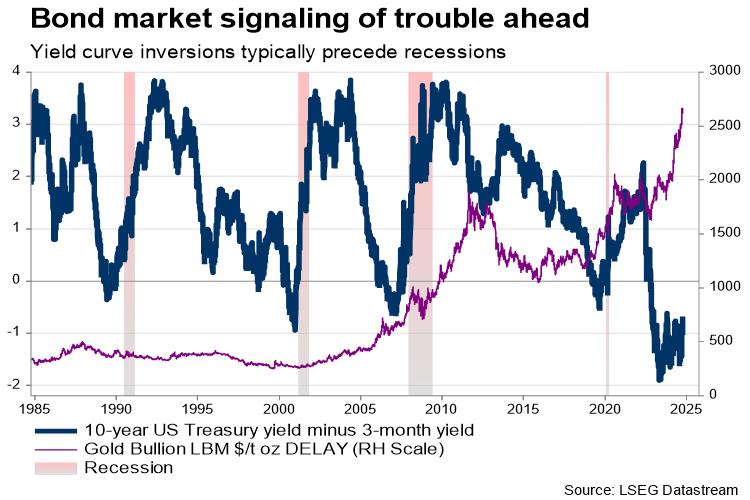
All in all, there are still some signs of economic softness which cannot be ignored, including the rising delinquency rates in credit cards and mortgage loans, the contracting ISM manufacturing PMI numbers, and the inverted curve between 3-month and 10-year bond yields, which is not always a reliable indicator but it’s been typically inverted between six months and two years before a recession started. Note that the inversion has been holding for more than a year so far.
Should inflation resume its downtrend, and the labor market starts to show cracks, prompting more rate reductions in the coming months, gold could receive fresh buying interest. Otherwise, a rebound in inflation accompanied by a resilient labor market may delay further rate cuts.
US federal election
The US federal election will be the next hot topic in global markets. Note that the scenario of a second Trump term is not fully priced in yet, with polls showing a marginal advantage of 2-3% for Kamala Harris, which could be easily reversed.
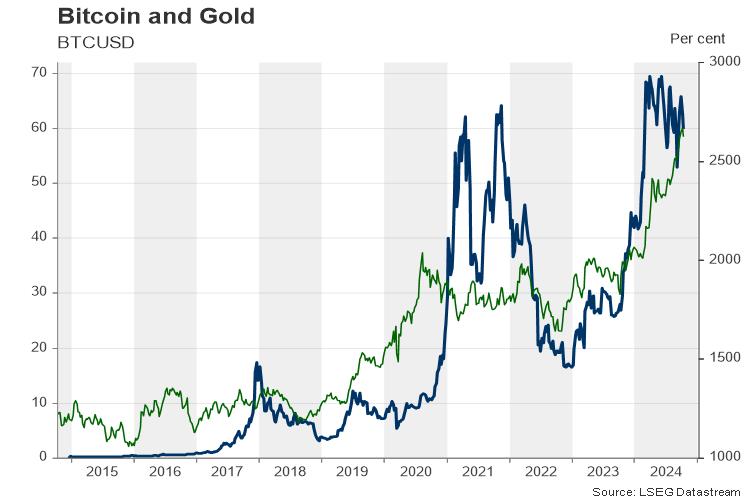
Trump’s presidency could prove inflationary if republicans deliver their promised huge corporate tax reductions through Congress. As global competition for AI heats up, a restrictive stance against China could harm Wall Street, leading traders to seek safety in assets like gold. In this case, bitcoin might restore its connection with the precious metal given Trump’s support to the crypto market.
On the other hand, Harris has little experience with foreign affairs and comes from the pro-trade region of California, creating speculation that she may prevent US-China relations from blowing up. It’s evident that she desires the US to have the leading role in the 21st century and could potentially join the tough-on-China campaign, albeit with a more balanced Biden-like strategy, which may have minimal impact on precious metals.
Geopolitical risk
The geopolitical noise in the Middle East could remain a hot topic in Q4. Israel has provided little information about its retaliation against Iran’s latest massive missile attack, saying that the response “will be lethal, precise and surprising”.
It seems that Hezbollah is in favor of a ceasefire agreement without making it contingent on ending the war in Gaza, but Netanyahu’s unwavering use of force gives little assurance that a deal will be reached soon. Therefore, as long as the tit-for-tat violence continues, things could still go worse even though an attack against Iran’s oil facilities has been put on the sidelines for now and perhaps until the next US president is elected.
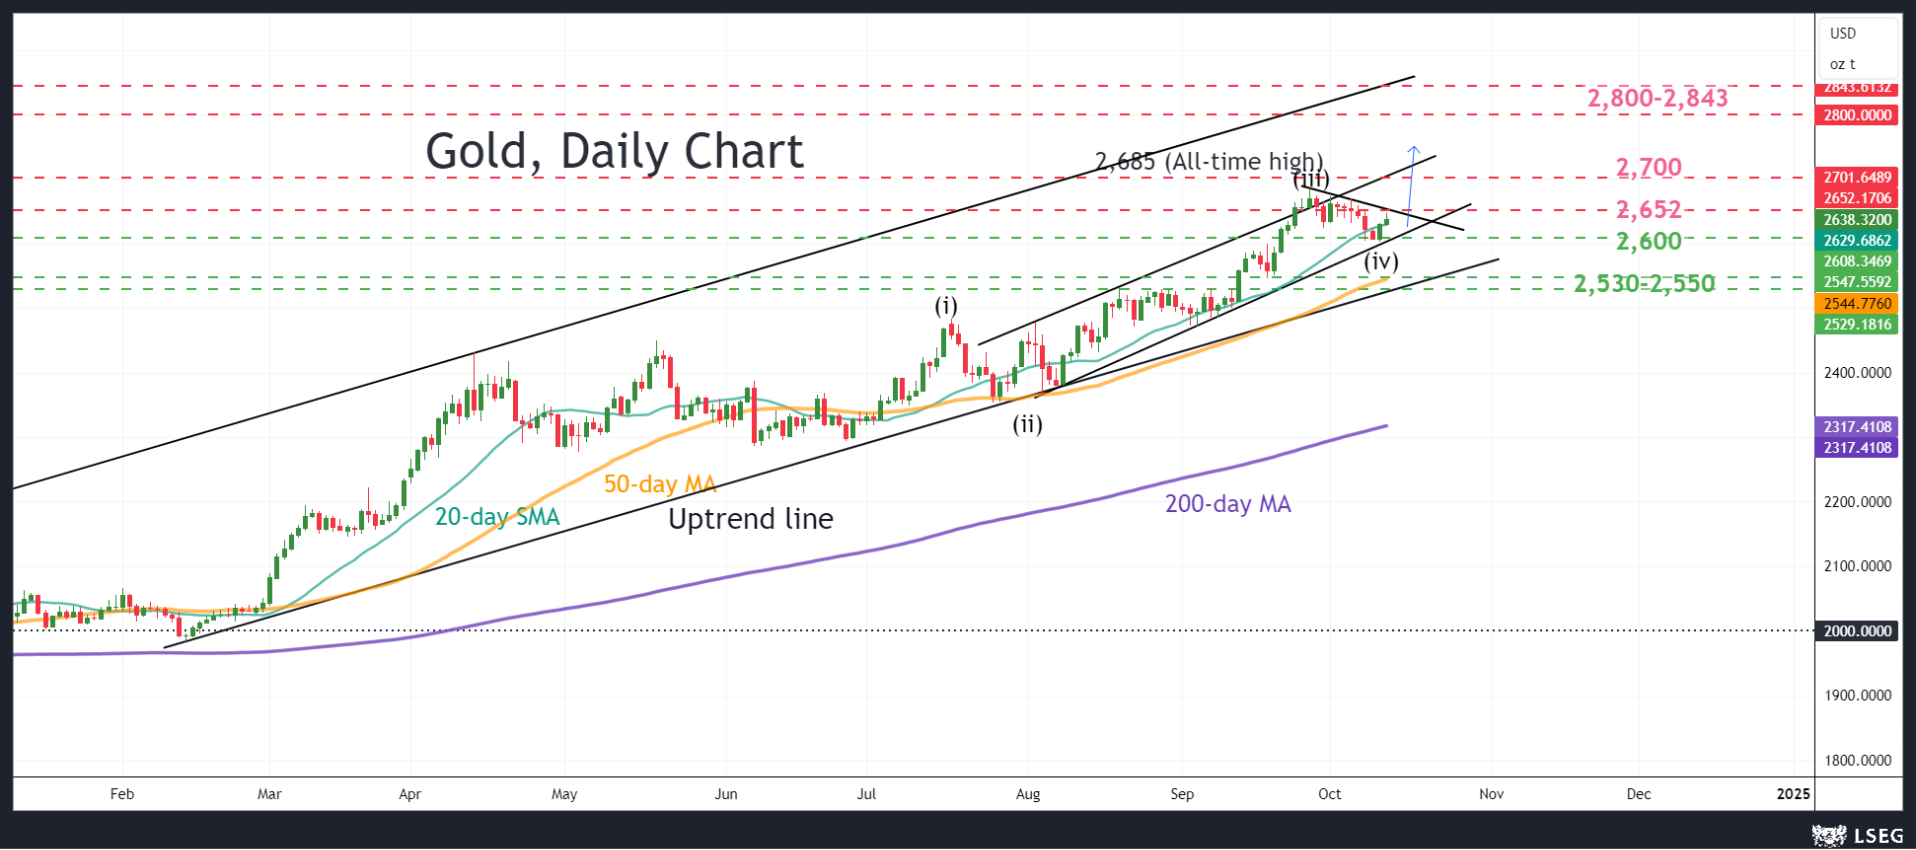
Gold’s technical outlook
From a technical perspective, gold’s upward trajectory seems to be well following a bullish 1-5 Elliot wave pattern. The latest pullback in the price could be the wave 4. If the price slips below the $2,600 region, the decline could expand towards the crucial support area of $2,530-$2,550 before the final wave 5 starts.
Alternatively, a bounce back above the 20-day simple moving average (SMA) and the $2,635 area could initially see a test near $2,652. Even higher, the price might print a new record high around $2,700. Then, the door could open for the $2,800-$2,843 area.
Week Ahead – ECB Headed Towards Another Cut, CPI on the Agenda Elsewhere
- The ECB is expected to deliver its first back-to-back rate cut on Thursday
- CPI data incoming in Canada, China, Japan, New Zealand and UK
- China GDP and US retail sales also high on investors’ radar
Is an ECB rate cut a done deal?
Following the RBNZ, which cut interest rates by 50 basis points this Wednesday, the central bank torch will be passed next week to the ECB. Although last time, President Lagarde and her colleagues did not back an October rate cut, their stance started to shift following the disappointing PMIs and the slide in headline inflation below 2%, prompting market participants to increase bets of such an action.
Currently, investors are nearly fully pricing in a quarter-point reduction at Thursday’s gathering, while expecting another one in December. Thus, a quarter-point reduction on its own is unlikely to shake the euro, and if it is indeed delivered, the spotlight will quickly turn to President Lagarde’s press conference.
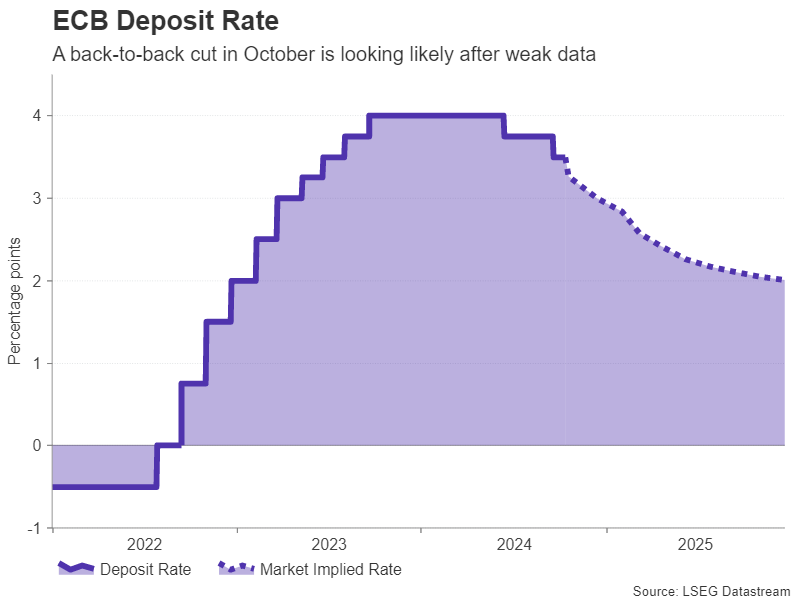
This is one of the meetings that are not accompanied by updated macroeconomic projections but Lagarde is bound to receive questions on how the economic and inflation outlooks have changed since the September gathering. Recently, she said that their confidence about inflation returning to target will be reflected at the upcoming gathering, reinforcing expectations of further easing in both October and December.
Therefore, if a 25-bps rate cut is delivered and Lagarde keeps the door open to another one in December, the euro is likely to extend its latest slide. Following the robust US jobs report for September, euro/dollar fell below the round number of 1.1000, completing a double top formation. A dovish ECB decision may allow the slide to continue towards the low of August 8 at 1.0880.
Having said all that though, a rate cut at this gathering could be less obvious than market pricing suggests. A couple of weeks ago, a Reuters report noted the doves will fight for a rate cut, but they might face resistance from the hawks. Some sources talked about a compromise solution in which rates are kept on hold in October but reduced in December if the data doesn’t improve.
Adding to the uncertainty were comments by ECB Vice President de Guindos that it is too early to claim victory on inflation. The flash estimates showed that inflation fell to 1.8% in September. If confirmed in Thursday’s final readings, this would nevertheless be in line with the ECB’s own projections, while the latest rebound in oil prices due to the Middle East tensions poses upside risks to the outlook.
Therefore, if policymakers indeed agree to wait until December, euro/dollar is likely to rebound strongly as investors get caught off guard. A return above 1.1025 could dismiss the bearish reversal and allow more buyers to enter the game.
UK CPI awaited as pound struggles
The pound has been consolidating over the past week, pausing the selloff that was triggered by BoE Governor Bailey’s remarks that they may need to be more active with regards to interest rate cuts if the data continues to suggest progress in inflation.
With that in mind, pound traders are likely to pay extra attention to next week’s releases, particularly Wednesday’s CPI numbers, as they try to figure out how the Bank of England will proceed from here onwards. According to the UK Overnight Index Swaps (OIS), investors are assigning a strong 75% chance for a 25-bps cut on November 7, with the probability of another one in December resting at around 60%.
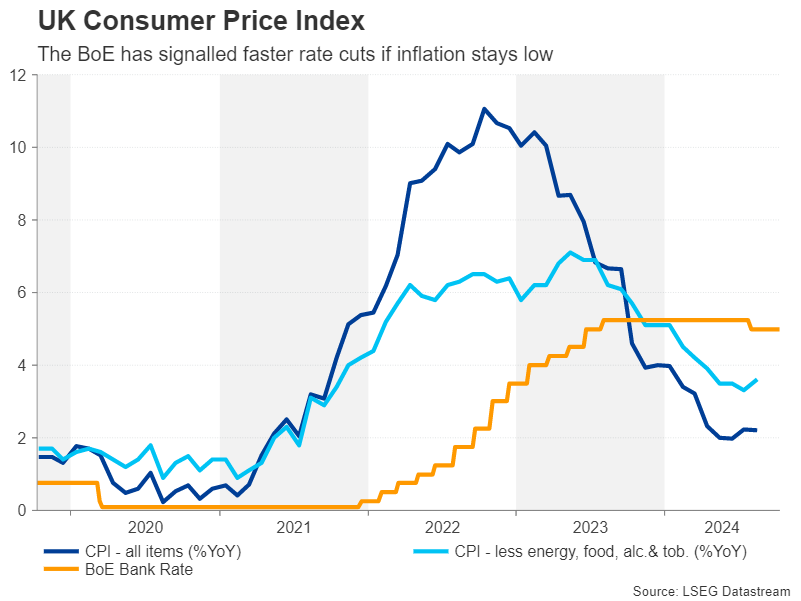
The September PMIs revealed that price pressures across the private sector eased to a 42-month low in September, pointing to a decline in both headline and core CPI, especially the former, as the year-on-year change in oil prices dipped further into negative territory. A further cooldown in inflation may prompt traders to add to their BoE rate cut bets and thereby push the pound lower.
The employment report for August and retail sales for September will also be published next week, on Tuesday and Friday respectively. Investors will be watching to see how much further wage growth moderated over the period and if consumers kept spending last month.
Quieter US data week makes way for earnings
Across the Atlantic, both the Fedspeak and data schedule will quieten down, potentially keeping dollar traders on the sidelines. September retail sales due on Thursday will be the main highlight. But manufacturing gauges by the New York Fed (Monday) and Philadelphia Fed (Thursday) will also be important. Coming up on Thursday too is industrial production for September, while on Friday, building permits and housing starts might attract some attention.
With investors becoming jittery about the possibility of the Fed easing policy at a somewhat slower pace than what is priced in right now, a stronger-than-expected retail sales report might not be greeted too positively by the markets as it would further dampen rate cut bets. Analysts are forecasting a month-on-month increase of 0.3% in September, after a 0.1% rise the prior month.
For Wall Street, however, corporate earnings will probably be a bigger focus as the Q3 season gets underway. Netflix will be among the first of the Big Tech to report its earnings on Thursday.
Canadian and NZ CPI may decide size of next rate cuts
North of the border, Canadian inflation numbers out on Tuesday will be crucial for the Bank of Canada’s policy decision on October 23. Investors have priced in around one third probability that the BoC will slash rates by 50 bps, while a 25-bps cut is fully baked in. Any surprises therefore in the CPI readings for September may sway policymakers either way.
The Canadian dollar has taken quite a beating against the US dollar this month so traders might react more strongly to a hotter-than-expected report given the oversold conditions.
New Zealand will be another country getting an inflation update. CPI figures for the third quarter are due on Wednesday and could determine the size of the next cut by the Reserve Bank of New Zealand. Policymakers reduced borrowing costs by 50 bps at their October meeting and a further such reduction is projected for November.
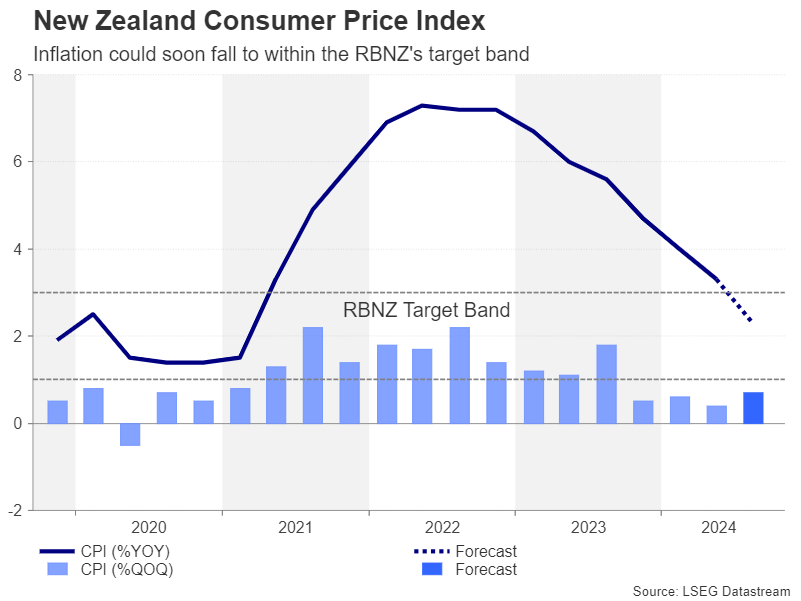
However, with a long gap between the RBNZ’s November and February meetings, investors might start to price in a larger 75-bps cut if the Q3 stats show a larger-than-forecast drop in inflation, which looks set to fall within the Bank’s 1-3% target band.
Yen may shrug off Japanese CPI
In Japan, the question on interest rates is about a hike rather than a decrease. But Friday’s CPI data is unlikely to change the near-term picture on the price outlook and some traders might prefer to keep an eye on Wednesday’s machinery orders and Thursday’s trade figures for signs that the Japanese economy is maintaining the positive momentum, which is vital if inflation is to hold above the Bank of Japan’s 2% target sustainably.
Hence, it’s hard to see a significant reaction in the yen and a bigger driver for the safe-haven currency will probably be broader risk sentiment – something Chinese data will have a big say on.
Will Chinese GDP matter after stimulus blitz?
China will publish Q3 GDP numbers on Friday where growth is forecast to have slowed slightly from 4.7% to 4.6% y/y. Industrial production and retail sales prints for September are also due the same day, while ahead of all that, CPI and PPI figures will be released on Sunday, followed by trade indicators on Monday.
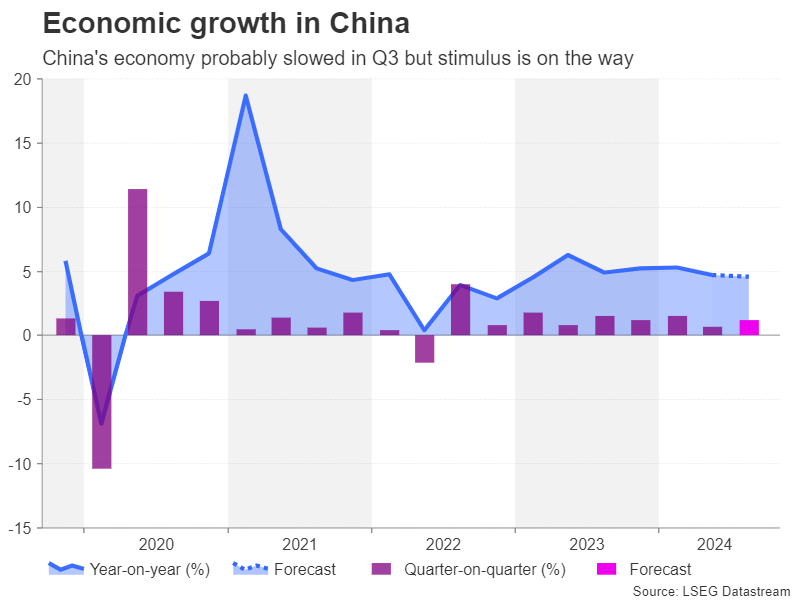
Following the stimulus measures unveiled recently by Beijing, a disappointing GDP print might not spur much panic in the markets. Furthermore, with a further announcement expected on Saturday and Monday, the upcoming data might be overlooked unless the slowdown in Q3 was far worse than feared.