Sample Category Title
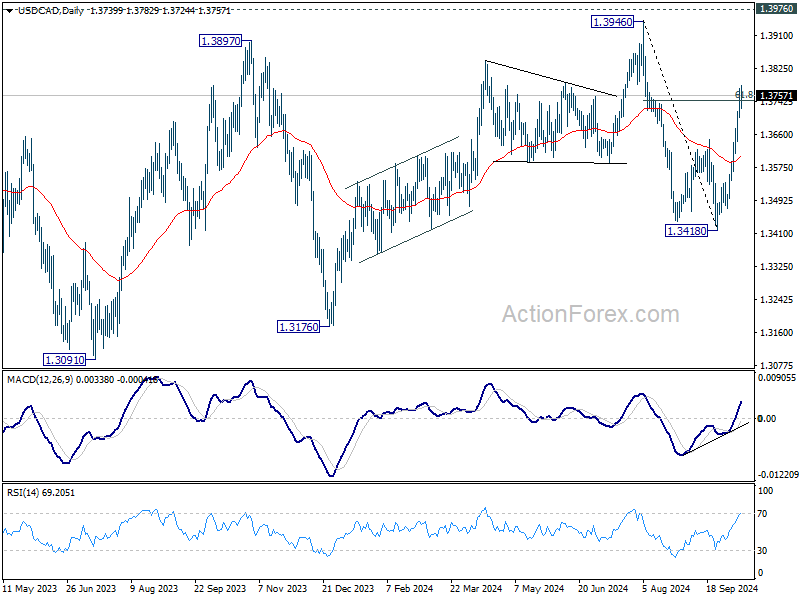
USD/CAD Mid-Day Outlook
Daily Pivots: (S1) 1.3695; (P) 1.3735; (R1) 1.3782; More...
Outlook in USD/CAD is unchanged and intraday bias stays on the upside for the moment. Sustained trading above 61.8% retracement of 1.3946 to 1.3418 at 1.3559 will extend the rise from 1.3418 to 1.3946 high again. On the downside, below 1.3702 minor support will turn intraday bias neutral first.
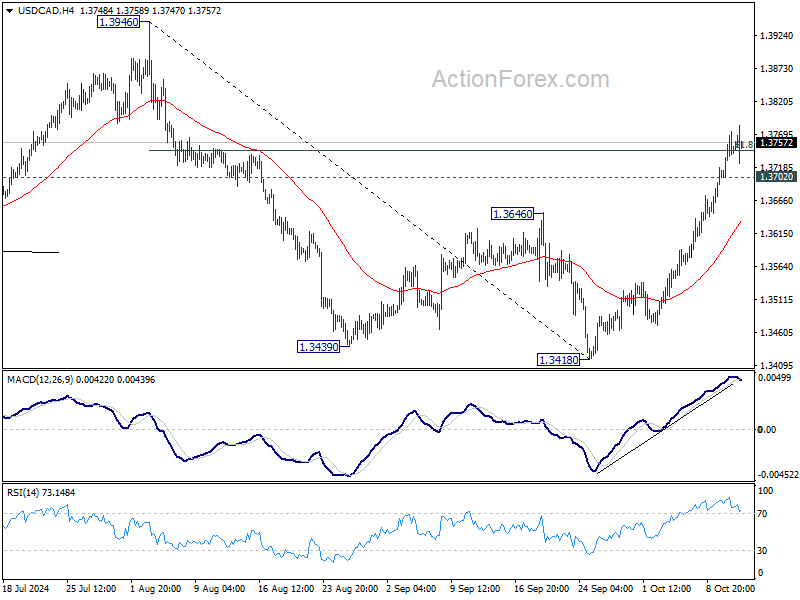
In the bigger picture, sideway consolidation pattern from 1.3976 (2022 high) might still extend further. While another decline cannot be ruled out, strong support should emerge above 1.2947 resistance turned support to bring rebound. Rise from 1.2005 (2021 low) is still in favor to resume at a later stage.
Muted Trading as Canadian Dollar Fails to Bounce on Strong Job Data
Trading in the early US session is relatively subdued, with little momentum driving market moves. Canadian Dollar, despite an initial attempt to rally on the back of stronger-than-expected job data, has not been able to attract sustained buying interest. The market continues to price in further easing from BoC, as expectations mount that the central bank will lower interest rates to a neutral level within a year's time, from the current 4.25%. This sentiment persists even as Canada's labor market displays resilience.
Meanwhile, Dollar has shown little reaction to PPI data released. US equity futures indicate a flat open as traders prepare for a long weekend, a scenario that typically leads to cautious positioning. On the bond front, 10-year Treasury yield has extended its near-term rally, pushing past the 4.1% mark. While rising yields have offered the greenback a mild lift against Yen, the critical 150 level for USD/JPY remains unbroken, as traders appear reluctant to test the psychological threshold before the weekend.
In Europe, at the time of writing, FTSE is down -010%. DAX is up 0.21%. CAC is up 0.08%. UK 10-year yield is up 0.0333 at 4.249. Germany 10-year yield is up 0.034 at 2.293. Earlier in Asia, Nikkei rose 0.57%. Hong Kong was on holiday. China Shanghai SSE fell -2.55%. Singapore Strait Times fell -0.32%. Japan 10-year JGB yield fell -0.007 to 0.952.
US PPI at 0.0% mom, 1.8% yoy in Sep
US PPI for final demand was unchanged for the month in September, below expectation of 0.1% mom rise. PPI services rose 0.2% mom but PPI goods fell -0.2% mom. PPI less foods, energy, and trade services rose 0.1% mom.
For the 12-month period, PPI rose 1.8% yoy, down from prior 1.9% yoy, but above expectation of 1.8% yoy. PPI less foods, energy, and trade services rose 3.2% yoy.
Canada's employment grows 46.7k in Sep, unemployment rate falls to 6.5%
Canada's employment grew 46.7k in September, above expectation of 34.5k. Full-time employment rose 112k or 0.7% mom, largest gain since March 2022. Part-time work fell -65k or -1.7%.
Unemployment rate fell from 6.6% to 6.5% better than expectation of 6.6%. Participation rate fell -0.2% to 64.9%. Total hours worked, however, fell -0.4% mom. Average hourly wages rose 4.6% yoy, slowed from 5.0% yoy.
UK GDP grows 0.2% mom in Aug, matches expectations
UK GDP grew 0.2% mom in August, matched expectations. Services output grew by 0.1% mom. Production output grew by 0.5% mom. Construction output grew by 0.4% mom.
In the three months to August compared with the three months to May, GDP grew 0.2%. Service output rose 0.1%. Production output showed no growth. Construction output rose 1.0%.
New Zealand BNZ PMI rises to 46.9, but stays in contraction for 19th month
New Zealand’s BusinessNZ Performance of Manufacturing Index rose slightly from 46.1 to 46.9 in September, marking the third consecutive month of improvement. Despite this, the sector remains in contraction for the 19th straight month, with the index still well below the long-term average of 52.6.
Catherine Beard, Director of Advocacy at BusinessNZ, highlighted that while it’s positive to see the highest PMI result since April, the sector faces a "long and slow road" to recovery.
The components painted a mixed picture: production improved from 46.6 to 48.0, while employment dipped slightly from 46.8 to 46.6. New orders also inched higher from 47.3 to 47.8, but deliveries fell further from 45.8 to 45.6.
Negative sentiment among respondents is gradually improving, with 63.5% expressing pessimism in September, down from 64.2% in August and significantly lower than the 76.3% seen in June. The main concerns continue to revolve around weak demand, with many businesses citing a lack of orders and sales as key issues.
USD/CAD Mid-Day Outlook
Daily Pivots: (S1) 1.3695; (P) 1.3735; (R1) 1.3782; More...
Outlook in USD/CAD is unchanged and intraday bias stays on the upside for the moment. Sustained trading above 61.8% retracement of 1.3946 to 1.3418 at 1.3559 will extend the rise from 1.3418 to 1.3946 high again. On the downside, below 1.3702 minor support will turn intraday bias neutral first.
In the bigger picture, sideway consolidation pattern from 1.3976 (2022 high) might still extend further. While another decline cannot be ruled out, strong support should emerge above 1.2947 resistance turned support to bring rebound. Rise from 1.2005 (2021 low) is still in favor to resume at a later stage.
US PPI at 0.0% mom, 1.8% yoy in Sep
US PPI for final demand was unchanged for the month in September, below expectation of 0.1% mom rise. PPI services rose 0.2% mom but PPI goods fell -0.2% mom. PPI less foods, energy, and trade services rose 0.1% mom.
For the 12-month period, PPI rose 1.8% yoy, down from prior 1.9% yoy, but above expectation of 1.8% yoy. PPI less foods, energy, and trade services rose 3.2% yoy.
Canada’s employment grows 46.7k in Sep, unemployment rate falls to 6.5%
Canada's employment grew 46.7k in September, above expectation of 34.5k. Full-time employment rose 112k or 0.7% mom, largest gain since March 2022. Part-time work fell -65k or -1.7%.
Unemployment rate fell from 6.6% to 6.5% better than expectation of 6.6%. Participation rate fell -0.2% to 64.9%. Total hours worked, however, fell -0.4% mom. Average hourly wages rose 4.6% yoy, slowed from 5.0% yoy.
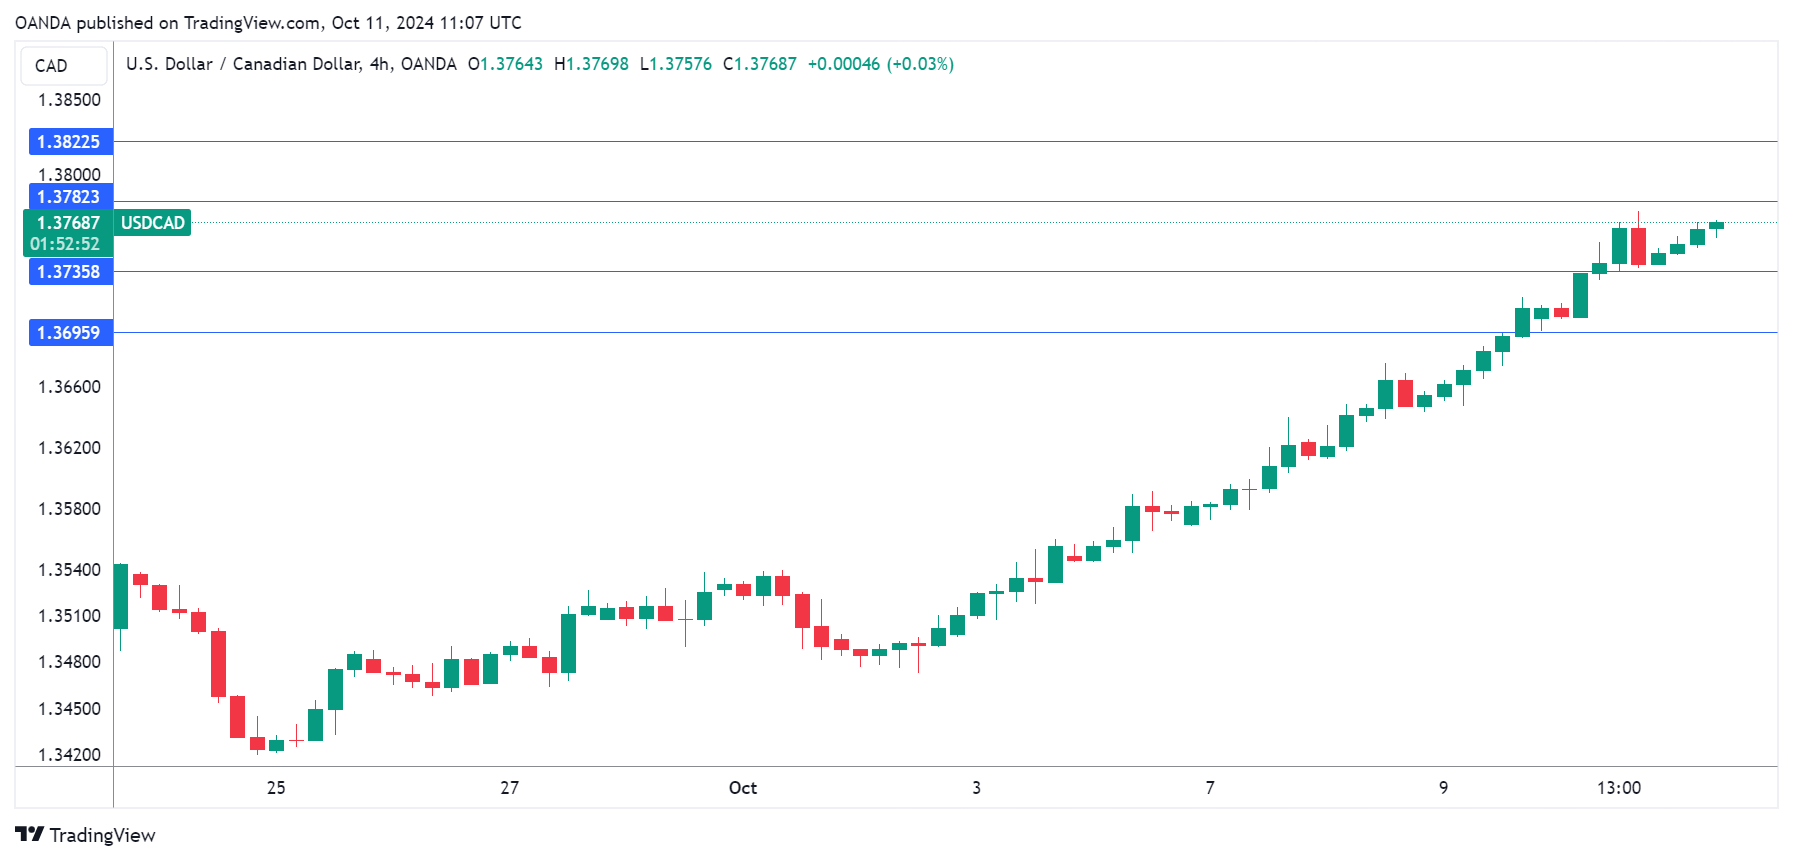
USD/CAD Pushes Higher, Canadian Employment Next
The Canadian dollar has edged lower on Friday. In the European session, USD/CAD is trading at 1.3767 at the time of writing, up 0.19%.
The Canadian dollar has hit a rough patch and is on a seven-day slide in which it has fallen 1.6%. On Thursday, the Canadian dollar weakened to 1.3775, its lowest level against the US dollar since August 7.
Canada’s job growth expected to rise slightly
Canada releases the September employment report later today, with no dramatic changes expected. Job growth is expected at 27 thousand, compared to 22.1 thousand in August. The unemployment rate is projected to tick up to 6.7%, following 6.6% in August.
The Bank of Canada has been a leader in the new rate-cutting cycle, having already cut rates by a quarter-point three times this year. This has brought the cash rate down to 4.25% but the economy has been slow to respond and the BoC is expected to continue cutting rates. The BoC doesn’t want rates to diverge to widely from those in the US and will be keeping a close eye on the Fed’s expected cuts in November and December.
The US ends the week with the producer price index for September, which could be a mixed bag. Headline PPI is expected to tick lower to 1.7% y/y, compared to 1.6% in August. The core rate, however, is projected to rise to 2.7%, up from 2.4% in August. With inflation largely beaten, the Federal Reserve’s primary focus has shifted from inflation to employment. Still, an unexpected PPI reading in either direction could have an impact on the movement of the US dollar today.
USD/CAD Technical
- There is resistance at 1.3782 and 1.3822
- 1.3735 and 1.3695 are the next support levels
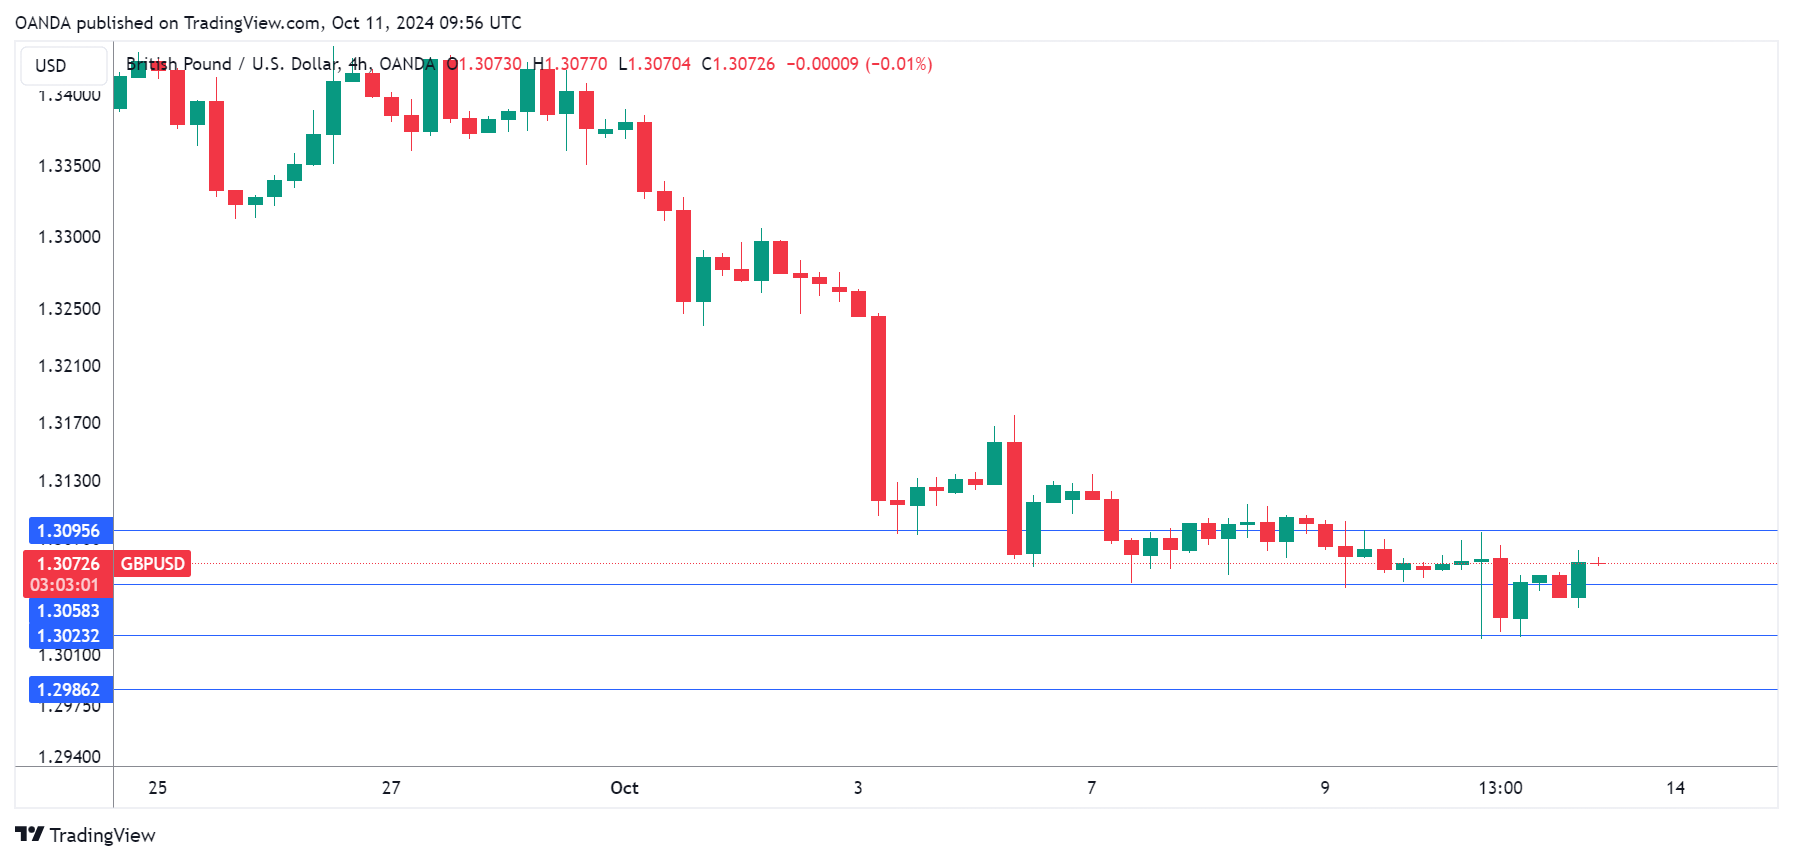
Pound Shrugs as UK Economy Grew by 0.2%
The British pound is showing little movement on Friday in what has been a very quiet week for the currency. In the European session, GBP/USD is trading at 1.3071, up 0.10% on the day and its lowest level.
The UK economy showed slight improvement in August with a 0.2% m/m gain, after no growth in both June and July. This was in line with expectations and the pound’s reaction has been muted. Services, construction and manufacturing were all in positive territory, as the economy continues to show signs of growth. On a yearly basis, GDP rose 1%, up from a revised 0.9% in August but shy of the market estimate of 1.4%.
The slight rebound in the economy comes at a convenient time for the government, which will release the autumn Budget on October 30. The government is counting on the Bank of England to continue cutting rates in order to boost economic growth. Finance Minister Rachel Reeves has said that kick-starting the weak UK economy is the “number one priority.
The Bank of England delivered its first rate cut of the new cycle in August but stayed on the sidelines in September. The next meeting is on November 7 and the UK releases inflation and employment data ahead of the meeting, which will likely determine whether Bank policy makers feel comfortable making another quarter-point cut.
The US wraps up the week with the producer price index for September. Headline PPI is expected to tick lower to 1.7% y/y, compared to 1.6% in August. The core rate, however, is projected to rise to 2.7%, up from 2.4% in August. With inflation largely beaten, the Federal Reserve’s primary focus has shifted from inflation to employment. Still, an unexpected PPI reading in either direction could have an impact on the movement of the US dollar.
GBP/USD Technical
- GBP/USD is testing resistance at 1.3058. Above, there is resistance at 1.3095
- 1.3023 and 1.2986 are the next support levels
US Dollar Index (DXY) Outlook: Dollar Bulls to Take a Breath or PPI Data to Extend Rally?
- The US Dollar Index (DXY) is in an intriguing position after mixed price action and ahead of PPI data.
- The future of the dollar may be influenced by external factors like oil prices and Middle East tensions.
- Technically, the DXY is facing resistance and a potential pullback, but underlying fundamentals remain supportive.
The US Dollar Index (DXY) continued its ascent yesterday to tap a fresh high before finishing the day flat. Some mixed price action thus far this morning leaves and PPI data ahead leaves the Dollar in an intriguing position.
The FED minutes and US CPI releases have kept the greenback largely supported this week as safe haven demand waned. The data itself was a mixed bag but has raised questions about Fed rate cuts moving forward, which has been a positive for the greenback.
CPI inflation came in higher than expected, with the core rate increasing from 3.2% to 3.3% year-on-year, thanks to a second straight 0.3% monthly rise. In ideal trading conditions, this would boost the dollar, but this did not materialize.
US Core Inflation Rate YoY
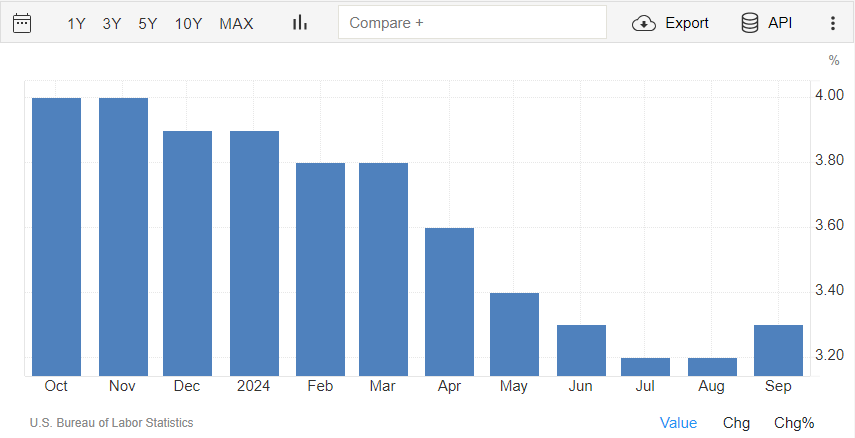
Source: TradingEconomics
The explanation could be down to the shifting focus to the jobs market. This seems to be the narrative since the downward revisions in jobs data a few months back. In such an instance CPI figures matter less. The unexpected rise in jobless claims could possibly due to the extreme weather, had a negative effect on the dollar.
It appears the US Dollar could be entering a new phase of ‘wait and see’ which would leave the DXY caught in a range. At present outside influences and developments could impact the longer term trajectory of the US Dollar and Fed rate path.
A continued rise in Oil prices or an attack on Iranian energy facilities could lead to a surge in inflationary pressure and remains a key concern in the near term. An escalation in Middle East tensions is a double edged sword, as it could help stir up inflation, while at the same time potentially seeing the US Dollar benefit from safe haven demand.
Developments around the US Dollar and Dollar Index (DXY) have a wide impact on markets. Interesting times ahead for market participants with the US elections drawing near as well.
Technical Analysis – US Dollar Index
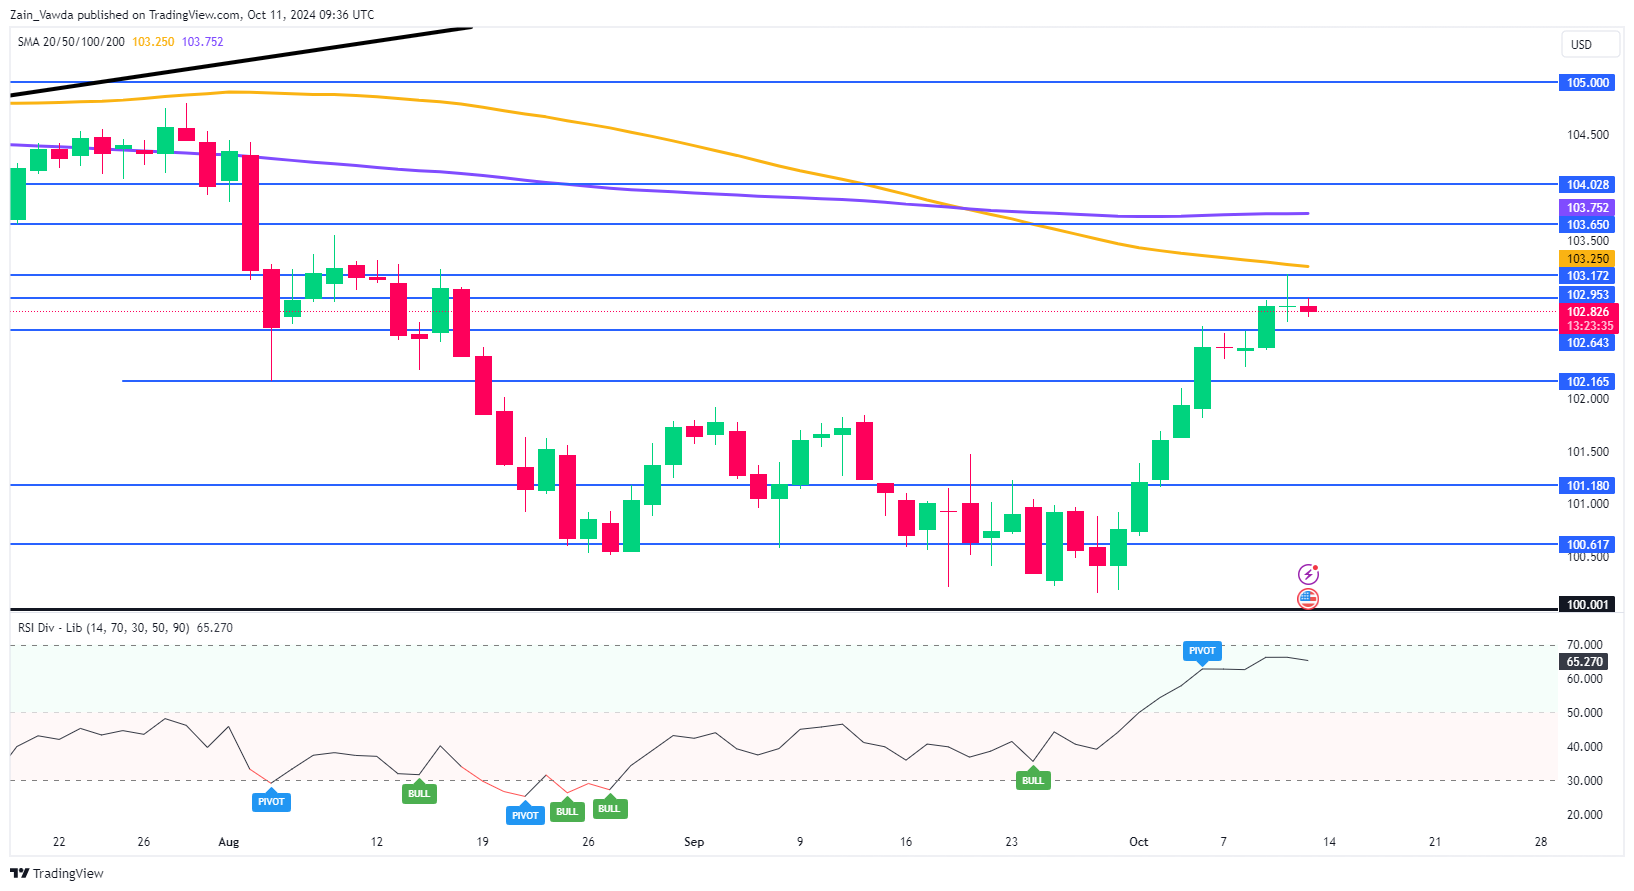
The US dollar’s rally has been an impressive one, rising from the ashes to wipe out around six weeks of losses in around a week and a half (9 days). The DXY has however run into a key confluence area and is facing the growing threat of a pullback.
Yesterday saw the daily candle close as a doji, which does hint that a potential reversal may be on the way. As mentioned the overarching fundamentals do continue to keep the US Dollar supported and could limit any potential downside.
Immediate resistance rests at 102.95 before the key confluence area around 103.200 comes into focus. A break above the 100-day MA could be a big deal given that we traded below it since the middle of July. Would a break above be the start of a similar two and a half month trend to the upside?
Conversely, support is provided by 102.64 and 102.165, while particular attention should be given to the breakout area around 101.80.
US Dollar Index Chart, October 11, 2024
Source: TradingView (click to enlarge)
Support
- 102.64
- 102.16
- 101.80
Resistance
- 102.95
- 103.20
- 103.70
Crypto Gets Hammered in America, Rebounds in Asia
Market Picture
The cryptocurrency market lost 0.2% in 24 hours to $2.12 trillion but saw a fresh drop in the US session during the day before rebounding on buying in lower volumes in Asian trading on Friday morning. The Sentiment Index fell to its lowest level in over a month at 32 (fear).
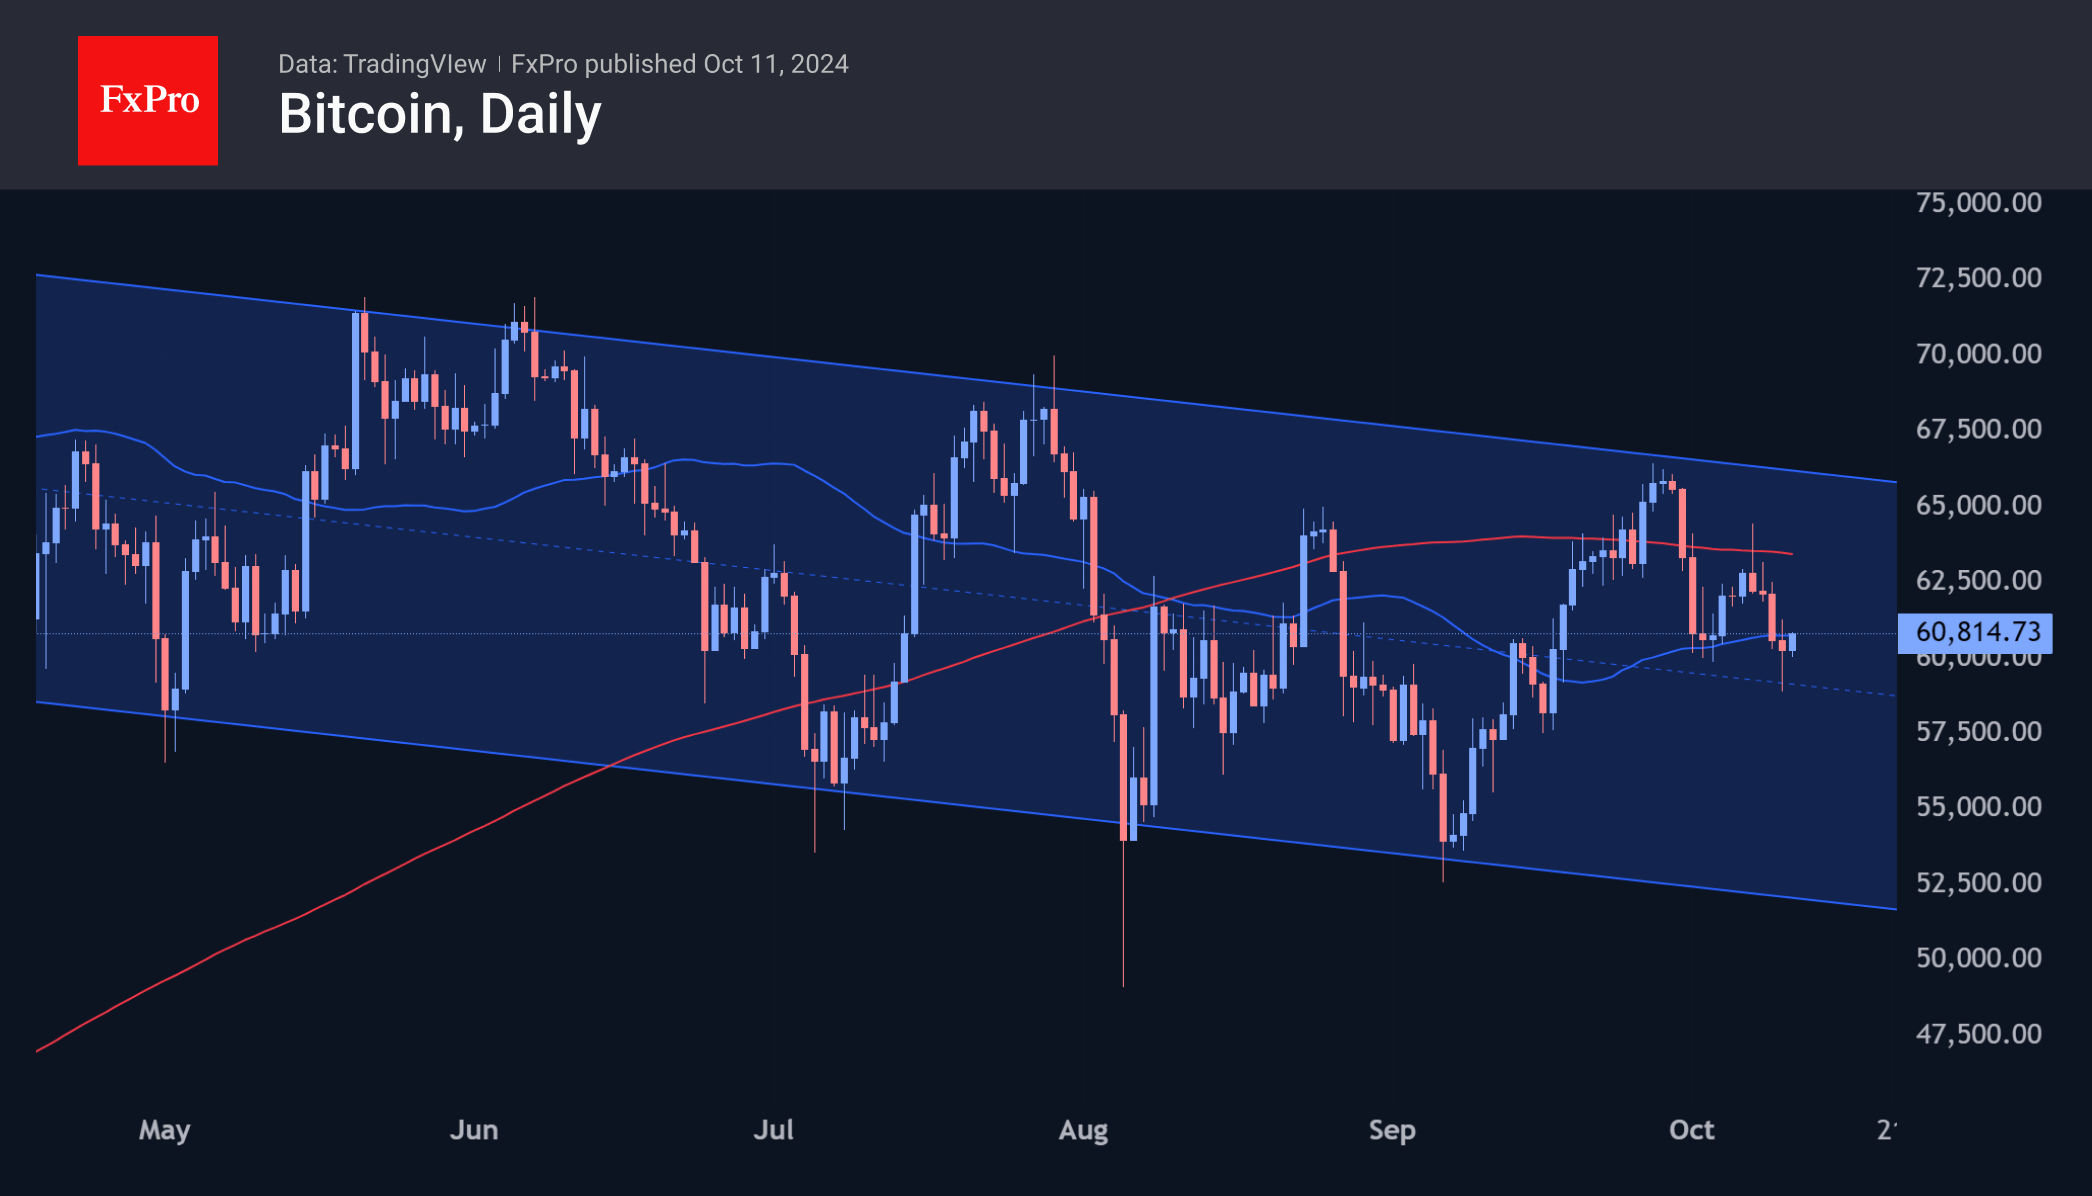
Since the beginning of the week, Bitcoin’s intraday momentum has been dominated by declines during the US session. The intensification of the sell-off was clearly visible on Wednesday and Thursday, with losses from peak to trough exceeding 3%. The first cryptocurrency fell below $59K before recovering to $60.5K at the time of writing. The momentum of the previous day’s sell-off sent BTCUSD below its 50-day MA, and on the morning’s recovery, the price is attempting to move higher again.
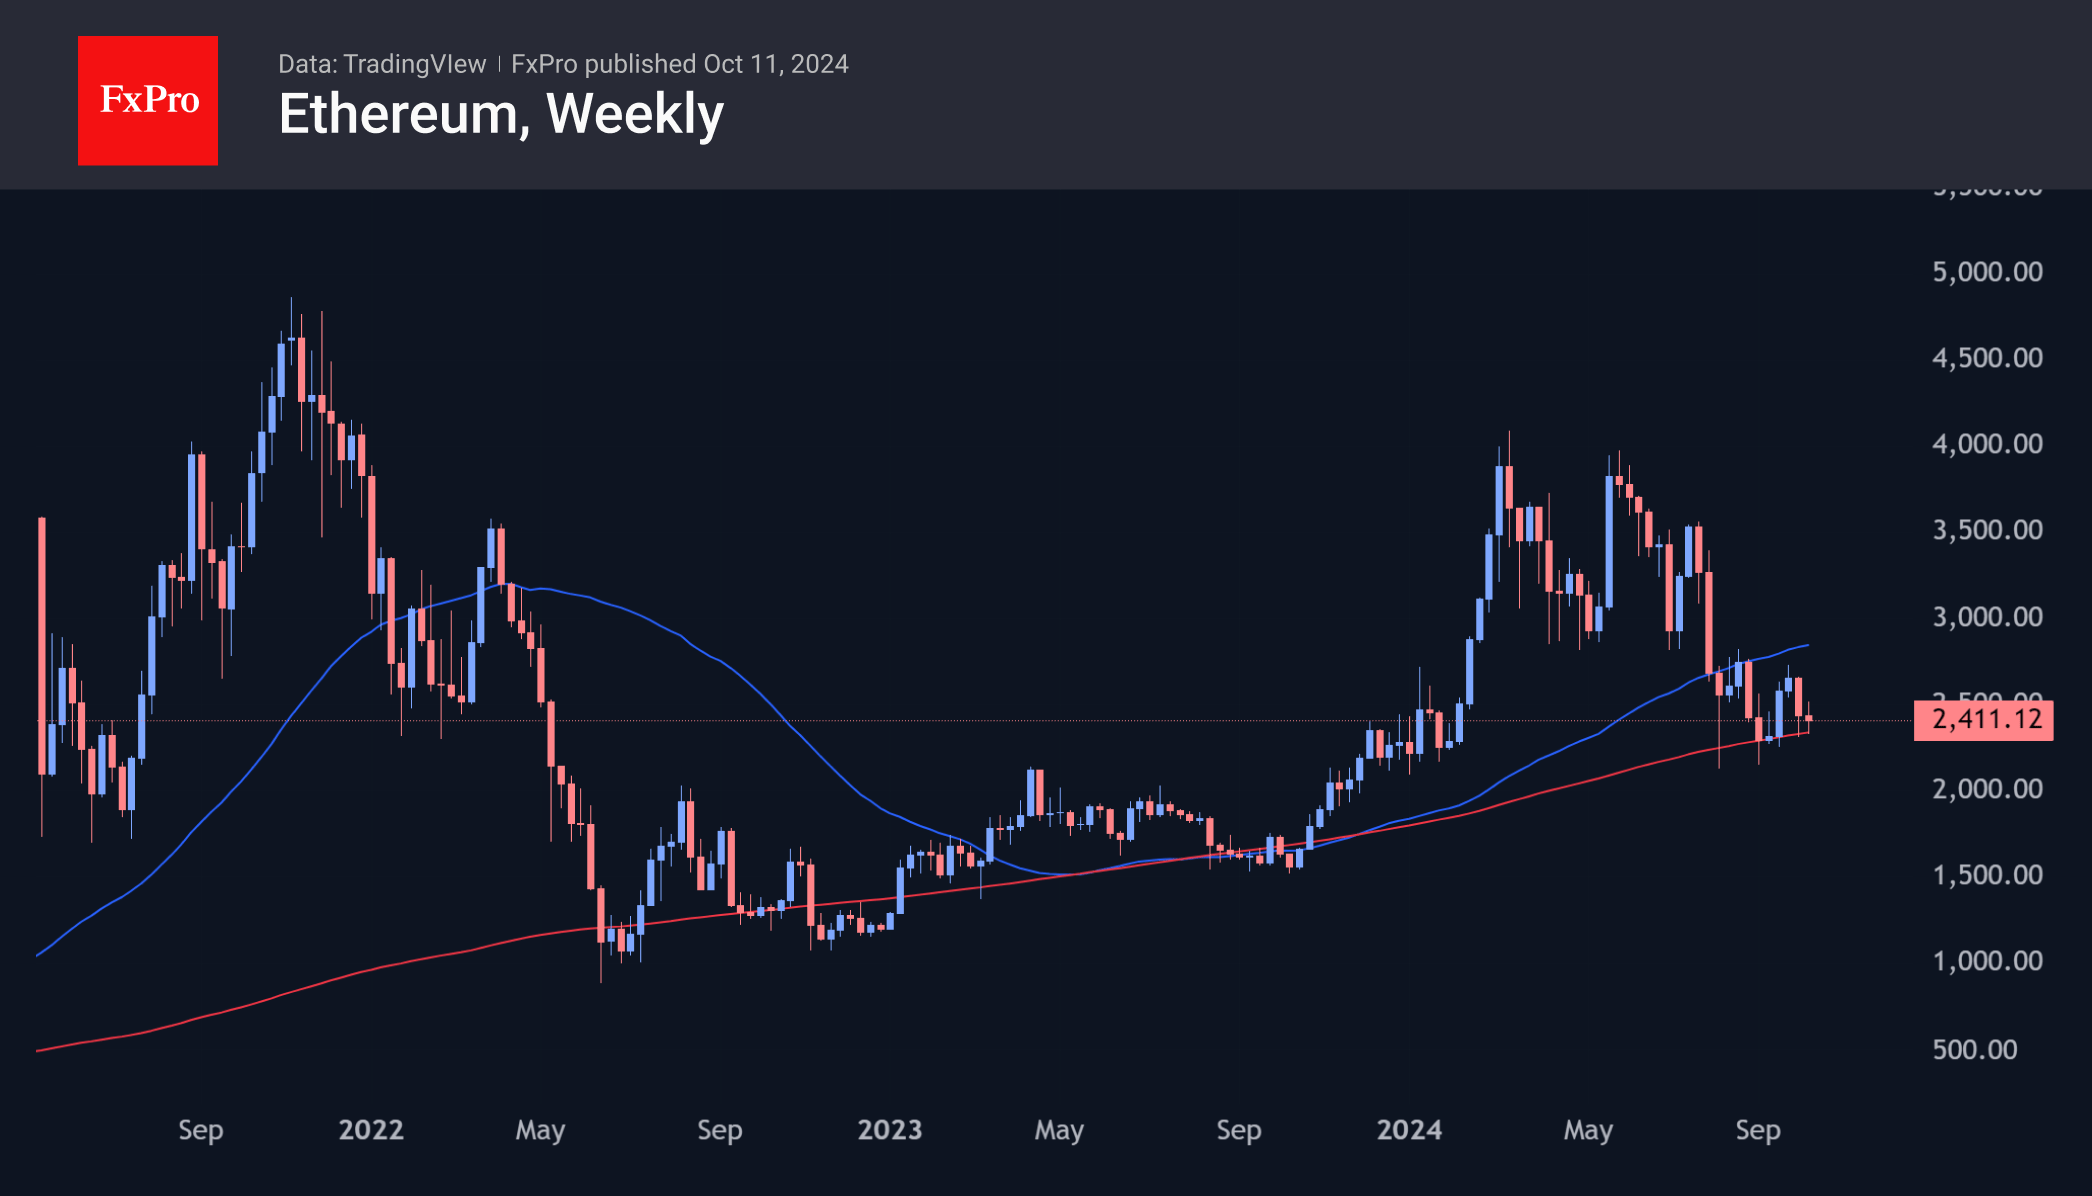
Ethereum was back at $2,400 on Friday, where it started the week. The rally we saw at the end of last week failed to develop, and the failure to make the local low was another touch of the 200-week MA, a long-term support line from which it has failed to break away for the ninth week. Ethereum was only weaker in 2020.
News Background
According to QCP Capital, the rise in funding rates for perpetual contracts indicates the cryptocurrency market’s vulnerability to a correction. In the medium and long term, the experts remain bullish and recommend applying accumulation strategies, betting on the short-term nature of the correction.
OXT Research noted that some 7,000 ETH worth $16.7 million seized from the organisers of the PlusToken cryptocurrency pyramid scheme have been transferred to exchanges. This could mean the sale of all remaining 542K ETH worth $1.3 billion. The vast majority of PlusToken’s bitcoins, about $1.3 billion, were sold between 2019 and 2020.
SEC chief Gary Gensler said Bitcoin and other cryptocurrencies will be seen in the future as a store of value rather than a widely used payment instrument. He cited the 19th-century Copernicus-Gresham Law, which states that ‘bad money drives out good money’ and that countries prefer to have only one type of money.
Nobuaki Kobayashi, the trustee of bankrupt crypto exchange Mt. Gox, said in an official letter that the deadline to compensate affected creditors will be extended for another year, until 31 October 2025.
EURJPY Moves Within Consolidation Area
- EURJPY struggles to drop beneath 38.2% Fibonacci
- MACD and RSI have weak momentum
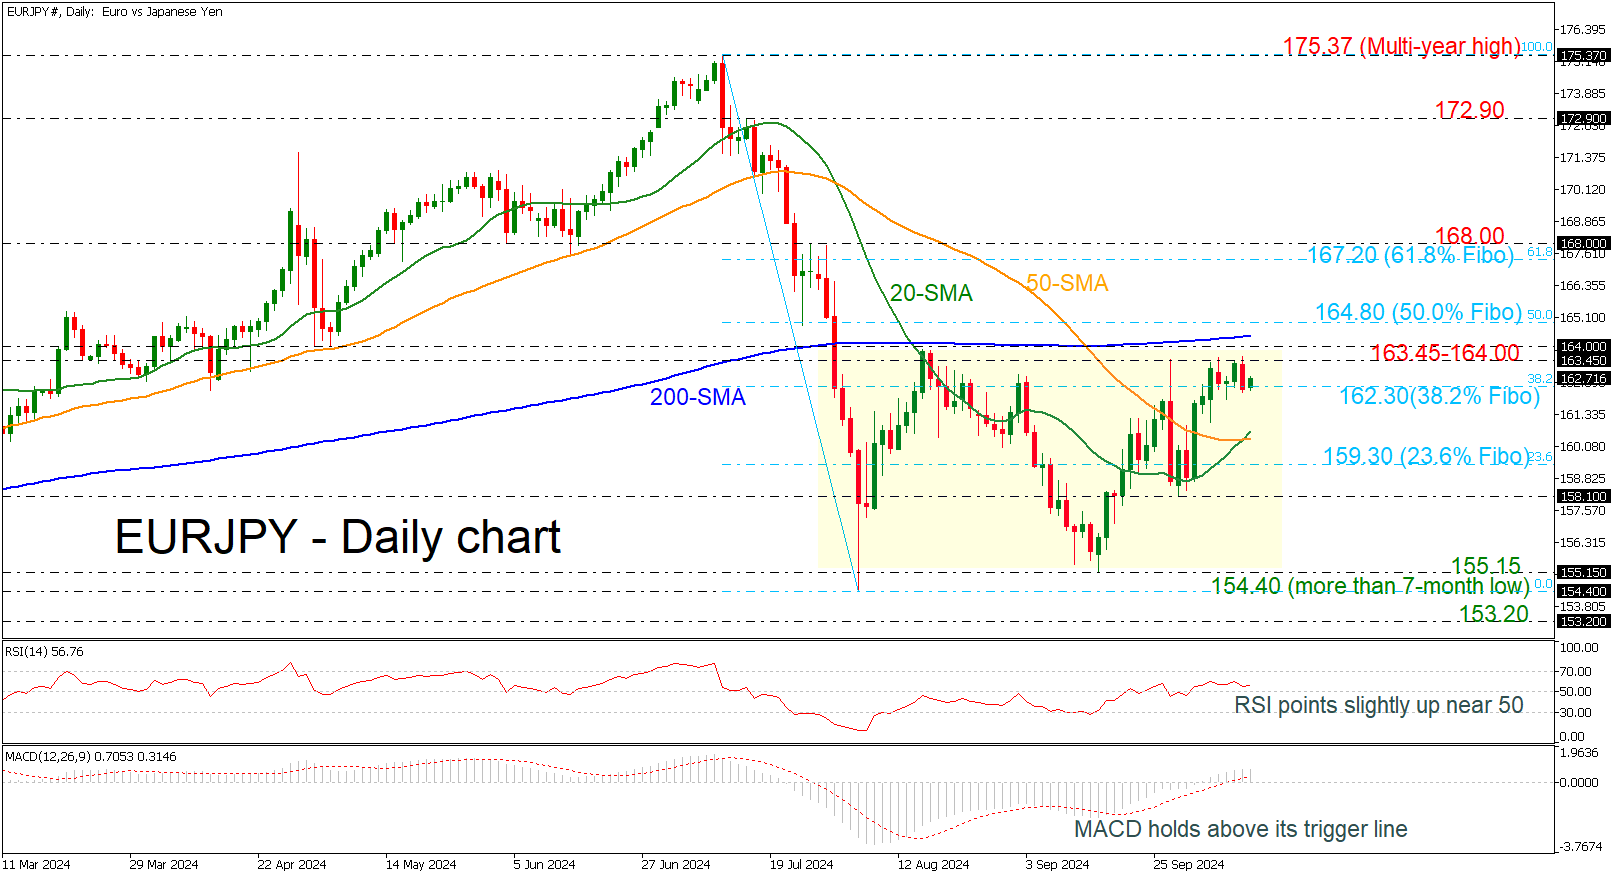
EURJPY has been developing within a trading range of 155.15-164.00 over the last couple of months, with strong resistance coming from the 200-day simple moving average (SMA) around 164.40.
Technically, the RSI is pointing slightly above the neutral threshold of 50; however, the MACD is failing to extend its positive momentum, moving horizontally above its trigger and zero lines.
If the market rises above the upper boundary of the sideways channel and the 200-day SMA, then it may rest near the 50.0% Fibonacci retracement level of the downward wave from 175.37 to 154.40 at 164.80. Even higher, the 61.8% Fibonacci level of 167.20 could potentially halt the upward trend.
Alternatively, the 38.2% Fibonacci of 162.30 is acting as a significant support level, and a slip below it could take the bears until the bullish crossover within the 20- and 50-day SMAs at 160.30. Below that, the 23.6% Fibonacci of 159.30 may attract traders’ attention as well.
All in all, EURJPY is failing to have a clear direction, and only a move above 164.00 or below 155.15 would change the current outlook.
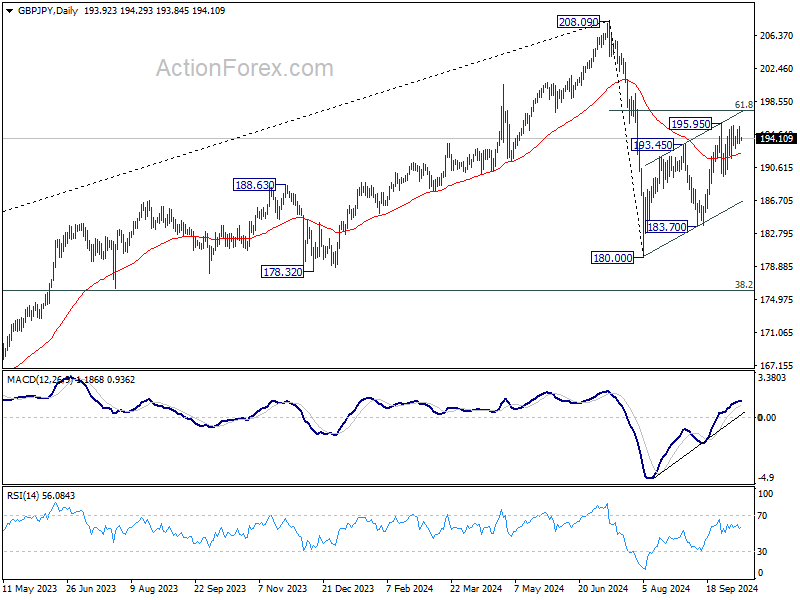
GBP/JPY Daily Outlook
Daily Pivots: (S1) 193.26; (P) 194.38; (R1) 195.18; More...
Intraday bias in GBP/JPY remains neutral for the moment. On the upside break of 195.95 will resume whole rise from 180.00 to 61.8% retracement of 208.09 to 180.00 at 197.35 next. On the downside, break of 189.54 will turn bias back to the downside for 183.70 support instead.
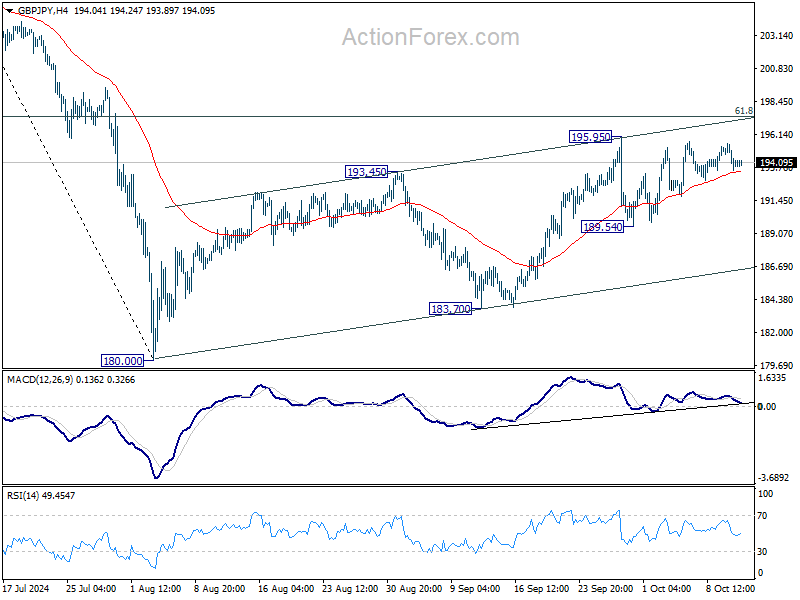
In the bigger picture, price actions from 208.09 are seen as a correction to whole rally from 123.94 (2020 low). The range of consolidation should be set between 38.2% retracement of 123.94 to 208.09 at 175.94 and 208.09. However, decisive break of 175.94 will argue that deeper correction is underway.